of the apparent digestibility coefficients for Nile tilapia
Rafael Lopes da Silva(1), Eric Portilho de Araújo(1), Mariucha Karina Honório Ribeiro Rocha(1), Flavia Mota Damasceno(1), Jakeline Marcela Azambuja de Freitas(1), Maria Márcia Pereira Sartori(2),
Paulo Roberto de Lima Meirelles(1), Margarida Maria Barros(1) and Luiz Edivaldo Pezzato(1)
(1)Universidade Estadual Paulista Júlio de Mesquita Filho (Unesp), Faculdade de Medicina Veterinária e Zootecnia, Departamento de Melhoramento e Nutrição Animal, Fazenda Experimental Lageado, Caixa Postal 560, CEP 18618-000 Botucatu, SP, Brazil. E-mail: [email protected], [email protected], [email protected], [email protected], [email protected], [email protected], [email protected], [email protected] (2)Unesp, Faculdade de Ciências Agronômicas, Departamento de Produção e Melhoramento Vegetal, Fazenda Experimental Lageado, Caixa Postal 237, CEP 18610-307 Botucatu, SP, Brazil. E-mail: [email protected]
Abstract – The objective of this work was to evaluate the diet components – crude fiber, neutral detergent fiber, acid detergent fiber, hemicellulose, cellulose, and lignin – as internal indicators in the determination of the apparent digestibility coefficients of dry matter, gross energy, and of the nutrients – crude protein, phosphorus, and amino acids – in Nile tilapia (Oreochromis niloticus). Groups of ten juveniles (80.3±1 g) were randomly distributed in six tanks of 250 L and fed two practical diets, either of a plant-origin diet or of a plant- and animal-origin diet. Both diets were supplemented with 0.1% chromium (III) oxide (Cr2O3). Faeces were collected by the modified Guelph system. The apparent digestibility coefficients were determined by the content difference of the internal indicators, present in the diets and faeces, and compared by Dunnett’s test to those obtained by the use of Cr2O3. Cellulose was effective in the determination of the apparent digestibility of dry matter, energy, and nutrients of both experimental diets; and the acid detergent fiber was effective only for the diet composed exclusively of plant-origin ingredients. The use of crude fiber, neutral detergent fiber, hemicellulose, and lignin as digestibility indicators was inefficient for the analyzed nutrients of both diets. Therefore, cellulose is the most suitable indicator for digestibility evaluation in Nile tilapia.
Index terms: Oreochromis niloticus, cellulose, fiber, nutrients.
Componentes da dieta como indicadores internos na determinação
dos coeficientes de digestibilidade aparente em tilápia-do-nilo
Resumo – O objetivo deste trabalho foi avaliar os componentes da dieta – fibra bruta, fibra em detergente neutro, fibra em detergente ácido, hemicelulose, celulose e lignina – como indicadores internos na determinação dos coeficientes de digestibilidade aparente da matéria seca, da energia bruta e dos nutrientes – proteína bruta, fósforo e aminoácidos – em tilápia-do-nilo (Oreochromis niloticus). Grupos de dez juvenis (80,3±1 g) foram aleatoriamente distribuídos em seis tanques de 250 L e alimentados com duas dietas práticas, ou com ingredientes de origem vegetal ou de origem vegetal e animal. Ambas as dietas foram suplementadas com 0,1% de óxido de cromo-III (Cr2O3). As fezes foram coletadas pelo sistema Guelph modificado. Os coeficientes de digestibilidade aparente foram determinados pela diferença de teor dos indicadores internos, presentes nas dietas e nas fezes, e comparados, pelo teste de Dunnett, aos obtidos pelo uso de Cr2O3. A celulose foi efetiva na determinação dos coeficientes de digestibilidade aparente da matéria seca, da energia e dos nutrientes de ambas as dietas; e a fibra em detergente ácido foi efetiva apenas para a dieta que continha exclusivamente ingredientes de origem vegetal. A utilização de fibra bruta, fibra em detergente neutro, hemicelulose e lignina, como indicadores de digestibilidade, mostrou-se ineficiente quanto aos nutrientes analisados de ambas as dietas. Assim, a celulose é o indicador mais apropriado para a avaliação de digestibilidade em tilápia-do-nilo. Termos para indexação: Oreochromis niloticus, celulose, fibra, nutrientes.
Introduction
In intensive animal farming, feed is the main or exclusive source of nutrients for fish, accounting
for 50–70% of production costs (Guimarães et
matter in the production systems. Under tropical
conditions, this excess is rapidly mineralized
and becomes readily available for phytoplankton growth, with a consequent decrease of water transparency and change of water quality. As a result, a decrease occurs in the concentration of dissolved oxygen, especially at night, leading to respiratory and biochemical stresses that induce to serious fish health risks, and to possible production losses (Cyrino et al., 2010).
Nile tilapia is the sixth most cultivated fish species
in the world (Michelato et al., 2013; Tacon & Metian,
2013) and the most cultivated one in Brazil. In the country, the animal feed industry certifies the feed
quality by the performance responses obtained mainly by weight gain and apparent feed conversion.
Unfortunately, the apparent digestibility coefficient
of the nutrients is not determinant in the choice of feeds, whether due to the absence of these values as
a rule, or to the difficulty of obtaining them, without
reprocessing the feeds, for the inclusion of an external indicator of digestibility.
Determining the values for apparent digestibility
coefficients by dietary components would enable
investigations of the nutritional value of commercial feeds, which could help with the development of low-polluting feeds. In this sense, some components have been evaluated and used as indicators of internal
digestibility for fish, such as crude fiber (Morales et
al., 1999; Vidal Junior et al., 2004; Krontveit et al.,
2014), neutral detergent fiber (Furuya et al., 2004), acid detergent fiber (Vidal Junior et al., 2004),
hydrolysis-resistant organic matter (Buddington, 1980), acid-insoluble ash (Vidal Junior et al., 2004; Li et al., 2008; Da et al., 2013) and acid-detergent insoluble ash (Vidal Junior et al., 2004). However, the use of these components remains contradictory because the chemical composition of the evaluated
diet may affect the obtained coefficients (Morales et
al., 1999).
The objective of this work was to evaluate the diet
components – crude fiber (CF), neutral detergent fiber (NDF), acid detergent fiber (ADF), hemicellulose,
cellulose, and lignin – as internal indicators in the
determination of apparent digestibility coefficients
(ADC) of dry matter (DM), gross energy, and of the nutrients – crude protein (CP), phosphorus, and amino acids – in Nile tilapia.
Materials and Methods
The experiment was carried out at the laboratory for nutrition of aquatic organisms (AquaNutri) of
Faculdade de Medicina Veterinária e Zootecnia,
Universidade Estadual Paulista Júlio de Mesquita Filho, in the municipality of Botucatu, in the state
of São Paulo, Brazil. The adopted procedures were
approved by the institution’s animal ethics committee (CEUA), with the protocol No. 132/2014.
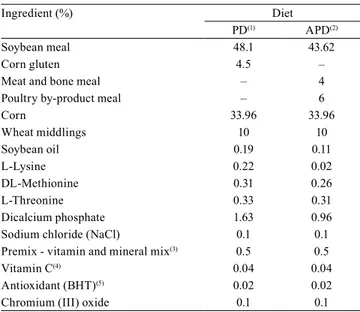
To meet the Nile tilapia nutritional requirements (Furuya, 2010), two practical diets were prepared:
the first one was made exclusively with plant-origin
ingredients, and the second one was made with animal- and plant-origin ingredients (Table 1). Chromium (III)
oxide (Cr2O3) at 0.1% (m/m) was added to both diets,
and used as the standard external indicator, which is
widely used in fish digestibility assays (Guimarães
et al., 2008b, 2008c; Xavier et al., 2014; Vidal et al., 2015).
For the preparation of the feeds, all ingredients were
milled (0.4 mm diameter), weighed, and homogenized.
Table 1. Composition of the experimental diets.
Ingredient (%) Diet PD(1) APD(2)
Soybean meal 48.1 43.62
Corn gluten 4.5 –
Meat and bone meal – 4 Poultry by-product meal – 6
Corn 33.96 33.96
Wheat middlings 10 10
Soybean oil 0.19 0.11
L-Lysine 0.22 0.02
DL-Methionine 0.31 0.26
L-Threonine 0.33 0.31
Dicalcium phosphate 1.63 0.96 Sodium chloride (NaCl) 0.1 0.1 Premix - vitamin and mineral mix(3) 0.5 0.5
Vitamin C(4) 0.04 0.04
Antioxidant (BHT)(5) 0.02 0.02
Chromium (III) oxide 0.1 0.1
(1)PD, diet containing exclusively plant-origin ingredients. (2)APD, diet
containing animal- and plant-origin ingredients. (3)Premix (Tectron,
To-ledo, PR), vitamin and mineral mix (kg of product): vitamin A, 1,000,000 IU; vitamin D3, 500,000 IU; vitamin E, 20,000 IU; vitamin K3, 500 mg;
vitamin B1, 1,900 mg; vitamin B2, 2,000 mg; vitamin B6, 2,400 mg;
vita-min B12, 3,500 mcg; vitavita-min C, 25 g; niacin, 5,000 mg; calcium
pantothe-nate, 4,800 mg; folic acid, 200 mg; biotin, 40 mg; Mn, 7,500 mg; Zn, 25
g; Fe, 12.5 g; Cu, 2,000 mg; I, 200 mg; Se, 70 mg; antioxidant, 300 mg. (4)
Vitamin C Rovimix Stay-35 (DMS Nutritional Products, Switzerland). (5)
After the addition of water at 55°C (20% of the total
mass), the mixtures were extruded (Exteec, Ribeirão Preto, SP, Brazil). Subsequently, the mixtures were
dried in an oven at 55°C, for 24 hours, and stored in labelled plastic containers in a cold chamber (5°C) until use. The composition of the diets are shown in the Tables 1 and 2.
For fish feeding, six circular fiberglass tanks (250 L), connected to a physical and biological filter with a
continuous water-recirculation system, were used.
For the collection of faeces, six cylindrical fiberglass
tanks of 300 L, each with a conical bottom, were used,
with a physical-biological filter and individual water
recirculation system. The physicochemical parameters of water, such as pH (6.66±0.04) and dissolved oxygen
(6.23±0.22 mg L-1) were measured weekly using a
YSI-556 multiparameter probe (YSI Environmental, Yellow Spring, OH, USA). Total ammonia content (0.002±0.000 ppm) was measured weekly using a
Labcon commercial kit (Alcon, Camboriú, SC, Brazil).
The temperature was measured daily (25.3±0.5°C). The photoperiod was of 12 hours, and it was controlled
with fluorescent lamps.
Masculinized juveniles of Nile tilapia (80.3±1 g) were stocked (ten fish per cage) in six cylindrical cages
of 120 L made of a plastic screen (1.5 cm mesh). The cages, placed in the feeding tanks, were used to house
fish and to facilitate handling between the feeding and fecal collection tanks. For seven days, fish remained in
the feeding tanks for adaptation to the handling and to the feeds, which were given four times a day – at 8:00, 11:00, 14:00, and 15:00 h until apparent satiation.
Subsequently, the feed was supplied hourly (from
8:00 to 5:00 h); at the end of the day (6:00 h), fish were
transferred to the fecal collection tanks, where they remained overnight. In the morning of the following
day (8:00 h), fish were returned to their respective
feeding tanks, and faeces were collected with sampling vials (200 mL) connected to the bottom of the collection tanks. This procedure was carried out for 14 days, which allowed of the obtention of a representative fecal volume for the chemical-nutritional analysis (±6 g per tank, in the DM basis). The collected faeces were dehydrated in an oven at 55°C, for 48 hours, ground, and stored at -20°C.
The determinations of DM, CP, ether extract, and mineral matter of the feeds and faeces were performed according to the methodologies described by AOAC
(Silva & Queiroz, 2006). Gross energy was estimated
by the combustion of samples in a bomb calorimeter C200 (IKA, Staufen, BW, Germany). Phosphorus
was quantified by the vanadomolybdophosphoric
acid method (Moraes et al., 2009). Amino acid analysis was performed by high-performance liquid chromatography (HPLC) at the laboratory CBO
Análises Laboratoriais (Campinas, SP, Brazil).
The indicators were determined as below described.
Crude fiber was quantified by the Weende method (Silva & Queiroz, 2006), whereas the NDF, ADF,
Table 2. Composition of the experimental diets on a dry-matter basis.
Composition Diet
PD(1) (%) APD(2) (%)
Dry matter 94.36 93.98 Gross energy (kcal kg-1) 4,390 4,338
Crude protein 31.76 32.18 Ether extract 3.29 4.18
Ash 5.60 6.91
Phosphorus 0.80 1.10
Essential amino acids
Arginine 2.26 2.43
Histidine 0.74 0.97
Isoleucine 0.95 0.85
Leucine 2.84 2.50
Lysine 1.99 1.97
Phenylalanine 1.47 1.39
Methionine 0.52 0.61
Threonine 1.13 1.31
Tryptophan 0.28 0.23
Valine 0.93 0.96
Nonessential amino acids
Alanine 1.67 1.76
Aspartic acid 3.14 3.18
Cystine 0.67 0.45
Glycine 1.77 2.49
Glutamic acid 6.09 5.84
Proline 2.79 2.88
Serine 1.66 1.62
Tyrosine 0.74 0.74
Indicator
Chromium (III) oxide 0.10 0.10
Crude fiber 4.33 4.46
Neutral detergent fiber 19.19 21.56
Acid detergent fiber 6.78 8.61 Hemicellulose 12.41 12.95
Cellulose 5.00 6.25
Lignin 0.87 0.80
(1)PD, diet containing exclusively plant-origin ingredients. (2)PAD, diet
cellulose, and lignin were measured according to the sequential methodology described by Van Soest et al. (1991). The hemicellulose content was obtained by the equation (NDF - ADF). The content of chromium (III) oxide was determined according to the methodology of Bremer Neto et al. (2005).
The calculations of the ADCs of the DM, energy, and nutrients (CP, phosphorus, and amino acids) of the experimental diets were carried out using the external
Cr2O3 standard indicator, and the calculations of the
remaining internal indicators were performed using the equations described by Maynard & Loosli (1969) and Bureau & Hua (2006), respectively, as follows:
ADCDM = 1 - (Id / If), in which ADCDM is the apparent DM
digestibility coefficient, Id is the indicator percentage in
the diet, and If is the indicator percentage in the faeces.
Furthermore, ADCN = 1 - [(Id / If)×(Nf / Nd)], in which
ADCN is the ADC of the nutrient, Id is the indicator
percentage in the diet, If is the indicator percentage
in the faeces, Nf is the nutrient percentage (or kcal
kg-1 gross energy) in the faeces, and N
d is the nutrient
percentage (or kcal kg-1 gross energy) in the diet.
The experiment was carried out in a completely
randomized design in a split-plot arrangement, with
repeated measures, and three replicates for each diet. The plots consisted of the two diets, and the subplots consisted of the seven digestibility indicators.
Data were previously analyzed for normality by the
Shapiro-Wilk’s test, and based on this premise, they were subjected to the analysis of variance for the one-factor model, at 5% probability. The Dunnett’s test was used to compare the ADC means, obtained when using
the standard external indicator Cr2O3, to those means
provided by the evaluated internal indicators. The analyses were performed by the Minitab statistical software, version 16 (Minitab, Inc., State College, PA, USA).
Results and Discussion
The diet with animal- and plant-origin ingredients showed a higher percentage of CF, NDF, ADF, hemicellulose, and cellulose than the diet containing exclusively plant-origin ingredients (Table 2). This result may be associated with the ingredients meat-and-bone meal and poultry by-product meal, whose inclusion, although at lower levels than the maximum
recommended one for the species (Hernández et al.,
2010; Abimorad et al., 2014), may have affected the determination of the obtained values due to the chemical composition of these ingredients, which comprised a high content of ether extract and mineral matter (Van Soest et al., 1991).
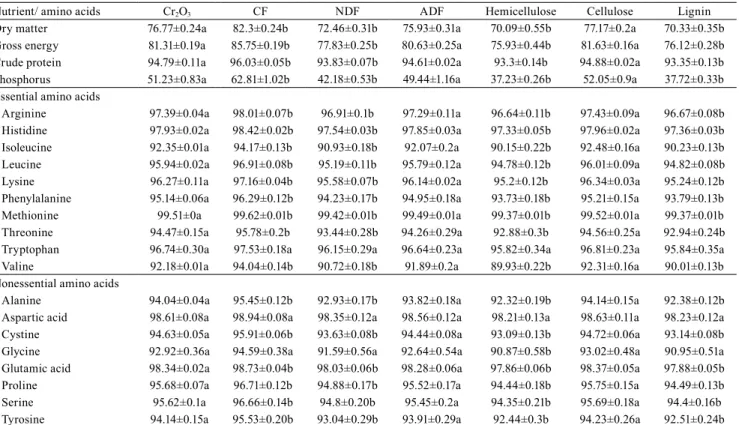
The ADF compared with the values obtained with
the Cr2O3 standard indicator provided an adequate
determination of the ADCs of the DM, energy, and nutrients of the diet that exclusively contained ingredients of plant origin (Table 3). However, there is
a result reported on a study on tambaqui (Colossoma
macropomum) whose ADF provided values which
differed from those obtained with Cr2O3, when the
digestibility coefficients of DM and CP of finely
ground corn and soybean meal were evaluated (Vidal Junior et al., 2004). Like ADF, the use of cellulose as an indicator of digestibility provided similar ADCs for the DM, energy, and nutrients in the diet with plant-origin ingredients only (Table 3), in comparison with the values obtained by using the external standard
indicator Cr2O3.
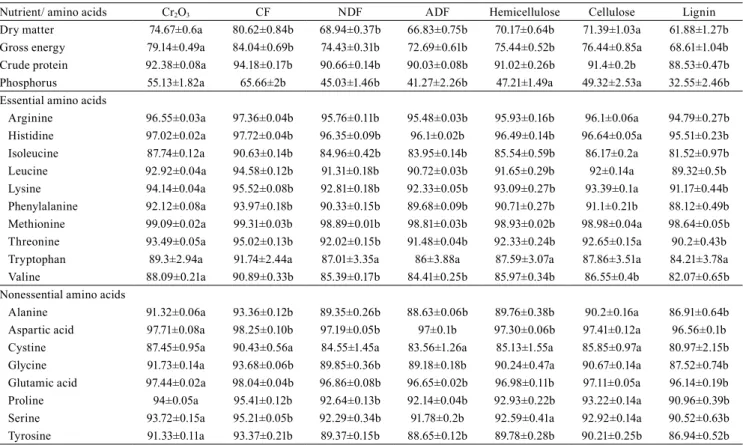
In the determination of ADC and cellulose of the diet with animal- and plant-origin ingredients, it was observed that ADF provided values lower than
those obtained using Cr2O3 for the DM, energy, and
nutrients (p<0.05), while the cellulose provided lower values only for CP and for the essential amino acids phenylalanine and valine (p<0.05) (Table 4). The ADF consists mostly of cellulose and lignin, and it is basically used as a pre-extracted material for the determination of lignin, by the methods of acid detergent lignin or potassium permanganate lignin
(Silva & Queiroz, 2006). Although Saha et al. (2006)
reported the isolation of bacteria strains with cellulase
activity, in the intestine of Mozambique tilapia
(O. mossambicus), the coefficients obtained with the
ADF and cellulose in the present study for the diet with exclusively plant-origin ingredients indicate that no degradation occurred in these components by Nile tilapia. The lower ADCs provided by using ADF and cellulose (for CP and the amino acids phenylalanine and valine) as indicators of diet digestibility, with animal- and plant-origin ingredients, may be
attributed to the influence of the meat-and-bone meal
and poultry by-product meal on the values (Van Soest et al., 1991).
The use of CF, in comparison with the data obtained
with Cr2O3 resulted in higher ADCs for the DM, energy,
Crude fiber does not represent a homogeneous group
of substances, as it is composed mainly of nonstarch polysaccharides (NSP) (Goñi et al., 2009). The NSP
fraction can be classified as insoluble (cellulose
and hemicellulose) and soluble (pectins, gums, and mucilages), according to its solubility in water. The soluble NSP is digestible during the passage through the digestive tract (Amirkolaie et al., 2005; Krogdahl et al., 2005). In the present study, the ADC of the NSP fraction was not determined. However, according to
the coefficients provided by the CF as an indicator of
digestibility, it is possible that NSP fraction has not undergone degradation. Determination of the CF by
the Weende’s method may have affected the obtained
coefficients because, in the Weende’s method, parts
of the hemicellulose and the lignin are solubilized
and become part of the nitrogen-free extract (Silva &
Queiroz, 2006).
The use of NDF and hemicellulose as indicators of digestibility provided lower ADCs for the DM, energy, and nutrients, in both diets (p<0.05), in comparison with
the standard indicator Cr2O3 (Tables 3 and 4), which
may be associated with the solubilization of pectin by
the neutral detergent solution (Van Soest et al., 1991). Pectin constitutes the cell wall of plants, together with the structural carbohydrates (cellulose and hemicellulose) and lignin (Van Soest et al., 1991), and it is described by Brito et al. (2008) as nondigestible by monogastric animals. As pectin constitutes a relevant
percentage of the cell wall of soybean meal (Queiroz et
al., 2010), and this ingredient corresponds to the protein
base of both diets, its solubilization may have affected the determination of the coefficients, when the NDF
was used as an indicator. In turn, the hemicellulose, obtained by subtraction of NDF by ADF, may also
have been changed by this solubilization.
Nutrient/ amino acids Cr2O3 CF NDF ADF Hemicellulose Cellulose Lignin
Dry matter 76.77±0.24a 82.3±0.24b 72.46±0.31b 75.93±0.31a 70.09±0.55b 77.17±0.2a 70.33±0.35b Gross energy 81.31±0.19a 85.75±0.19b 77.83±0.25b 80.63±0.25a 75.93±0.44b 81.63±0.16a 76.12±0.28b Crude protein 94.79±0.11a 96.03±0.05b 93.83±0.07b 94.61±0.02a 93.3±0.14b 94.88±0.02a 93.35±0.13b Phosphorus 51.23±0.83a 62.81±1.02b 42.18±0.53b 49.44±1.16a 37.23±0.26b 52.05±0.9a 37.72±0.33b Essential amino acids
Arginine 97.39±0.04a 98.01±0.07b 96.91±0.1b 97.29±0.11a 96.64±0.11b 97.43±0.09a 96.67±0.08b Histidine 97.93±0.02a 98.42±0.02b 97.54±0.03b 97.85±0.03a 97.33±0.05b 97.96±0.02a 97.36±0.03b Isoleucine 92.35±0.01a 94.17±0.13b 90.93±0.18b 92.07±0.2a 90.15±0.22b 92.48±0.16a 90.23±0.13b Leucine 95.94±0.02a 96.91±0.08b 95.19±0.11b 95.79±0.12a 94.78±0.12b 96.01±0.09a 94.82±0.08b Lysine 96.27±0.11a 97.16±0.04b 95.58±0.07b 96.14±0.02a 95.2±0.12b 96.34±0.03a 95.24±0.12b Phenylalanine 95.14±0.06a 96.29±0.12b 94.23±0.17b 94.95±0.18a 93.73±0.18b 95.21±0.15a 93.79±0.13b Methionine 99.51±0a 99.62±0.01b 99.42±0.01b 99.49±0.01a 99.37±0.01b 99.52±0.01a 99.37±0.01b Threonine 94.47±0.15a 95.78±0.2b 93.44±0.28b 94.26±0.29a 92.88±0.3b 94.56±0.25a 92.94±0.24b Tryptophan 96.74±0.30a 97.53±0.18a 96.15±0.29a 96.64±0.23a 95.82±0.34a 96.81±0.23a 95.84±0.35a Valine 92.18±0.01a 94.04±0.14b 90.72±0.18b 91.89±0.2a 89.93±0.22b 92.31±0.16a 90.01±0.13b Nonessential amino acids
Alanine 94.04±0.04a 95.45±0.12b 92.93±0.17b 93.82±0.18a 92.32±0.19b 94.14±0.15a 92.38±0.12b Aspartic acid 98.61±0.08a 98.94±0.08a 98.35±0.12a 98.56±0.12a 98.21±0.13a 98.63±0.11a 98.23±0.12a Cystine 94.63±0.05a 95.91±0.06b 93.63±0.08b 94.44±0.08a 93.09±0.13b 94.72±0.06a 93.14±0.08b Glycine 92.92±0.36a 94.59±0.38a 91.59±0.56a 92.64±0.54a 90.87±0.58b 93.02±0.48a 90.95±0.51a Glutamic acid 98.34±0.02a 98.73±0.04b 98.03±0.06b 98.28±0.06a 97.86±0.06b 98.37±0.05a 97.88±0.05b Proline 95.68±0.07a 96.71±0.12b 94.88±0.17b 95.52±0.17a 94.44±0.18b 95.75±0.15a 94.49±0.13b Serine 95.62±0.1a 96.66±0.14b 94.8±0.20b 95.45±0.2a 94.35±0.21b 95.69±0.18a 94.4±0.16b Tyrosine 94.14±0.15a 95.53±0.20b 93.04±0.29b 93.91±0.29a 92.44±0.3b 94.23±0.26a 92.51±0.24b
(1)Mean±standard error of the mean (n=3). (2)Means followed by equal letters, in the rows, do not differ from one another by the Dunnett’s test, at 5%
probability.
Table 3. Apparent digestibility coefficients(1) (ADC, %) of dry matter, gross energy, and nutrients estimated using chromium
(III) oxide (Cr2O3), crude fiber (CF), neutral detergent fiber (NDF), acid detergent fiber (ADF), hemicellulose, cellulose, and
As observed with the use of NDF and hemicellulose, the use of lignin as an indicator of digestibility resulted in lower ADCs for the DM, energy, and nutrients (p<0.05), except for the values obtained for the amino acids tryptophan, aspartic acid, and glycine of the diet with exclusively plant-origin ingredients (Tables 3 and 4).
The ADF and the cellulose were effective in determining the ADC of the DM, energy, and nutrients of the diet that contained exclusively plant-origin ingredients. Regarding the diet with animal- and plant-origin ingredients, only cellulose was effective in determining the ADCs. This result indicates the possible interference of the ingredients of animal-origin in the determination of the components evaluated as internal indicators. Furthermore, it indicates the importance of subsequently evaluating diets that contain higher levels of inclusion of animal-origin
ingredients, in order to verify the possible influence
of these ingredients on determinations of the dietary cellulose and, therefore, the validity of cellulose as an internal indicator of digestibility.
Conclusions
1. Dietary cellulose is effective in determining the apparent digestibility components of dry matter, gross energy, and nutrients of diets that exclusively contain plant-origin ingredients, or animal- and plant-origin ingredients.
2. Acid detergent fiber is effective as an indicator
of digestibility only for the diet with plant-origin ingredients.
3. The use of crude fiber, neutral detergent fiber,
hemicellulose, and lignin is not effective in the
estimation of the apparent digestibility coefficients of
dry matter, gross energy, and nutrients, irrespective of the diet composition.
Table 4. Apparent digestibility coefficients(1) (ADC, %) of dry matter, gross energy, and nutrients estimated using the
external indicator chromium (III) oxide (Cr2O3), and the internal indicators crude fiber (CF), neutral detergent fiber (NDF), acid detergent fiber (ADF), hemicellulose, cellulose, and lignin as indicators in Nile tilapia fed animal- and plant-origin diet(2).
Nutrient/ amino acids Cr2O3 CF NDF ADF Hemicellulose Cellulose Lignin
Dry matter 74.67±0.6a 80.62±0.84b 68.94±0.37b 66.83±0.75b 70.17±0.64b 71.39±1.03a 61.88±1.27b Gross energy 79.14±0.49a 84.04±0.69b 74.43±0.31b 72.69±0.61b 75.44±0.52b 76.44±0.85a 68.61±1.04b Crude protein 92.38±0.08a 94.18±0.17b 90.66±0.14b 90.03±0.08b 91.02±0.26b 91.4±0.2b 88.53±0.47b Phosphorus 55.13±1.82a 65.66±2b 45.03±1.46b 41.27±2.26b 47.21±1.49a 49.32±2.53a 32.55±2.46b Essential amino acids
Arginine 96.55±0.03a 97.36±0.04b 95.76±0.11b 95.48±0.03b 95.93±0.16b 96.1±0.06a 94.79±0.27b Histidine 97.02±0.02a 97.72±0.04b 96.35±0.09b 96.1±0.02b 96.49±0.14b 96.64±0.05a 95.51±0.23b Isoleucine 87.74±0.12a 90.63±0.14b 84.96±0.42b 83.95±0.14b 85.54±0.59b 86.17±0.2a 81.52±0.97b Leucine 92.92±0.04a 94.58±0.12b 91.31±0.18b 90.72±0.03b 91.65±0.29b 92±0.14a 89.32±0.5b Lysine 94.14±0.04a 95.52±0.08b 92.81±0.18b 92.33±0.05b 93.09±0.27b 93.39±0.1a 91.17±0.44b Phenylalanine 92.12±0.08a 93.97±0.18b 90.33±0.15b 89.68±0.09b 90.71±0.27b 91.1±0.21b 88.12±0.49b Methionine 99.09±0.02a 99.31±0.03b 98.89±0.01b 98.81±0.03b 98.93±0.02b 98.98±0.04a 98.64±0.05b Threonine 93.49±0.05a 95.02±0.13b 92.02±0.15b 91.48±0.04b 92.33±0.24b 92.65±0.15a 90.2±0.43b Tryptophan 89.3±2.94a 91.74±2.44a 87.01±3.35a 86±3.88a 87.59±3.07a 87.86±3.51a 84.21±3.78a Valine 88.09±0.21a 90.89±0.33b 85.39±0.17b 84.41±0.25b 85.97±0.34b 86.55±0.4b 82.07±0.65b Nonessential amino acids
Alanine 91.32±0.06a 93.36±0.12b 89.35±0.26b 88.63±0.06b 89.76±0.38b 90.2±0.16a 86.91±0.64b Aspartic acid 97.71±0.08a 98.25±0.10b 97.19±0.05b 97±0.1b 97.30±0.06b 97.41±0.12a 96.56±0.1b Cystine 87.45±0.95a 90.43±0.56a 84.55±1.45a 83.56±1.26a 85.13±1.55a 85.85±0.97a 80.97±2.15b Glycine 91.73±0.14a 93.68±0.06b 89.85±0.36b 89.18±0.18b 90.24±0.47a 90.67±0.14a 87.52±0.74b Glutamic acid 97.44±0.02a 98.04±0.04b 96.86±0.08b 96.65±0.02b 96.98±0.11b 97.11±0.05a 96.14±0.19b Proline 94±0.05a 95.41±0.12b 92.64±0.13b 92.14±0.04b 92.93±0.22b 93.22±0.14a 90.96±0.39b Serine 93.72±0.15a 95.21±0.05b 92.29±0.34b 91.78±0.2b 92.59±0.41a 92.92±0.14a 90.52±0.63b Tyrosine 91.33±0.11a 93.37±0.21b 89.37±0.15b 88.65±0.12b 89.78±0.28b 90.21±0.25b 86.94±0.52b
(1)Mean±standard error of the mean (n=3). (2)Means followed by equal letters, in the rows, do not differ from one another by the Dunnett’s test, at 5%
Acknowledgments
To Fundação de Amparo à Pesquisa do Estado de São Paulo (Fapesp), for financial support (Process No.
2014/16484-0).
References
ABIMORAD, E.G.; CASTELLANI, D.; GONÇALVES, G.S.; ROMERA, D.M.; GARCIA, F.; NASCIMENTO, T.M.T. do.
Substituição parcial do farelo de soja pela farinha de carne
e ossos em dietas para juvenis de tilápia-do-nilo. Pesquisa
Agropecuária Brasileira, v.49, p.836-843, 2014. DOI: 10.1590/
S0100-204X2014001100002.
AMIRKOLAIE, A.K.; LEENHOUWERS, J.I.; VERRETH,
J.A.J.; SCHRAMA, J.W. Type of dietary fibre (soluble versus insoluble) influences digestion, faeces characteristics and
faecal waste production in Nile tilapia (Oreochromis niloticus
L.). Aquaculture Research, v.36, p.1157-1166, 2005. DOI: 10.1111/j.1365-2109.2005.01330.x.
BREMER NETO, H.; GRANER, C.A.F.; PEZZATO, L.E.; PADOVANI, C.R. Determinação de rotina do crômio em fezes, como marcador biológico, pelo método espectrofotométrico
ajustado da 1,5-difenilcarbazida. Ciência Rural, v.35, p.691-697,
2005. DOI: 10.1590/S0103-84782005000300033.
BRITO, M.S. de; OLIVEIRA, C.F.S. de; SILVA, T.R.G. da; LIMA, R.B. de; MORAIS, S.N.; SILVA, J.H.V. da. Polissacarídeos
não amiláceos na nutrição de monogástricos – revisão. Acta
Veterinaria Brasilica, v.2, p.111-117, 2008. DOI: 10.21708/
avb.2008.2.4.917.
BUDDINGTON, R.K. Hydrolysis-resistant organic matter as a
reference for measurement of fish digestive efficiency. Transactions
of the American Fisheries Society, v.109, p.653-656, 1980. DOI:
10.1577/1548-8659(1980)109<653:HOMAAR>2.0.CO;2.
BUREAU, D.P.; HUA, K. Letter to the editor of Aquaculture.
Aquaculture, v.252, p.103-105, 2006. DOI: 10.1016/j.
aquaculture.2006.01.028.
CYRINO, J.E.P.; BICUDO, Á.J. de A.; SADO, R.Y.; BORGHESI, R.; DAIRIKI, J.K. A piscicultura e o ambiente: o uso de alimentos ambientalmente corretos em piscicultura. Revista Brasileira
de Zootecnia, v.39, p.68-87, 2010. DOI:
10.1590/S1516-35982010001300009.
DA, C.T.; LUNDH, T.; LINDBERG, J.E. Digestibility of dietary components and amino acids in plant protein feed ingredients
in striped catfish (Pangasianodon hypophthalmus) fingerlings.
Aquaculture Nutrition, v.19, p.619-628, 2013. DOI: 10.1111/
anu.12011.
FURUYA, W.M. (Ed.). Tabelas brasileiras para a nutrição de tilápias. Toledo: GFM, 2010. 100p.
FURUYA, W.M.; SILVA, L.C.R.; NEVES, P.R.; BOTARO, D.;
HAYASHI, C.; FURLAN, A.C.; SANTOS, V.G. dos. Coeficientes
de digestibilidade aparente da energia e proteína da silagem de
sorgo com alto e baixo tanino pela tilápia do nilo (Oreochromis
niloticus). Ciência Rural, v.34, p.1213-1217, 2004. DOI: 10.1590/
S0103-84782004000400038.
GOÑI, I.; DÍAZ-RUBIO, M.E.; PÉREZ-JIMÉNEZ, J.;
SAURA-CALIXTO, F. Towards an updated methodology for measurement
of dietary fiber, including associated polyphenols, in food and
beverages. Food Research International, v.42, p.840-846, 2009. DOI: 10.1016/j.foodres.2009.03.010.
GUIMARÃES, I.G.; MIRANDA, E.C. de; MARTINS, G.P.;
LOURO, V.R.; MIRANDA, C.C. de. Farinha de camarão em
dietas para tilápia do Nilo (Oreochromis niloticus). Revista
Brasileira de Saúde e Produção Animal, v.9, p.140-149, 2008a.
GUIMARÃES, I.G.; PEZZATO, L.E.; BARROS, M.M. Amino
acid availability and protein digestibility of several protein sources for Nile tilapia, Oreochromis niloticus. Aquaculture Nutrition, v.14, p.396-404, 2008b. DOI: 10.1111/j.1365-2095.2007.00540.x.
GUIMARÃES, I.G.; PEZZATO, L.E.; BARROS, M.M.;
TACHIBANA, L. Nutrient digestibility of cereal grain products and by-products in extruded diets for Nile tilapia. Journal of
the World Aquaculture Society, v.39, p.781-789, 2008c. DOI:
10.1111/j.1749-7345.2008.00214.x.
HERNÁNDEZ, C.; OLVERA-NOVOA, M.A.; HARDY, R.W.; HERMOSILLO, A.; REYES, C.; GONZÁLES, B. Complete replacement of fish meal by porcine and poultry by-product meals in practical diets for fingerling Nile tilapia Oreochromis niloticus: digestibility and growth performance. Aquaculture Nutrition, v.16, p.44-53, 2010. DOI: 10.1111/j.1365-2095.2008.00639.x.
KROGDAHL, Å.; HEMRE, G.-I.; MOMMSEN, T.P.
Carbohydrates in fish nutrition: digestion and absorption in
postlarval stages. Aquaculture Nutrition, v.11, p.103-122, 2005. DOI: 10.1111/j.1365-2095.2004.00327.x.
KRONTVEIT, R.I.; BENDIKSEN, E.Å.; AUNSMO, A. Field monitoring of feed digestibility in Atlantic salmon farming using
crude fiber as an inert marker. Aquaculture, v.426-427,
p.249-255, 2014. DOI: 10.1016/j.aquaculture.2014.02.015.
LI, P.; WEBB, K.A.; GATLIN III, D.M. Evaluation of acid-insoluble ash as an indicator for digestibility determination with red drum,
Sciaenops ocellatus, and hybrid striped bass, Morone chrysops ×
M. saxatilis. Journal of the World Aquaculture Society, v.39,
p.120-125, 2008. DOI: 10.1111/j.1749-7345.2007.00144.x.
MAYNARD, L.A.; LOOSLI, J.K. Animal nutrition. 6th ed. New
York: McGraw-Hill, 1969. 613p.
MICHELATO, M.; FURUYA, W.M.; GRACIANO, T.S.; VIDAL, L.V.O.; XAVIER, T.O.; MOURA, L.B. de; FURUYA, V.R.B. Digestible methionine + cystine requirement for Nile tilapia from 550 to 700 g. Revista Brasileira de Zootecnia, v.42, p.7-12, 2013. DOI: 10.1590/S1516-35982013000100002.
MORAES, P.M. de; LOUREIRO, V.R.; PADILHA, P.M.; NEVES, R. de C.F.; SALEH, M.A.D.; SANTOS, F.A. dos; SILVA,
F.A. Determinação de fósforo biodisponível em rações de peixes utilizando extração assistida por ultra-som e espectrofotometria
no visível. Química Nova, v.32, p.923-927, 2009. DOI: 10.1590/ S0100-40422009000400018.
markers, alternative to chromic oxide, in digestibility studies with rainbow trout (Oncorhynchus mykiss). Aquaculture, v.179, p.71-79, 1999. DOI: 10.1016/S0044-8486(99)00153-2.
QUEIROZ, M.A.Á.; SUSIN, I.; PIRES, A.V.; FERREIRA, E.M.;
MENDES, C.Q.; MOURÃO, G.B. Características físico-químicas
de fontes proteicas e suas interações sobre a degradação ruminal
e a taxa de passagem. Revista Brasileira de Zootecnia, v.39, p.1587-1594, 2010. DOI: 10.1590/S1516-35982010000700027.
SAHA, S.; ROY, R.N.; SEN, S.K.; RAY, A.K. Characterization
of cellulase-producing bacteria from the digestive tract of tilapia, Oreochromis mossambica (Peters) and grass carp,
Ctenopharyngodon idella (Valenciennes). Aquaculture Research,
v.37, p.380-388, 2006. DOI: 10.1111/j.1365-2109.2006.01442.x.
SILVA, D.J.; QUEIROZ, A.C. de. Análise de alimentos: métodos
químicos e biológicos. 3.ed. Viçosa: Ed. da UFV, 2006. 235p.
TACON, A.G.J.; METIAN, M. Fish matters: importance of aquatic foods in human nutrition and global food supply.
Reviews in Fisheries Science, v.21, p.22-38, 2013. DOI:
10.1080/10641262.2012.753405.
VAN SOEST, P.J.; ROBERTSON, J.B.; LEWIS, B.A. Methods for
dietary fiber, neutral detergent fiber, and nonstarch polysaccharides
in relation to animal nutrition. Journal of Dairy Science, v.74, p.3583-3597, 1991. DOI: 10.3168/jds.S0022-0302(91)78551-2.
VIDAL JUNIOR, M.V.; DONZELE, J.L.; ANDRADE, D.R. de; SANTOS, L.C. dos. Determinação da digestibilidade da matéria seca e da proteína bruta do fubá de milho e do farelo de soja para
tambaqui (Colossoma macropomum), utilizando-se técnicas
com uso de indicadores internos e externos. Revista Brasileira
de Zootecnia, v.33, p.2193-2200, 2004. DOI:
10.1590/S1516-35982004000900003.
VIDAL, L.V.O.; XAVIER, T.O.; MICHELATO, M.; MARTINS,
E.N.; PEZZATO, L.E.; FURUYA, W.M. Apparent protein and
energy digestibility and amino acid availability of corn and co-products in extruded diets for Nile tilapia, Oreochromis niloticus.
Journal of the World Aquaculture Society, v.46, p.183-190,
2015. DOI: 10.1111/jwas.12184.
XAVIER, T.O.; MICHELATO, M.; VIDAL, L.V.O.; FURUYA, V.R.B.; FURUYA, W.M. Apparent protein and energy digestibility and amino acid availability of commercial meat and bone meal for Nile tilapia, Oreochromis niloticus. Journal of the
World Aquaculture Society, v.45, p.439-446, 2014. DOI: 10.1111/
jwas.12127.