RELATION WITH THE LANDSCAPE POSITION
Atrazina em uma área cultivada com milho e sua relação com a posição na paisagem
Regimeire Freitas Aquino1, José Maria de Lima2, Ciro Augusto de Souza Magalhães3,
Bruno Montoani Silva4, Renato Fráguas de Carvalho5, Luiz Roberto Guimarães Guilherme4
ABSTRACT
Atrazine is still being used in no-till corn production in Brazil. This herbicide can be moved by overland flow and leached in the soil profile. In both ways, it can pollute water, either by reaching the groundwater or lakes and streams close to the crop field. This study evaluated the presence of atrazine in a dystrophic Yellow-Red Argisol and a dystrophic Melanic Gleisol in a corn field, where atrazine has been applied for 11 years. Overland flow was the main process of atrazine transport on hillslope and leaching was the most important process in the floodplain. Frequency and location of atrazine application in the landscape define this herbicide contamination process.
Index terms: Herbicide, overland flow, maize.
RESUMO
Atrazina ainda é empregada em áreas sob plantio direto para a produção de milho no Brasil. Esse herbicida pode ser transportado por escoamento superficial ou pela lixiviação no perfil do solo. De uma forma ou de outra, ele pode contaminar a água do subsolo ou de lagos e cursos d’agua próximos à área de plantio. Este estudo avaliou a presença de atrazina em um Argissolo Vermelho-Amarelo distrófico e em um Gleissolo Melânico distrófico em uma área de cultivo de milho, onde a atrazina tem sido utilizada há 11 anos. O escoamento superficial foi o principal processo de transporte de atrazina na encosta e a lixiviação foi o predominante na várzea. A frequência e a localização da aplicação de atrazina na paisagem definem o processo de contaminação deste herbicida.
Termos para indexação: Herbicida, escoamento superficial, milho.
(Received in may 8, 2013 and approved in july 8, 2013)
1Instituto Federal Sudeste MG – São João del-Rei – MG – Brasil
2Universidade Federal de Lavras/UFLA – Departamento de Ciência do Solo/DCS – Cx. P. 3037 – 37200-000 – Lavras – MG – Brasil – [email protected] 3Empresa Brasileira de Pesquisa Agropecuária/Embrapa – Embrapa Agrossilvipastoril – Sinop – MT – Brasil
4Universidade Federal de Lavras/UFLA – Departamento de Ciência do Solo/DCS – Lavras – MG – Brasil 5Sandoz do Brasil Indústria Farmacêutica – Cambe – PR – Brasil
INTRODUCTION
Water contamination by agricultural chemicals (agrotoxics) can take place through overland flow and mass flow transport through soil until it reaches the saturation zone (leaching). Leaching takes place when the chemical is in the soil solution. Many studies have demonstrated the presence of atrazine and its metabolites in aquifers in several countries, resulting from its usage in agricultural areas (DELPHIN; CHAPOT, 2006; LAABS et al., 2007; SICZEK et al., 2008).
Leaching and overland flow are the main forms of transporting non-volatile water-soluble molecules in soils. These molecules move through the soil profile along with mass flow, which is governed by the difference in water potential between two points. When an organic molecule is leached, it can reach underground soil zones and in some cases can even reach the water aquifer, which can cause serious environmental impact (ARMAS et al., 2005;
LAVORENTI; PRATA; REGITANO, 2003). Atrazine was detected in surface and ground waters worldwide (SHERCHAN; BACHOON, 2011), due to its long half-life and relatively high mobility (HUANG et al., 2012).
In sloped areas, this product moves across the surface of the soil along with overland flow, reaching rivers, ponds or low-lying areas of the terrain. This movement is influenced by factors such as the rate of product application, soil and product properties, time between application and erosion process, amount of precipitation and infiltration of water in the soil, topography and type of plant cover (LAVORENTI; PRATA; REGITANO, 2003).
Thus, the objective of this work was to evaluate contamination potential and presence of atrazine herbicide in an area where maize is grown in dystrophic Red-Yellow Argisol on the hillslope, and dystrophic Tb Melanic Gleisol in the floodplain, in a typical corn field in Southeast Region Brazil. This area has been used to grown maize for eleven years, with atrazine applied systematically.
MATERIAL AND METHODS
Area characterization
The study area is located in the southern region of Minas Gerais State, Brazil. The area is equivalent to approximately 50 hectares. The representative soils are a dystrophic Red-Yellow Argisol in a 9% hillslope, (77% of the area) and a dystrophic Melanic Gleisol that takes (8% of the area), located in a contiguous floodplain (Figure 1). The remaining 15% are located on a floodplain under natural conditions (no agricultural production).
These soils have been planted with maize for 11 years with application of th e her bicide atr azin e (Gesaprim® 500 commercial product) at the recommended
dose of 3.0 L ha-1, between the months of October and
December. To manage fertility in these soils, site-specific management (precision agriculture) is used in order to maintain fertility as homogenous as possible for the needs of the crop. Maize yield in this area can be as high as 10 ton ha-1.
No-tillage farming is being used in this area for six years. After the corn harvest, cattle are released in the area until the next planting season. The Gleisol is located on a floodplain where the water table fluctuates from 70 to 50 cm of depth; there are drains in this area at 50 cm depth to control the level of the aquifer. Because of this location, maize planting and herbicide application are not dependent on the beginning of the rainy period, as in the case of the Argisol on the slope.
Sample collection and preparation for the sorption study
For sorption test, soil samples from the dystrophic Red-Yellow Argisol were collected in an area of native vegetation within the study area at the depths of 0-10 and 30-40 cm. For the dystrophic Melanic Gleisol, samplings were also taken from the same depths in a non-cultivated area. Sampling was done in triplicate.
Sorption tests
Soil samples were air dried and sieved through 2 mm mesh. Sub-samples were obtained in triplicate in order to determine sorption isotherms.
Isotherms were obtained by adding 20 mL of 0.01 mol L-1 CaCl
2 aqueous solution to 25 mL centrifuge tubes.
From Gesparim 500 atrazine aqueous solution (500 g L-1
a.i.), test solutions in concentrations of 0.125, 0.25, 0.5, 1, 2.5, and 5 mg L-1 wereprepared, corresponding to 0.58,
1.16, 2.32, 4.64; 11.6; 23.2 mol L-1 .
Th e tubes wer e agitated for 24 hour s in a reciprocating shaker in order to allow sorption equilibrium. They were then centrifuged at 500 g for 20 minutes. The supernatant was filtered through a 0.22 m PTFE membrane and the quantity of atrazine was quantified by high performance liquid chromatography (HPLC). Quantification used external standardization, constructing an analytical curve with 99.5% pure atrazine analytical standard provided by Syngenta.
The following equation was used to calculate atrazine sorbed concentration (1):
x/m (mg Kg-1) = (Ci – Ce) * v/m (1)
where Ci and Ce are initial and equilibrium atrazine concentration (mg L-1), respectively; v is the volume of the
atrazine solution in liters (L), and m is soil mass in kilograms (Kg).
Experimental data obtained for Atrazine sorption process in different depths and treatments were expressed in the form of x/m sorption isotherms (mol Kg-1) versus
Ce (mol L-1). These data were adjusted using Freundlich
isotherm (2):
x/m = Kf * Cs1/n (2)
This equation is normally employed in the process of sorption of organic molecules by solid matrices. To obtain Freundlich parameters, equations were linearized as in equation (3):
log x/m = log Kf + 1/n log Ce (3) obtaining the angular coefficient (l/n) and the linear coefficient (log Kf).
When the angular coefficient (l/n) was near 1.0 (0.9 < 1/n > 1.1), the Kf value represented the partition coefficient of the product between solid and liquid phases (Kd), as in equation (4):
Kd = (mol Kg-1) / (mol L-1) (4)
HPLC perating conditions
For quantitative atrazine determination, an HP 1100 series high performance liquid chromatography system (HPLC) was used, with the diode arrangement detector (DAD), selecting 222 nm as the wavelength. A 5 µm 150 x 3.2 mm Waters Spherisorb ODS-2 column was employed. Methanol/ milli-Q water in the 60:40 (V: V) ratio was utilized as the mobile phase, with 0.4 mL min-1 flow and 20 µL injection. In these
conditions, atrazine retention time was 6.71 minutes.
Sample collection and preparation for atrazine herbicide residue analysis
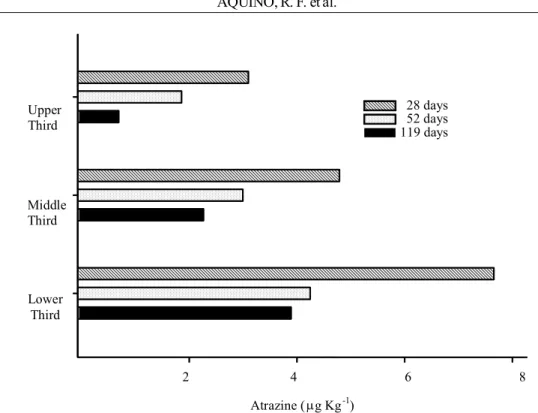
The slope area, corresponding to the dystrophic Red-Yellow Argisol, was divided into three sub-areas: the
upper third (A), middle third (B), and lower third (C) of the hillslope (Figure 2).
For each sub-area at the slope, four samples, at the depths of 0-10 and 30-40 cm, were taken for soil characterization. Atrazine was applied to this soil on November 20th 2007 and soil samples were taken 28, 52,
and 119 days after application.
The floodplain was also divided into three subareas and four samples of soil and water were taken for each subarea to form representative composite samples at 0-10, 20-30, 40-50, and 60-70 cm depths. In this area, atrazine was applied on October 16th 2007 and
samples were taken 30, 62, 87, and 154 days after herbicide application.
Upper Third; Middle Third; Lower Third; Floodplain; Approximate Scale.
Figure 1 – Aerial view of maize crop in Três Corações, MG, Brazil.
Approximately 2 Kg of each soil, from both areas, and 200 mL of water from the aquifer in the floodplain were collected and stored in a cold chamber at 4 °C for later analysis.
Analysis of atrazine residue in the soil samples
The soil samples were air dried (in a light shelter) and ground to obtain soil samples with particles and aggregates smaller than 2 mm and 25 g was weighed and added 100 mL of HPLC-grade methanol. This mixture was agitated for 4 hours at 70 rpm in an orbital shaker and left to settle in a light shelter for 12 hours. The maximum volume of the supernatant was taken and its value was kept for later calculation of herbicide concentration. These extractions were carried out in triplicate.
The supernatant was evaporated (at 40 °C) and the residues were dissolved in 0.3 mL of PA acetone for purification on thin layer chromatography plates (TLC). The acetone was transferred to the plate using a Pasteur pipette and the volumetric flask was washed twice more with 0.3 mL acetone.
Chloroform, acetone, and acetic acid were used as a mobile phase in the ratio of (90:9:1) and deposited in a TLC appropriate container. Elution time was 50 minutes and retention factor (Rf) was equal to 0.67. The 10 x 20 cm plates were prepared using Merck 60GF254 silica gel in a 0.5 mm thick layer. The atrazine position on the plate was identified using reference points on the sides of the plate with atrazine solution concentrated enough to show up as dark spots in 254 nm UV light. The range corresponding to atrazine was scraped and transferred to Whatman Number 2 filters, in such a way that the reference side points didn’t contaminate the samples. Atrazine in silica was eluted with 15 mL acetone, evaporated and dissolved in 1.0 mL mobile phase; acetonitrile and milli-Q water, 40:60 (V:V). The mobile phase used in the atrazine herbicide residue samples was different from that used in the sorption tests.
To evaluate the recovered atrazine percentage by the soil extraction method, two samples (6% organic matter) were spiked with 1.0 mg L-1 atrazine herbicide and another
sample was used as a control. Atrazine was extracted by the process described above and the recovery value was 91.5 ± 3.2%.
Analysis of atrazine herbicide residue in soil samples
The four 200 mL water samples from the aquifer were homogenized to form an 800 mL sample. Aliquots of 180 mL were taken from the composite sample (three aliquots per sample) and 22.5 mL of HPLC grade dichloromethane was added in a separation funnel. The
set was agitated with 50 vertical rotation movements at a 90-degr ee an gle. After ph ase separation , th e dichoromethane was transferred to a 250 mL volumetric flask of a rotator evaporator. This procedure was repeated five times for each aliquot.
The dichoromethane was filtered (0.22 µm), completely evaporated and washed with 1.0 mL of mobile phase (60% water and 40% acetonitrile, V: V) used in liquid chromatography (HPLC).
To evaluate the percentage of atrazine recovered by the water extraction method, four distilled water samples were spiked with 1.0 µg L-1 atrazine herbicide and another
sample was used as a control. Atrazine was extracted by the process described and its recovery was 101.5 ± 4.7%.
Analysis by high performance liquid chromotography, HPLC
Atrazine was quantified by an HP 1100 series high performance liquid chromatography system, HPLC, utilizing a diode arrangement detector operating at 222 nm, and a 150 x 3.2 mm 5 µm Waters Spherisorb ODS-2 column. The mobile phase wasmade up of milli-Q water and acetonitrile 60:40 (V: V), with a 0.4 mL min-1 flow and 100 µL injection. In these
conditions, atrazine retention time was 9.52 minutes. In these conditions, the detection limits were 4 µg L-1 and 2 µg L-1,respectively, for soil and water for the
chromatography, and 0.16 µg kg-1 and 0.01 µg L-1
considering the whole preparation and analysis processes.
Physical and chemical characterization of soils
Particle size distribution was measured by the pipette method (DAY, 1965). Water pH, cations of sorption complexes, available phosphorus, and total organic carbon were determined (EMPRESA BRASILEIRA DE PESQUISA AGROPECUÁRIA-EMBRAPA, 1997) in the soil samples before and after preparation and treatment.
RESULTS AND DISCUSSION
Sorption isotherms
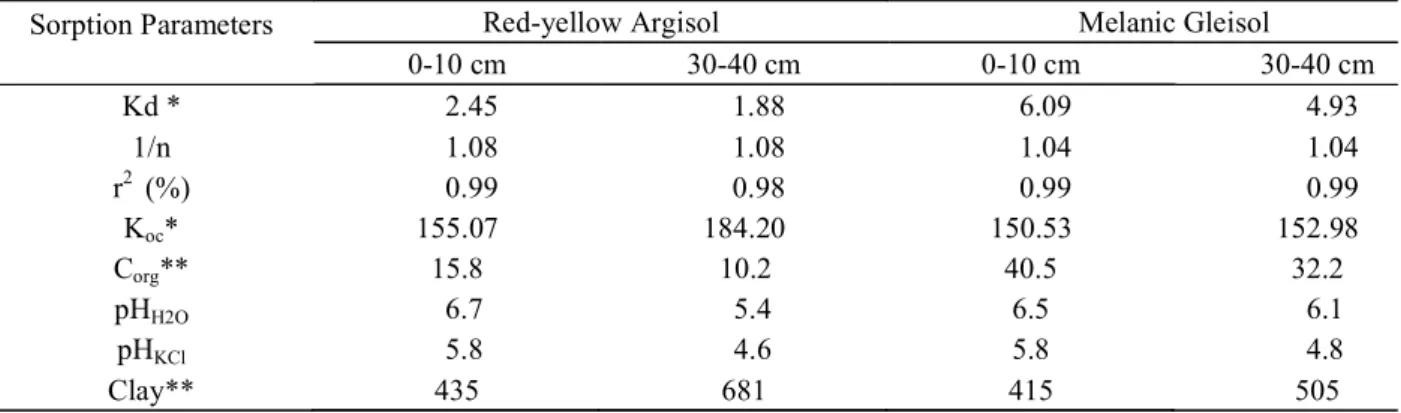
Sorption isotherms and the parameters derived from the Freundlich model for atrazine sorption in dystrophic TB melanic Gleisol and dystrophic Red-Yellow Argisol, at two depths, are shown on table 1. There was a linear relationship between solution equilibrium concentration and the quantity of the product sorbed. Adjustment to the linear equation produced values of R2 0.98 and 1.04 1/n 1.08. This
The Kd values for the studied soils and depths varied between 1.88 and 6.09 L kg-1, meaning that of the
initial quantity of atrazine added to the suspension, 14 to 35% remained in the liquid phase to be degraded and/or be leached down in the soil. When normalized for organic carbon content (Koc), the values ranged from 150.53 to 184.20 L kg-1. Kd values for the Gleisol were higher than
those for Argisol, with Koc values practically identical for both soils, except at 30-40 cm depth for Argisol. In this case, a Bt horizon, the higher amount of clay (681 g kg-1) as
compared to A horizon (0-10 cm depth) could also contribute to the sorption of atrazine.
The Kd values found here agree with those found in literature (ARANTES et al., 2006; BARRIUSO et al., 1992; CORREIA et al., 2007; GOMES; DICK; SOUZA, 2002; DICK et al., 2010; HUANG et al., 2012), which are around 1.34 to 5.96 L Kg-1.
Dick et al. (2010) found higher Kd (4.30 L kg-1) to an
Planosol than a Argisol (Kd = 3.56 L kg-1) due the higher
amounts of organic matter. However, the authors also found that the Planosol pedogenic environment affected the humification and therefore the retaining of atrazine was disfavored by a lesser decomposition degree of organic matter, resulting in Koc of 238 L kg-1 to Planosol and K
oc of
200 L kg-1 to Argisol. Hence, the near values of K oc for the
Gleisol and Argisol, may be atribuited bay the pedogenic environment of Gleisol, as discussed for the Planosol studied by Dick et al. (2010).
Atrazine residue in the slope area
The amount of atrazine found on the slope area, at the 0-10 and 30-40 cm depths, indicated the presence of
th e herbicide in 66.6% of the samples. At these contaminated samples, 75% are at the 0-10 cm depth and 25% are at the 30-40 cm depth.
As the herbicide was applied uniformly over the whole slope area, the higher amount of atrazine at the lower third and smaller at the upper third of the hillslope show that erosion moved atrazine towards the lower part of the landscape. As soil is eroded, sediments tend to accumulate in lower areas, which are the lower third of the hillslope and the floodplain.
Figure 3 shows that atrazine concentration on the lower third of the slope, for the 0-10 cm depth, in the three sampling periods was greater; being lower for the upper third. In this case, it is also important to consider that the study area has been planted with maize during the last eleven years and atrazine has been applied every year; atrazine’s half life in soil can vary between 1.5 months and 5 years (TRAGHETTA et al., 1996); therefore the effect is cumulative in this area, that is, the concentration found on the lower third could also be influenced by earlier applications, since this herbicide is considerably persistent in soils.
Loss of atrazine from soil by surface runoff could be intensified on steeper hillslopes, especially when there aren’t adequate conservation management in the area. In the study area, since a no-tillage system is being used, which consequently minimizes erosion and transport of sediments, atrazine is being transported by overland flow, even though it has little sediment. Conservation practices that promote water infiltration on hillslopes avoid the product from reaching the floodplain area and water sources in low-lying areas.
Table 1 – Atrazine sorption parameters, pH values, and total organic carbon obtained for a dystrophic red-yellow Argisol and a dystrophic Melanic TB Gleisol at two depths.
*(L kg-1); ** (g kg-1).
Sorption Parameters Red-yellow Argisol Melanic Gleisol
0-10 cm 30-40 cm 0-10 cm 30-40 cm
Kd * 2.45 1.88 6.09 4.93
1/n 1.08 1.08 1.04 1.04
r2 (%) 0.99 0.98 0.99 0.99
Koc* 155.07 184.20 150.53 152.98
Corg** 15.8 10.2 40.5 32.2
pHH2O 6.7 5.4 6.5 6.1
pHKCl 5.8 4.6 5.8 4.8
Atrazine was found in sediments across a riparian zone located in an area of silviculture (DREVENKAR et al., 2004). The authors concluded that the length of the slope an d veg et a bl e cover a r e im p or ta n t for con tamination of th is er osion sedimen t by th is herbicide.
Pinho et al. (2004) show that presence of atrazine in th e water of over lan d flow isn ’t con stan t, but contamination peaks coincide with the first rains after herbicide is applied to the soil. To summarize, atrazine contamination level in this case depends on chemical, physical, and biological properties of herbicide, type and location of soil on the landscape, tillage practices, frequency of use of the herbicide and occurrence of rain after application (GERECKE et al., 2002).
Atrazine herbicide residue in the floodplain area
The amount of atrazine in the soil profile of the floodplain area and the aquifer are presented on figure 4. Atrazine was found in all of the soil samples 154 days after herbicide application. From the first sampling, and 30 days
after application, the herbicide was detected in all the sampled soil depths.
In the first two samplings, the water table was at 70 cm, during the two last ones it was at 50 cm. Average herbicide concentration found in the water from the aquifer varied between 0.04 and 0.14 µg L-1.
From the first sampling time to the last one in the floodplain area, there was a decrease in in the soil and an increase in the water of the water table; therefore, leaching was an important transportation process of atrazine in the floodplain area.
Quantities of atrazine found in the soil after its application is related to the soil’s sorption potential for the surface and subsurface samples, as can be seen on table 1. The main sorption sites are in the organic matter in the soil for basic herbicides such as atrazine, an uncharged organic compound.
In the USA and Europe, atrazine has been found at levels far above what is permitted in water of the aquifer (3.0 µg L-1 EUA and 0.5 µg L-1 Europe); in Germany, its use
has been prohibited since 1991 due to the high levels found in water (Vivian et al., 2007).
Atrazine (g Kg-1)
6 4
2 8
Middle Third
119 days 52 days 28 days
Lower Third Upper Third
CONCLUSIONS
Amount of organic matter in the soils was shown to be fundamental in retention, dissipation, and leaching of atrazine herbicide, especially on the floodplain.
On the hillslope, atrazine was transported by overland flow, showing the need for conservation practices, such as terraces, to increase water infiltration into the soil. Greater sorption in Gleisol reduced the possibility of leaching, although leaching was the main form of transport to the aquifer of the flooplain; concentrations found in the water table are smaller than the limit allowed by the Ministry of Health of Brazil (2.0 µg L-1).
In general, frequency of atrazine application and location in the landscape has been shown to define this herbicide’s contamination process.
ACKNOWLEDGEMENTS
The authors show their appreciation to FAPEMIG and CNPq, for the financial support to this research.
REFERENCES
ARANTES, S.A.C.M. et al. Sorção da atrazina em solos representativos da sub-bacia do Rio das Mortes, MG.
Pesticidas: Revista de Ecotoxicologia e Meio Ambiente, Curitiba, v.16, n.0, p.101-110, 2006.
ARMAS, E.D. et al. Uso de agrotóxicos em cana-de-açúcar na bacia do Rio Corumbataí e o risco de poluição hídrica. Química Nova, São Paulo, v.28, n.6, p.975-982, 2005.
BARRIUSO, E. et al. Sorption of atrazine, terbutryn and 2,4-D herbicides in two Brazilian Oxisols. Geoderma, Amsterdam,v.53, n.2, p.155-167, 1992.
CORREIA, F.V. et al. Atrazine sorption and fate in a Ultisol from humid tropical Brazil. Chemosphere, Oxford, v.67, n.5, p.847-854, 2007.
DAY, P.R. Particle fractionation and particle-size analysis.
American Society of Agronomy, Madison, v.1, n.1, p.545-567, 1965.
DELPHIN, J.E.; CHAPOT, J.Y. Leaching of atrazine, metolachlor and diuron in the field in relation to their injection depth into a silt loam soil. Chemosphere, Oxford, v.64, n.11, p.62-1869, 2006.
DREVENKAR, V. et al. Levels of atrazine and simazine in waters in the rural and urban areas of North-West Croatia.
International Journal Environmental Analytical Chemical, New York, v.84, n.3, p.207-216, 2004.
EMPRESA BRASILEIRA DE PESQUISA AGROPECUÁRIA - EMBRAPA. Centro Nacional de Pesquisa dos Solos (Rio de Janeiro, RJ). Manual de métodos de análise de solo. 2.ed. Rio de Janeiro, 1997, 212p.
GERECKE, A. C. et al. Sources of pesticides in surface waters in Switzerland: pesticide load through waste water treatment plants––current situation and reduction potential. Chemosphere, Oxford, v.48, n.3, p.307-315, 2002.
GOMES, J.; DICK, D.P.; SOUZA, R.F. Sorção de atrazina em Cambissolo Húmico do Rio Grande do Sul sob vegetação nativa. Revista Brasileira de Ciência do Solo, Viçosa, v.26, n.2, p.521-528, 2002.
HUANG, Y. et al. Quantifying effects of primary parameters on adsorption–desorption of atrazine in soils. Journal of Soil and Sediments, Heidelberg, v.13, n.1, 82-93, 2012.
LAABS, V. et al. Pesticide fate in tropical wetlands of Brazil: An aquatic microcosm study under semi-field conditions.
Chemosphere, Oxford, v.67, n.5, p.975-989, 2007. LAVORENTI, A.; PRATA, F.; REGITANO, J.B.
Comportamento de pesticidas em solos: fundamentos. In:
Tópicos em Ciência do Solo. 2003, Viçosa, v.3, p.291-334. PINHO, A.P. et al. Retenção de atrazina, picloram e caulinita em zona ripária localizada em área de silvicultura. Engenharia na Agricultura, Viçosa, v.12, n.4, p.260-270, 2004.
SHERCHAN, S.P.; BACHOON, D.S. The presence of atrazine and atrazine-degrading bacteria in the residential, cattle farming, forested and golf course regions of Lake Oconee. Journal of Applied Microbiology, Oxford, v.111, n.2, p.293–299, 2011.
SICZEK, A. et al. Macro-porosity and leaching of atrazine in tilled and orchard loamy soils. Chemosphere, Oxford, v.70, n.11, p.1973-1978, 2008.
TRAGHETTA, D.A. et al. Embrapa – Comunicado Técnico. São Carlos, SP, 1996, 14, 1, 7p.
VIVIAN, R. et al. Adsorção e dessorção de trifloxysulfuron-sodium e ametryn em solos