Performance indices for pumping stations in irrigated rice fields
Índices de desempenho para estações de bombeamento em lavouras de arroz irrigado
Luciana Marini KöppI Marcia Xavier PeiterII Adroaldo Dias RobainaII Leonita Beatriz GirardiIII ISSN 1678-4596
ABSTRACT
Performance indices can be used as indices of energy use in irrigation systems. Pumping stations (PSs) are elements
that require energy for irrigation of rice fields by conventional flood irrigation. Interplay of physical, hydraulic, and electrical
parameters generates indices that determine the performance in
the diagnosis of PSs, operation, and projects for new sets. In this study, it was proposed and classified performance indices for PSs in rice fields, focusing on the efficient use of energy. The study was carried out through an investigation of 160 PSs in operation, located at the western border of Rio Grande do Sul, Brazil, which constituted an actual field situation. Next, PSs were optimized in relation to the selection of a piping system, using the lowest total cost, the choice of pump, and motors with better performance for the necessary situation as criteria. Results provided nine indices that classified the performance as “excellent”, “very good”, “good”, “poor”, and “very poor”, which allowed the assessment of projects and the diagnosis of PSs.
Key words: energy efficiency, irrigation flooding, pumping systems, irrigation performance.
RESUMO
Índices de desempenho podem ser usados como indicadores do uso da energia em sistemas de irrigação. Estações
de bombeamento (EB) são os elementos que demandam energia no processo de irrigação de lavouras de arroz irrigado por inundação convencional. A associação de grandezas físicas, hidráulicas e elétricas geram índices que determinam o desempenho auxiliando no diagnóstico de EB, tanto em funcionamento, quanto em projetos de novos conjuntos. Este trabalhoteve como objetivo propor e classificar índices de desempenho para EB de lavouras de arroz, com
foco no uso eficiente da energia.O trabalho foi conduzido a partir do levantamento de dados de 160 EB em funcionamento, localizadas na fronteira oeste do Rio Grande do Sul, que caracterizou a situação real de campo. Posteriormente, as EB foram otimizadas em relação
à seleção de tubulação- usando como critério o menor custo total e escolha da bomba e motor de melhor rendimento para a necessidade
de projeto. Os resultados apresentam nove índices e propõem categorias que classificam o desempenho em “excelente”, “muito bom”, “bom”, “ruim” e “muito ruim”, permitindo a avaliação de projetos e o diagnóstico de EB.
Palavras-chave: eficiência energética, irrigação, inundação, sistemas de bombeamento, desempenho irrigação.
INTRODUCTION
The particular characteristics of pumping
stations (PSs) in rice fields associated with the
expanse of irrigated areas in Rio Grande do Sul
(RS) when compared to other parts of Brazil, and the quantity of water and energy used in this process justify studies to optimize the use of these resources.
Performance indices in irrigation areas are used
to identify optimal sizing guidelines. ALEGRE et al. (2004) conceptualized a performance index
as a quantitative measure of a particular aspect of performance of the managing entity or its service level. Thus, each index is a tool for monitoring
efficiency (it measures the extent to which resources
IDepartamento de Engenharia Rural (DER), Faculdade de Agronomia “Eliseu Maciel” (FAEM), Universidade Federal de Pelotas (UFPEL),
96010-610, Pelotas, RS, Brasil. E-mail: [email protected]. Corresponding author.
IIDepartamento de Engenharia Rural (DER), Centro de Ciências Rurais (CCR), Universidade Federal de Santa Maria (UFSM), Santa
Maria, RS, Brasil.
IIIPrograma de Pós-graduação em Engenharia Agrícola (PPGEA), Centro de Ciências Rurais (CCR), Universidade Federal de Santa Maria
(UFSM), Santa Maria, RS, Brasil.
are optimally used for production) and effectiveness
(it measures the extent to which management goals are met). DANTAS NETO & FARIAS (2013) ranked
performance indices by their relevance, selectivity,
simplicity, low cost, comprehensiveness, stability, traceability, and reasonability. ROCAMORA et al. (2013) identified performance indices as tools for
monitoring the quality of PSs.
OCACIA et al. (2002) studied PSs at rice fields on the western border of RS and established
an index that relates the potential of a crop area and
pumping height, and concluded that the most efficient PS should have a power consumption value of less
than 30W ha-1 m-1. However, values observed in the
aforementioned study varied from 25Wha-1 m-1 to
more than 100W ha-1 m-1. CÓRCOLES et al. (2010)
proposed the power used by a pumping volume
unit (kW m-3) and active energy consumed (kWh)
as indices. This method was also used by DANTAS NETO & FARIAS (2013), who suggested the use of indices that associate energy and power, as measured
in the area covered by irrigation units and by the
volume of pumped water (kWh ha-1, kWh m-3, kW
ha-1, kW m-3). The overall PS efficiency can serve
as a performance index because it is determined by
the parameters involved in the process (flow rate, geometric height, energy loss, and power demand). ABADIA et al. (2008) proposed a coefficient of global energy efficiency (GEE) that has two components: the efficiency of the equipment of a PS, and its spatial distribution, considering the water
supplying distance, geometric height difference, and irrigation area. The current proposal aims to identify
whether the cause of low efficiency is related to the
equipment or its spatial distribution. The developed
coefficient classifies PSs into categories (excellent,
good, normal, acceptable, or unacceptable). The
International Water Association (IWA) proposed a
performance index associating the consumption of
energy per unit volume of water pumped with a gauge height of 100m. This index is known as normalized
energy consumption (kWh m-3(100m)-1); allowing
the comparison of PS performance at different
heights (ALEGRE et al., 2004). The same authors proposed the use of normalized energy consumption
to evaluate public supply systems, and recommended
an approximate value of 0.5kWh m-3for every 100m
of gauge height.
The lack of reference values that could be used as decision-making criteria, considering the case of energy efficiency of one PS in a rice fields creates insecurity regarding the exchange, replacement or modification of items that make up
the electromechanical system of water elevation in operation. The high investment values associated with special pricing tariff structures for irrigation (with
reduced costs) do not encourage alterations necessary
for optimizing a PS process. It is estimated that the installed power in rice fields in RS is approximately 500MW. Therefore, a lack of reference performance indices does not allow identification of the conditions of PSs in terms of efficient energy use. Considering this drawback, the goal of this research is to propose and classify performance indices (Pis) for water PSs used in the irrigation of rice fields; the developed method will allow the identification of sizing patterns to increase energy efficiency.
MATERIALS AND METhODS
The area of study included four
municipalities on the western border of the state of RS. Total sample set included 45 properties with 160 PSs, of which 48 were located in Uruguaiana, 60 in Itaqui, 47 in Alegrete, and 5 in São Borja. Names of farmers were provided by the region’s electric distribution company (AES SUL), which used as inclusion criteria the farmers’ interest in participating in the Energy Efficiency Program (Programa de Eficientização Energética), developed by a company under the supervision of the National Electrical Energy Agency (Agencia Nacional de Energia Elétrica, ANEL).
Overall, the selected fields used flood irrigation with a water layer varying between 3 and 7cm, low wall systems, and an irrigation cycle between 80 and 100 days. PSs were triggered by electrical energy by using a tariff system, Horo-Sazonal green,
and by adopting a restricted ordinance schedule.
Collection of field data included: a)
Measurement of the geometric pumping height, suction of PS, and the respective piping lengths for total topographic station. b) Measurement of the
flow rate by using a portable ultrasonic transit time flow meter. c) Measurement of electrical quantities: active power, voltage, and current, measured
using a multimeter installed next to the electrical
control board, with reading periods between 15 and 30min. d) Verification of the model and brand of
the pump and motor, positioning of the pump and
motor (horizontal or vertical axis), use of a floating structure, type of electric starter key, and piping
material and its diameter.
Total gauge height of the PS analyzed was estimated from equation 1, which was adapted from the Hazen-William equation, and the hydraulic power
(1)
(2)
where TDH is the total dynamic head (m), hg is the
geometric height (m); Q is the measured flow rate (m³
s-1), C is the Hazen-Williams roughness coefficient
(here we adopt a value of 90), D is the pipe diameter (m), L is the length of the pipe (m), Lvirtual is the
equivalent virtual length of the parts of the system (m), Phyd is the hydraulic power (kW), andγ is the
specific weight of the water (N m-3).
The overall efficiency of the system was estimated using the relationship between the hydraulic electrical power and the active power by
using equation 3.
(3)
where Pactive is the active power (kW), andηglobal is
the overall efficiency of the combination of all the
pumping system equipment.
New projects were then developed based on the real data obtained in the field, aiming the reduction of energy use in the pumping water system. Physical conditions of the PS were not altered. Irrigation area, flow rate, geometric heights, and distances (piping length) were maintained. Piping diameter was adjusted
to obtain the best option among standard options
made of welded steel sheet. Criterion for selecting a suitable diameter was the least total cost over a period of 10 years of PS operation, based on the sum of fixed costs (piping) and operating costs (energy). After determining the optimal diameter, the TDH was
re-estimated using equation 1. The average PS operating time, obtained from energy bills made available by
the farmers, was standardized at 1,800h to allow
comparisons of consumption rates.
Using the calculated TDH and the established flow rate of the project, the pump with the highest efficiency was selected for each of the 160 cases analyzed, among 68 preselected models (which are available for purchase). The motor was then selected using the required power as a criterion; high efficiency four-pole motors were selected. Thus, an optimized PS was obtained for the required pumping conditions, resulting in minimized energy consumption.
Nine performance indices were applied to
the 160 PSs studied for the initial conditions (before)
and for conditions in which the sets had been optimized
through the substitution of piping, pumps, and motors adjusted for the recommended technical situation
(after). The performance indices used are described in equations 4 to 11.
(4)
(5)
(6)
(7)
(8)
(9)
(10)
(11)
where PiO is a performance index (W ha-1m-1), Pactive is
the active power (kW), A is the planted area supplied by
the PS (ha), hg is the geometric pumping height (m), Pi1
is a performance index (kW ha-1), Pi
2 is a performance
index (kWh ha-1), ∆t is the duration of pumping (h), Pi
3
is a performance index (kWh m³), Vol is the volume of
water pumped during the entire irrigation cycle, Pi4 is a
performance index (kW (m³ s-1)-1m-1), Q is the flow rate (m³
s-1), TDH is the total dynamic head (m), Pi
5 is a performance
index (kW (m³ s-1)-1 m-1), P
nominal is the nominal power of the
motor (kW), Pi6 is a performance index (W ha
-1m-1), and Pi 7
is a performance index (kWh m-3(100m)-1).
The indices defined above relate hydraulic, physical, and electrical parameters, thus allowing to
identify the operational performance patterns of PSs.
Categories of performance were proposed for each index
studied, based on the results obtained before and after
optimization of PSs (KÖPP, 2015). Categories were defined based on the amplitude of the values obtained, creating five equidistant classes, which are called “very poor”, “poor”, “good”, “very good”, and “excellent”.
The relationship between the indices and
the measures used for their determination (geometric
height, irrigation area, unit flow rate, gauge height, overall production, and load loss) were tested using linear
regression analysis.
RESULTS AND DISCUSSION
Results showed that optimization reduced
in their variability. The variability that remained after the process is due to factors affecting the indices and
those that were not altered, such as the unit flow rate (L
s-1 ha-1), geometric pumping height (m), piping length
(m), and efficiency of the selected pump (%),which was limited by options available in the market.
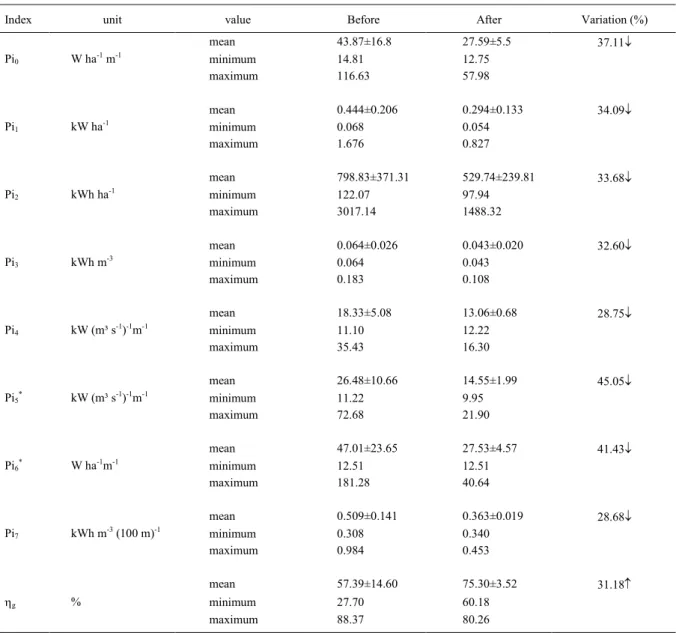
Comparing the Pi0 index “before” and
“after” (see Table 1), it was observed that its value
was adjusted by the process to less than 30W ha-1
m-1, as indicated by OCACIA et al. (2002) as the
threshold for obtaining good performance. Regarding
the Pi1 index, even the mean corresponding to the
“before” condition (see Table 1) was lower than the value found by MARCOLIN & ROBAINA (2002) of
0.684kW ha-1 in 31 PSs in the central region of RS.
Pi2 and Pi3 indices, representing the
consumption of PSs, with means of 798.83kWh ha-1
and 0.064kWh m-3 respectively, differed from the
values obtained in other regions for different irrigation
systems, such as those reported in MORENO et
al. (2010) (2,792kWh ha-1 and 0.872kWh m-3),
URRESTARAZU & BURT (2012) (0.16kWh m-3),
Table 1 - Mean values, standard deviations, minimum and maximum performance indices assessed in real operating conditions (before),
and estimated for optimized configurations by the adaptation of piping, pumps, and motors (after) for the 160 pumping stations
evaluated in the study in irrigated rice fields in RS.
Index unit value Before After Variation (%)
mean 43.87±16.8 27.59±5.5 37.11↓
minimum 14.81 12.75
Pi0 W ha-1 m-1
maximum 116.63 57.98
mean 0.444±0.206 0.294±0.133 34.09↓
minimum 0.068 0.054
Pi1 kW ha-1
maximum 1.676 0.827
mean 798.83±371.31 529.74±239.81 33.68↓
minimum 122.07 97.94
Pi2 kWh ha-1
maximum 3017.14 1488.32
mean 0.064±0.026 0.043±0.020 32.60↓
minimum 0.064 0.043
Pi3 kWh m-3
maximum 0.183 0.108
mean 18.33±5.08 13.06±0.68 28.75↓
minimum 11.10 12.22
Pi4 kW (m³ s-1)-1m-1
maximum 35.43 16.30
mean 26.48±10.66 14.55±1.99 45.05↓
minimum 11.22 9.95
Pi5* kW (m³ s-1)-1m-1
maximum 72.68 21.90
mean 47.01±23.65 27.53±4.57 41.43↓
minimum 12.51 12.51
Pi6* W ha-1m-1
maximum 181.28 40.64
mean 0.509±0.141 0.363±0.019 28.68↓
minimum 0.308 0.340
Pi7 kWh m-3 (100 m)-1
maximum 0.984 0.453
mean 57.39±14.60 75.30±3.52 31.18↑
minimum 27.70 60.18
ηg %
maximum 88.37 80.26
SOUZA et al. (2001) (0.3kWh m-3 and 378.33kWh
ha-1), and MEDEIROS et al. (2003) (0.47kWh m-3 and
4,401kWh ha-1). This result showed the great variability
of these indices, which makes difficult to compare different conditions. This variability is associated with
geometric heights typical of the area, the irrigation
system used, and the type and size of pumps.
Although Pi4 and Pi5 indices are expressed in
the same units of measurement, they represent different measures. Pi4 refers to the active power, whereas Pi5
indicates the nominal power of the motor. It follows
that service factors smaller than one unit could lead to a higher Pi5value than that obtained for active power.
However, the determination of Pi5 is facilitated by the use
of a power value indicated on the motor plate (motor’s nominal power). Similarly, the height reference, used for
deriving both indices, is different because Pi4 refers to the gauge height and Id5 refers to the geometric height,
what is easy to obtain.
The Pi6 index was proposed because of the
ease with which data requiring the nominal power
of the motor, irrigated area, and geometric pumping
height were obtained. This index and Pi5 were
the indices with the greatest percentage variation between “before” and “after” (Table 1), according to the adjustment of nominal power that was carried out in relation to the active power.
The mean value for index Pi7 obtained
after optimization was 0.363kWh m-3(100 m)-1, which
differed from that proposed by ALEGRE et al. (2004), who recommended a value of approximately 0.5kWh
m-3 (100 m)-1. The value obtained is due to the shorter
piping lengths, when compared to those used in public supply services, on which the author’s recommendations are based. This index shows a strong correlation with
Pi4, although Pi4t differs in the measures used for its
determination. Hence, both indices were retained, in
spite of their similarities (Pi4=Pi7× 36).
The initial mean overall efficiency (before) was 57%, a value that was slightly higher than that observed by ARNS (1995) (45%), OCACIA et al. (2002) (47%), and MOISES (2009) (50%), caused by
the improvement of installations over time. Process
of optimization resulted in an increase of 31.2%, thus reaching an average of 75%, a value obtained based on the improved fit of the selected piping, choice of t proper
pump, and motor adjusted to the application. This value
differs from that obtained by ABADIA et al. (2008); their study classifies levels of global production higher than 50% as “excellent”. The variation reported between “before” and “after” shows the economic potential that
can be obtained by the adaptation of PSs.
The partial result obtained when the effect of piping substitution alone was studied in relation to active power (kW) showed a reduction of
10.19%, which led to the same reduction in energy consumption and costs. However, piping, pump, and motor replacement allowed an estimated reduction in active power consumption of 31.20%.
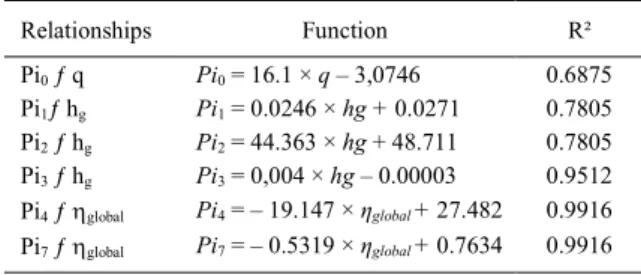
The indices analyzed are related to each
other and the measurements, as shown in table 2. The Pi0
index is related to the unit flow rate (q (L s-1 ha-1)), where
as Pi1, Pi2, and Pi3 indices are related to the geometric height. Pi4 and Pi7 indices, in contrast, are shown to be
strictly dependent on the efficiency of the equipment. The relationships that were considered significant are
presented in table 2.
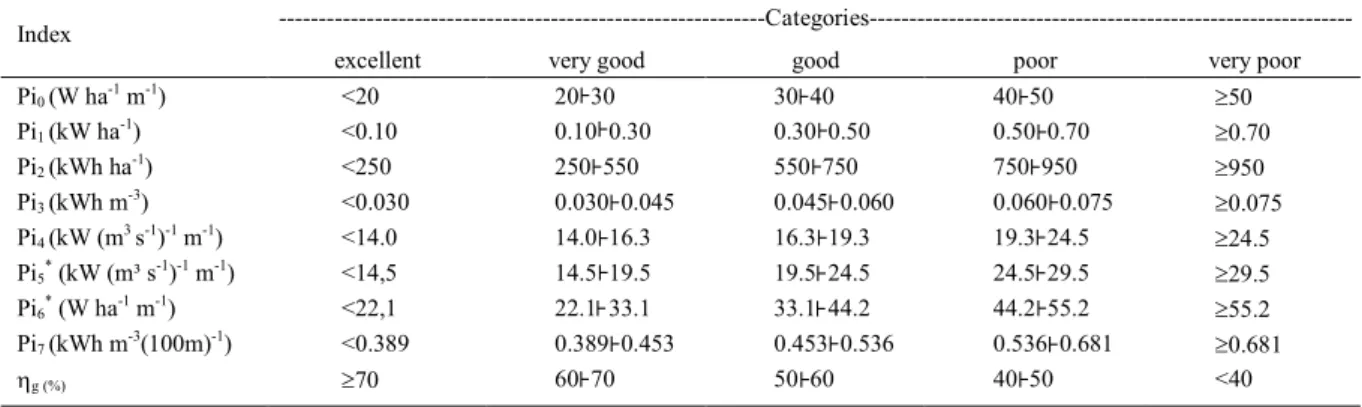
Table 3 shows the classification proposed
for the nine performance indices presented in this study, indicating the range of values corresponding
to“excellent”, “very good”, “good”, “poor”, and “very poor”. It was suggested the use of the following indices: overall efficiency (ηg), Pi4, and Pi7, in this
order, to verify the performance of projects; Pi1, Pi2, and Pi3, in this order, to verify whether the location’s topography is favorable for rice cultivation; Pi0,
when comparing stations and identifying the energy consumption due to excessive water use in the
irrigation process; and Pi5 and Pi6 indices, in case of
difficulties in measuring active power or performing a quick estimate.
CONCLUSION
The combination of physical, hydraulic,
and electrical parameters of PSs studied allowed the creation of indices that characterize performance in relation to energy consumption for water pumping in irrigated rice fields in RS. Using the overall cost minimization criterion, the choice of piping size, and more efficient pumps and motors resulted in a reduction of 31.20% in the energy consumption associated with the pumping process, relative to the configuration observed in the field for the 160 PSs studied.
Table 2 - Significant relationships between performance indices
and hydraulic, electrical, and physical measures used
in their determination for water pumping stations in
irrigated rice fields in RS.
Relationships Function R²
Pi0 ƒ q Pi0 = 16.1 × q – 3,0746 0.6875
Pi1ƒ hg Pi1 = 0.0246 × hg + 0.0271 0.7805
Pi2 ƒ hg Pi2 = 44.363 × hg + 48.711 0.7805
Pi3 ƒ hg Pi3 = 0,004 × hg – 0.00003 0.9512
Pi4 ƒ ηglobal Pi4 = – 19.147 × ηglobal + 27.482 0.9916
For reference values of size or PS
operation estimates, it was suggested the use of the
following index values to achieve an acceptable index
corresponding to a “good” rating: Pi0<40W ha
-1 m-1,
Pi1<0.50kW ha-1, Pi
2<750kWh ha
-1, Pi
3<0.060kWh
m-3, Pi
4<19.3kW (m
3 s-1)-1 m-1, Pi
5<24.5kW (m³
s-1)-1 m-1 (based on the nominal power of the motor),
Pi6<44.2W ha-1 m-1 (based on the nominal power
of the motor), Pi7<0.536kWh m-3 (100m)-1, and η g
(overall efficiency) >50%.
ACKNOWLEDGEMENTS
The authors wish to thank the Conselho Nacional de Desenvolvimento Científico e Tecnológico (CNPq), Coordenação e Aperfeiçoamento de Pessoal de Nível Superior (CAPES) and AES Sul
(electricity distribution company) by the opportunity obtaining data. REFERENCES
ABADIA, R. et al. Energy efficiency in irrigation distribution networks
I: theory. Biosystems Engineering, v.101, n.1, p.21-27, Sept. 2008. doi: 10.1016/j.biosystemseng.2008.05.013.
ARNS, R. Racionalização do uso de energia elétrica em bombeamentos de arrozais na Fronteira-Oeste do Rio Grande do Sul. Lavoura Arrozeira,
v.48, n.418, p.14-17, Jan./Fev. 1995.
ALEGRE, H. et al. Indicadores de desempenho para serviços de
abastecimento de água. Tradução e adaptação de Patricia Duarte, Helena
Alegre e Jaime Melo Baptista. Lisboa: IWA/ Lab. Nacional de Engenharia Civil/Inst. Regulador de águas e resíduos, 2004. 277p.
CÓRCOLES, J.I. et al. Management evaluation of Water Uses Associations using benchmarking techniques. Agriculture Water Management, v.98,
n.1, p.1-11, Dez. 2010. doi: 10.1016/j.agwat.2010.07.018.
DANTAS NETO, J.; FARIAS, M. S. S. Indicadores de desempenho como instrumento de gestão em projetos de irrigação. In: AGUIAR NETO, A. O.; BASTOS, E. A. (Orgs.). Princípios agronômicos da irrigação.
Brasília: EMBRAPA, 2013. p.219-262.
KÖPP, L. M. Índices de desempenho para estações de bombeamento em lavouras de arroz irrigado. 2015. 107f. Tese (Doutorado em
Engenharia Agrícola) - Curso de Pós-graduação em Engenharia Agrícola, Universidade Federal de Santa Maria, RS.
MARCOLIN, E.; ROBAINA, A.D. Consumo de energia e eficiência das estações de bombeamento de lavouras de arroz irrigado. Ciência Rural,
v.32, n.2, p.229-235, Apr, 2002.
MEDEIROS, S. de S. et al. Avaliação da eficiência do uso da energia elétrica no Perímetro Irrigado de Pirapora, MG. Revista Brasileira de Engenharia Agrícola e Ambiental, v.7, n.2, p.394-398, May/Aug, 2003.
doi: 10.1590/s1415-43662003000200035.
MOISES, N. D. Energia elétrica para a irrigação do arroz na área da CELETRO. 2009. 92f. Dissertação (Mestrado em Energia, Ambiente e Materiais) - Universidade Luterana do Brasil, Canoas, RS.
MORENO, M.A. et al. Energy analysis of pressurised irrigation delivery
systems: monitoring and evaluation of proposed measures for improving
energy efficiency. Irrigation Science, v.28, n.5, p.445-460, Fev. 2010.
doi: 10.1007/s00271-010-0206-8.
OCACIA, G.C. et al. Uso racional de energia em estações de bombeamento de água para irrigação de arroz. In: ENCONTRO DE ENERGIA NO MEIO RURAL, 4., 2002, Campinas, Proceedings on line... Available from: <http://www.proceedings.scielo.br/ scielo.php?script=sci_arttext&pid=MSC00000000220020002000 63&lng=en&nrm=abn>. Accessed: Jan. 12, 2015.
ROCAMORA, C. et al. Strategy for efficient energy management to solve energy problems in modernized irrigation: Analysis of the
Spanish case. Irrigation Science, v.31, p.1139-1158, Oct. 2013. doi:
10.1007/s00271-012-0394-5.
SOUZA, G.H.F. et al. Desempenho do Distrito de Irrigação Senador Nilo
Coelho. Revista Brasileira de Engenharia Agrícola e Ambiental, v.5,
n.2, p.204-209. May/Aug. 2001. doi: 101590/s1415-43662001000200005
URRESTARAZU, L.P.; BURT, C.M. Characterization of pumps for
irrigation in Central California: Potential energy savings. Journal of
Irrigation and Drainage Engineering - ASCE, v.138, n.9, p.815-822. Sept. 2012. Available from: <http//dx.doi.org/4774.0000463>. Acessed: Jan. 10, 2015. doi:
10.1061/(ASCE)IR.1943-4774.0000463.
Table 3 - Classification of performance indices for projects and analysis of water pumping stations for irrigated rice fields in RS.
---Categories---Index
excellent very good good poor very poor
Pi0 (W ha-1 m-1) <20 20 30 30 40 40 50 ≥50
Pi1 (kW ha-1) <0.10 0.10 0.30 0.30 0.50 0.50 0.70 ≥0.70
Pi2 (kWh ha-1) <250 250 550 550 750 750 950 ≥950
Pi3 (kWh m-3) <0.030 0.030 0.045 0.045 0.060 0.060 0.075 ≥0.075
Pi4 (kW (m3 s-1)-1 m-1) <14.0 14.0 16.3 16.3 19.3 19.3 24.5 ≥24.5
Pi5* (kW (m³ s-1)-1 m-1) <14,5 14.5 19.5 19.5 24.5 24.5 29.5 ≥29.5
Pi6* (W ha-1 m-1) <22,1 22.1 33.1 33.1 44.2 44.2 55.2 ≥55.2
Pi7 (kWh m-3(100m)-1) <0.389 0.389 0.453 0.453 0.536 0.536 0.681 ≥0.681
ηg (%) ≥70 60 70 50 60 40 50 <40
*based on the nominal power of the motor.