* Corresponding author:
E-mail: [email protected]
Received: July 23, 2015
Approved: October 28, 2015
How to cite: Duarte HHF, Souza ER. Soil Water Potentials and
Capsicum annuum L. under Salinity. Rev Bras Cienc Solo. 2016;v40:e0150220.
Copyright: This is an open-access article distributed under the terms of the Creative Commons Attribution License, which permits unrestricted use, distribution, and reproduction in any medium, provided that the original author and source are credited.
Soil Water Potentials and
Capsicum
annuum
L. under Salinity
Heitor Henrique Félix Duarte and Edivan Rodrigues de Souza*
Universidade Federal Rural de Pernambuco, Departamento de Agronomia, Recife, Pernambuco, Brasil.
ABSTRACT: Investigations into water potentials in the soil-plant system are of great relevance in environments with abiotic stresses, such as salinity and drought. An experiment was developed using bell pepper in a Neossolo Flúvico (Fluvent) irrigated with water of six levels of electrical conductivity (0, 1, 3, 5, 7 and 9 dS m-1) by using exclusively NaCl and by simulating the actual condition (using a mixture of salts). The treatments were arranged in a randomized block design, in a 6 × 2 factorial arrangement, with four replicates. Soil matric (Ψm) and osmotic (Ψo) potentials were determined 70 days after transplanting (DAT). Soil total potential was considered as the sum of Ψm and Ψo. Leaf water (obtained with the Scholander Chamber) and osmotic potentials were determined before sunrise (predawn) and at noon at 42 and 70 DAT. There were no significant differences between the salt sources used in the irrigation water for soil and plant water potentials. The supply of salts to the soil through irrigation water was the main factor responsible for the decrease in Ψo in the soil and in bell pepper leaves. The total potential of bell pepper at predawn reached values of -1.30 and -1.33 MPa at 42 and 70 DAT, respectively, when water of 9 dS m-1 was used in the irrigation. The total potential at noon reached -2.19 MPa. The soil subjected to the most saline treatment reached a water potential of -1.20 MPa at 70 DAT. There was no predawn equilibrium between the total water potentials of the soil and the plant, indicating that soil potential cannot be considered similar to that of the plant. The determination of the osmotic potential in the soil solution should not be neglected in saline soils, since it has strong influence on the calculation of the total potential.
Keywords: water relations, osmotic potential, bell pepper.
INTRODUCTION
The dynamics of total water potential is a key variable in environments with the occurrence of abiotic stresses, such as drought and salinity, since it determines water movement and availability in the soil-plant system (Hillel, 1998; Kirkham, 2004). The knowledge of matric and osmotic components in the soil (Groenevelt et al., 2004) and osmotic and total components in the plant (Souza et al., 2012) allows for understanding and interpreting different management conditions, such as areas irrigated with waters of different electrical conductivities and ionic concentrations. In addition, Ben-Gal et al. (2009) reported the use of osmotic potential to evaluate the effects of salinity on plants is much more appropriate than electrical conductivity, since it accounts for the influence of all the present ions, whether in the soil solution, irrigation water or in the plant cell.
Soil salinity affects an extensive area of the world and requires special attention, since it decreases agricultural cultivation and often makes it impossible (Souza et al., 2014). Salt-affected soils are characterized by the excess of soluble salts in the soil solution (salinity) or sodium in the exchange complex (sodicity) (Souza et al., 2012). In many agricultural areas, the use of water with high electrical conductivity for irrigation and the excessive application of fertilizers are the main reasons for the problem of the increase in soil salinity. Since salinity limits agricultural production and reduces crop yield to economic levels, knowledge of the effects of this stress on plant and soil becomes necessary. Thus, experiments evaluating different plant species and also water of different ionic compositions are important in this type of agricultural system. Furthermore, it is common to find in the literature the use of saline water prepared with only sodium chloride; however, a greater diversity of ions occurs under natural conditions. Therefore, studies comparing the influence of different ionic compositions of irrigation water on water potential in the soil-plant system are necessary (Melo et al., 2016)
The classic theory of water relations predicts an equilibrium between the soil water potential around the roots and the plant water potential during the night (Donovan et al., 1999). This equilibrium must be investigated under salinity conditions in the soil and in the plant, since the total water potential in the plant is often used as representative of soil water potential. However, the magnitude of the disequilibrium between soil and plant potentials must be quantified in order to refine the interpretations related to water dynamics in the soil-plant system (Donovan et al., 2003), especially under conditions of abiotic stress.
Bell pepper (Capsicum annuum L.) crop is among the ten vegetable crops of greatest economic importance in the Brazilian market (Amor and Cuadra-Crespo et al., 2012; Sediyama et al., 2014; Oliveira et al., 2015). The cultivation of bell pepper is one of the best examples of family agriculture and integration between small farmers and agro-industry; this crop is also cultivated in semiarid regions, which often use saline water for irrigation (Amor and Cuadra-Crespo et al., 2012).
This study investigated water potentials in the soil (matric, osmotic and total) and in bell pepper plants (osmotic and total) irrigated with water of six levels of electrical conductivity (0, 1, 3, 5, 7 and 9 dS m-1) prepared from two sources: a mixture of salts similar to that in the water from wells in the soil-sampling site and an exclusive source of NaCl. In addition, this study tested the hypotheses of predawn equilibrium between soil and plant total potentials and influence of salt type in the irrigation water on the potentials in the soil and in bell pepper plants.
MATERIALS AND METHODS
Soil collection and preparation for experiment installation
The soil material used in the experiment was collected in the layer of 0.00-0.30 m of a Neossolo Flúvico (Santos et al., 2013), a corresponding to Fluvent (Soil Survey Staff,
coordinates of 8° 34’ 17” and 8° 18’ 11” S, and 37° 1’ 20” W, with mean altitude of 613 m. The soil was air-dried, pounded to break up clods and sieved through a 4-mm grid, in order to maintain soil microaggregation and increase field representation.
Initial soil characterization
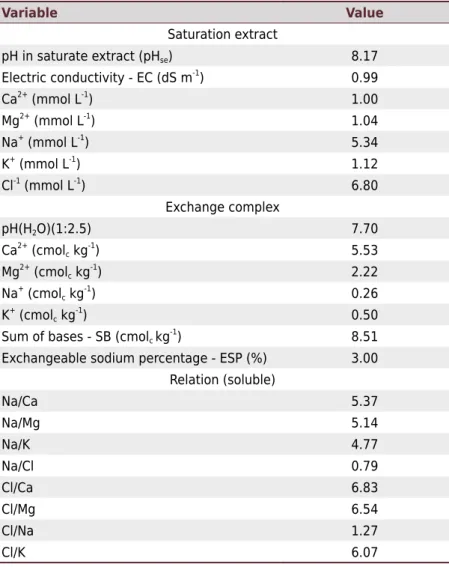
For soil chemical characterization (Table 1), the following properties were determined in the air-dried fine earth (ADFE): Ca2+, Mg2+, Na+ and K+, extracted using 1 mol L-1 ammonium acetate; the saturation extract was obtained through the preparation of the saturation paste (Richards, 1954), where electrical conductivity and pH in water (Claessen, 1997) were measured and soluble bases and the chloride ion were determined through titration with AgNO3. The cation exchange capacity (T) was determined through the index cation method (Richards, 1954). Based on the results obtained in the exchange complex, the values of sum of bases (SB) and exchangeable sodium percentage (ESP) were calculated.
For the physical characterization, granulometric analysis was performed in the ADFE using the pipette method; clay dispersed in water and the estimation of the degrees of clay dispersion and flocculation; soil bulk density, through the graduated cylinder method and soil particle through the volumetric flask method; water contents at field capacity (-0.1 atm) and permanent wilting point (-15 atm) were obtained from the soil water retention curve, determined using Richards’ pressure plate apparatus (Claessen, 1997). Total porosity was estimated using the values of soil bulk and
Table 1. Chemical characterization of the Neossolo Flúvico used to
fill the pots in the greenhouse experiment
Variable Value
Saturation extract
pH in saturate extract (pHse) 8.17
Electric conductivity - EC (dS m-1
) 0.99
Ca2+
(mmol L-1
) 1.00
Mg2+ (mmol L-1) 1.04
Na+
(mmol L-1
) 5.34
K+
(mmol L-1
) 1.12
Cl-1 (mmol L-1
) 6.80
Exchange complex
pH(H2O)(1:2.5) 7.70
Ca2+
(cmolc kg -1
) 5.53
Mg2+
(cmolc kg -1
) 2.22
Na+ (cmolc kg -1
) 0.26
K+
(cmolc kg -1
) 0.50
Sum of bases - SB (cmolc kg-1) 8.51
Exchangeable sodium percentage - ESP (%) 3.00 Relation (soluble)
Na/Ca 5.37
Na/Mg 5.14
Na/K 4.77
Na/Cl 0.79
Cl/Ca 6.83
Cl/Mg 6.54
Cl/Na 1.27
particle densities. The soil physical properties were: fine sand 312 g kg-1; coarse sand 117 g kg-1; total sand 429 g kg-1; silt 422 g kg-1; clay 149 g kg-1; clay dispersed in water 102 g kg-1; bulk density 1.24 Mg m-3; particle density 2.52 Mg m-3
; flocculation degree 31 %; dispersion degree 69 %; total porosity 50.79 %; field capacity 0.23 g g-1; and permanent wilting point 0.05 g g-1.
Experiment installation and definition of treatments
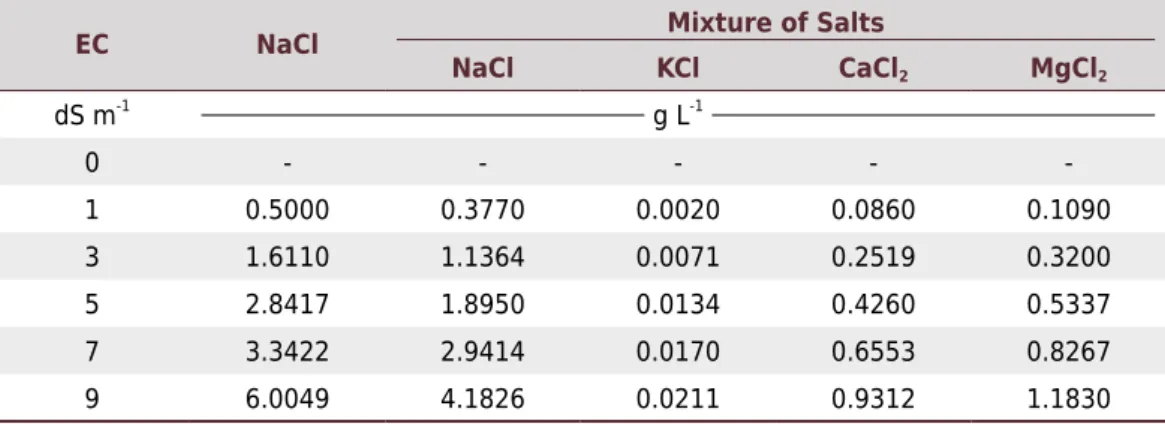
Bell pepper (Capsicum annuum L) variety ‘Itamara’ was cultivated in pots with a capacity for 6 dm3 of soil, which were irrigated daily, using water with electrical conductivity levels of 0, 1, 3, 5, 7 and 9 dS m-1 (Table 2). Two salt sources were evaluated: one composed of the mixture of Ca, Mg, Na, K and Cl, which simulated the composition of the water from a well close to the soil-sampling site, with the same proportions, and another source using exclusively sodium chloride.
The treatments were arranged in a randomized block design, with four replicates, in a 6 × 2 factorial arrangement, which consisted of six levels of electrical conductivity and two sources of salts.
Conduction
The seedlings were transplanted to pots 40 days after sowing. During the experimental period, plants were conducted using single stakes with the stems arranged in a row. Basal fertilization was based on the Manual of Fertilizer Recommendation for the State of Pernambuco (IPA, 2008). Plants were initially irrigated with distilled water for a period of 10 days, and the electrical conductivity was gradually increased in order to avoid osmotic shock in the transplanted plants. During the entire experiment, the water content in the pots (80 % of field capacity) was gravimetrically maintained through the replenishment of the evapotranspired water, according to daily weighing, always in the late afternoon, in order to allow the soil to equilibrate with the desired water content during the night.
Soil water potential
Soil total water potential was obtained from determinations of the osmotic and matric potentials. For the estimation of osmotic potential, the soil solution was extracted through saturation paste (Richards, 1954) at 70 DAT. Ten µL of the soil solution were used for the determination of osmolality (solute concentration) in vapor pressure osmometer (WESCOR’S VAPRO® – Model 5600). The osmotic potential was estimated through the Van’t Hoff equation, described below:
Ψo = -R T C
EC NaCl Mixture of Salts
NaCl KCl CaCl2 MgCl2
dS m-1
g L-1
0 - - - -
-1 0.5000 0.3770 0.0020 0.0860 0.1090
3 1.6110 1.1364 0.0071 0.2519 0.3200
5 2.8417 1.8950 0.0134 0.4260 0.5337
7 3.3422 2.9414 0.0170 0.6553 0.8267
9 6.0049 4.1826 0.0211 0.9312 1.1830
where R is the universal gas constant (0.00831 kg MPa mol-1 K-1), T is the temperature (K) and C is the solute concentration, expressed in mol kg-1 (Souza et al., 2012). In order to achieve an osmotic potential representative of the actual condition of soil water content, the value obtained in the saturation paste extract was used to estimate the osmotic potential extracted in extraction capsule at water content close to field capacity. For this, we used the equation proposed by Souza et al. (2013), who used the same type of soil as in the present study.
In each pot, the soil was sampled using a screw auger for the determination of soil water content. Matric potentials were estimated based on the soil water retention curve (SWRC). The total potential of the soil was considered as the sum of the osmotic and matric potentials.
Plant water potentials
The total water potential in the plant was evaluated with a Scholander Pressure Chamber (Model 1515 D - Pressure Chamber Instruments, PMS) in leaves collected from branches of the middle section of the plant at 42 and 70 DAT. These measurements were performed before sunrise, a condition referred to as predawn (Ψpdw). In addition, the potential at noon was determined at 70 DAT.
The osmotic potential of plant sap was determined at the moment of the determination of the total potential. For this, the leaves used in the evaluation of total potentials at dawn and noon were macerated with the pistil, using liquid nitrogen. The sap obtained from the leaf tissue was filtered and centrifuged at 10,000 g for 10 min at 4 °C (Souza et al., 2012). In the sap resulting from this process, the osmolality was determined using a vapor pressure osmometer (WESCOR’S VAPRO® – Model 5600), and the osmotic potential was estimated using the previously described Van’t Hoff equation.
Equilibrium between soil and plant potentials
To determine whether there was equilibrium between the potentials in the soil-plant system, the soil total potential - ΨSoil (matric + osmotic) and the plant total potential - ΨPlant (obtained using the Scholander Chamber) were considered. The potential gradient (Δ) was obtained as follows:
Δ = ΨPlant - ΨSoil
Statistical analysis
The data were analyzed using analysis of variance, fitting of regression equations for the electrical conductivity levels and the Scott-Knot test (p<0.05), for the comparison of means between the soil and plant water potentials.
RESULTS AND DISCUSSION
Soil osmotic (Ψo), matric (Ψm) and total (Ψ) potentials
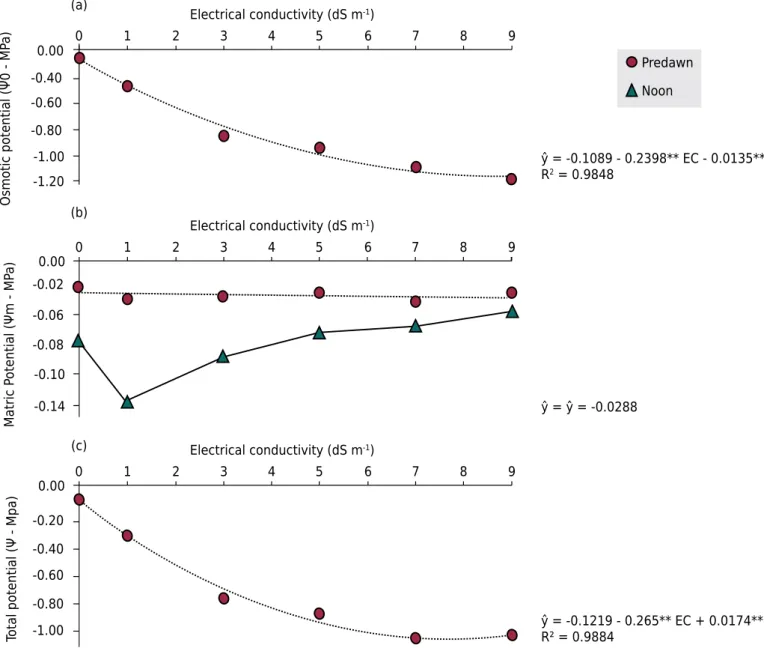
There was no significant effect of salt source (mixture and NaCl) on soil water potential. However, the electrical conductivity was significant for all the variables, which allowed the fitting of regression models for the osmotic, matric and total potentials (Figure 1). As the electrical conductivity of the irrigation water increased, there was an increase in the soluble ions and a decrease in the osmotic potential (Figure 1a). These osmotic effects of salts in the soil solution were also reported by Souza et al. (2012) and Coelho et al. (2014).
irrigated with water of higher electrical conductivity, thus leaving the soil more humid. Similar behavior was observed by Coelho et al. (2014), cultivating cowpea under saline stress.
Total water potential in the soil (Figure 1c), being dependent on matric and osmotic potentials, decreased with the increase in salinity and the consequent reduction in the osmotic potential. The similarity of the behaviors between the regressions for Ψ and Ψo values in the soil indicates that Ψo was the main factor responsible for the reduction in the values of soil total potential, since Ψo comes from the concentration of solutes in the solution. With an increase in the salt concentration in the soil solution, there are alterations in the colligative properties of the water, thus reducing its osmotic potential (Hillel, 2004).
Similar behavior was observed by Souza et al. (2012), evaluating matric and osmotic potentials in a saline soil. Thus, in saline soils, the osmotic potential needs to be evaluated (Groenevelt et al., 2004). There were contributions of 76, 91, 96, 97, 97 and 97 % of the osmotic potential for the total water potential in the soil in the treatments of 0, 1, 3, 5, 7 and 9 dS m-1, respectively (Figure 2), confirming the influence of the soil osmotic potential on the total potential.
Figure 1. Osmotic (a), matric (b) and total (c) soil potentials as a function of the electrical conductivity of the irrigation water at 70 days
after transplanting. **: significant at 1 %.
0 1 2 3 4 5 6 7 8 9
-0.60 -0.40 0.00
-0.80 -1.00 -1.20
ŷ = -0.1089 - 0.2398** EC - 0.0135** EC2
R2 = 0.9848
Electrical conductivity (dS m-1)
Electrical conductivity (dS m-1)
Electrical conductivity (dS m-1)
Osmotic potential (Ψ0 - M
Pa
)
(a)
0 1 2 3 4 5 6 7 8 9
-0.60 -0.40 -0.20 0.00
-0.80
-1.00 ŷ = -0.1219 - 0.265** EC + 0.0174** EC²R² = 0.9884
To
tal potential (Ψ - Mpa)
(c)
0 1 2 3 4 5 6 7 8 9
-0.06 -0.02 0.00
-0.08 -0.10
-0.14 ŷ = ŷ = -0.0288
Matric P
otential (Ψm - M
Pa
)
(b)
When the soil does not have salinity problems and, consequently, the soil solution has a low concentration of chemical elements, the osmotic potential does not have significant effect on the composition of the total potential; thus, the matric potential is the main potential to be considered. However, for saline soils, if the osmotic potential is not considered in the calculation of the total potential, misinterpretations with respect to water availability and movement in the soil-plant system may occur. Therefore, more important than taking into account the electrical conductivity of the soil solution is to determine the osmotic potential, as performed in the present study (Groenevelt et al., 2004; Ben-Gal et al., 2009; Souza et al., 2012). The determination of the osmotic potential becomes even more complicated because of the difficulty in finding osmometers in soil laboratories that perform routine analyses. Thus, pedotransfer functions are indicated for the estimation of the osmotic potential from the electrical conductivity of the soil solution. The series of these equations and, in addition, different methods of soil solution extraction were presented by Souza et al. (2013), with the intention of encouraging the use of the osmotic potential for soils with salinity problems.
The decrease in the total potential results in higher energetic demand by the plant, in order to absorb water from the soil. This increased energy requirement leads to a competition for energy between the processes of assimilation and metabolism of nutrients and water, often causing physiological imbalances (Cabot et al., 2014).
Leaf osmotic (Ψo) and total (Ψ) potentials
The potentials in the plant, as observed in the soil, were not influenced by the salt sources used in the elaboration of the irrigation water. However, the electrical conductivity was highly significant (p<0.01). There was a sharp reduction of osmotic and water potentials with the increase in electrical conductivity for all the evaluated dates and times (Figure 3).
The decrease in the osmotic potential in the leaf sap was possibly due to the accumulation of ions and organic solutes as a means of adapting to saline stress, since a potential gradient between the soil and plant is necessary for the absorption of water and nutrients.
At dawn, plants showed the maximum cell turgor and, consequently, lower intracellular concentration of solutes, compared with the conditions at noon. Thus, it is expected that healthy plants have the capacity to hydrate as much as possible during the early hours of the morning and, due to the transpiration processes, reach minimum turgor at noon.
Water potentials decreased with the increase in the electrical conductivity of the irrigation water along the experiment (Figure 3b). At 70 DAT, at predawn, water potentials were lower compared with the potentials at 42 DAT. This can be explained by the increase in the salts of the soil and the consequent necessity of plants to accumulate solutes in order to reduce this potential. Another important fact is the contribution of water stress
1 76
2
91 96 97 97 97
3 4 5 6
0 20 40 60 80 100
Electrical conductivity (dS m-1)
% of the
Ψ
o to
Ψ
Figure 2. Percent contribution of the osmotic potential (Ψo) to the total potential (Ψ) at 70 days
to the reduction of water potential at noon at 70 DAT (Figure 3b). The water potential at noon decreased by more than 100 % compared with that at dawn, evidencing the influence of the lower plant turgor at this time.The effect of irrigation with saline water was evaluated by De Pascale et al. (2003), with electrical conductivity of 0.5 (control), 4.4 and 8.5 dS m-1 in Capsicum annuum. These authors observed total potential values of -0.95, -1.21 and -1.41 MPa for the treatments of 0.5, 4.4 and 8.5, respectively.
For peppers in saline conditions using irrigation waters of 0, 50 (~5 dS m-1) and 100 mmol L-1 (~10 dS m-1) of NaCl, Azuma et al. (2010) observed that the total potential in the leaves, at 21 days, were equal to -0.7, -1.05 and -1.29 MPa for the increasing salt concentrations in the treatments, respectively. These values confirm the strong correlation between the decrease in total potential in bell pepper leaves with the saline supply promoted by the use of saline water, which was also reported by Azuma et al. (2010), who observed values close to those obtained in the present study. For the electrical conductivity of 9 dS m-1, values of -1.29 and -1.33 dS m-1 for leaf Ψ at 42 and 70 DAT, respectively, were found in the present study. In the study by Azuma et al. (2010), a mean of -1.29 MPa was obtained for the concentration of 100 mmol L-1 NaCl (~10 dS m-1). For the electrical conductivity of 5 dS m-1,values of -0.85 and -1.11 MPa for the determinations performed at 42 and 70 DAT, respectively, were found in the present study. On the other hand, in the study by Azuma et al. (2010), a mean of -1.05 MPa was observed for the treatment with 50 mmol L-1 NaCl.
Relationship between soil and plant total potentials
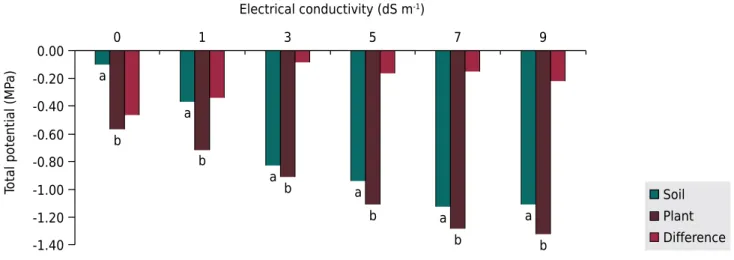
There was no predawn equilibrium between the total potentials in the soil and in the plant (Figure 4). The highest and the lowest differences between plant and soil potentials occurred in the treatments with electrical conductivity of the irrigation water of 0 and 3 dS m-1, respectively, as values of -0.467 and -0.0863 MPa. Nevertheless, it was possible to observe that plants reduced their water potential as the soil potential also decreased.
Figure 3. Mean values of leaf osmotic (a) and water (b) potentials at 42 and 70 DAT at predawn (D) and 70 DAT at noon (N).
**: significant at 1 %.
0 1 2 3 4 5 6 7 8 9
-0.50
-1.50
-2.50
-3.50
0 1 2 3 4 5 6 7 8 9
-0.50
-1.50
-2.50
-3.50
Electrical conductivity (dS m-1)
Electrical conductivity (dS m-1)
Le
af osmotic potential (M
Pa
)
Le
af water potential (M
Pa
)
(a)
(b)
ŷ (Predawn at 42 DAT) = -0.8297 - 0.0999** EC R² = 0.9539 ŷ (Predawn at 70 DAT) = -0.7759 - 0.1499** EC R² = 0.9515 ŷ (Noon at 70 DAT) = -0.944 - 0.2032** EC R² = 0.8846
ŷ (Predawn at 42 DAT) = -0.4992 - 0.08833** EC R² = 0.964 ŷ (Predawn at 70 DAT) = -0.6282 - 0.0863** EC R² = 0.9662 ŷ (Noon at 70 DAT) = -1.1637 - 0.1319** EC R² = 0.8767
In order to confirm this claim, it is important to point out that the plant water potential in the control treatment (0 dS m-1) was equal to -0.569 MPa, while in the treatment with 9 dS m-1 it was -1.326 MPa.
Predawn disequilibrium between plant and soil water potentials in 16 out of 21 tested plant species were observed by Donovan et al. (1999, 2001), and the authors emphasized that this difference can be greater than 2.0 MPa in halophytes. Disequilibrium between plant and soil water potentials in plants of the genera Chrysothamnus and Sarcobatus were also observed by Donovan et al. (2003). Studying plants of the Sarcobatus genus under saline conditions, James et al. (2006) observed disequilibrium of great magnitude between plant and soil. In the literature, a few explanations are provided for such disequilibrium, such as the heterogeneity of soil moisture (difficulty in determining soil water potential directly close to the roots) and the hydraulic conductivity between the soil and the roots. In addition, there are some plant characteristics that have an impact, such as nighttime transpiration and insufficient time for plant rehydration due to high internal resistance (Donovan et al., 1999). For bell pepper irrigated with saline water, it is not possible to use the value of water potential determined in the plant at predawn to estimate the soil water potential.
CONCLUSIONS
Soil total water potential should not be considered similar to the potential in the plant, since there was no equilibrium between these potentials for the evaluated levels of electrical conductivity and soil characteristics.
Water potentials in the soil and in bell pepper were similar for sodium chloride and a mixture of calcium, magnesium, potassium, sodium and chloride.
Leaf water potential at predawn reached values of -1.30 and -1.33 MPa at 42 and 70 days after transplanting (DAT), when water of 9 dS m-1 was used for irrigation. The potential at noon reached a value of -2.19 MPa. The soil subjected to the most saline treatment reached a total potential of -1.20 MPa at 70 DAT. The supply of salts to the soil through irrigation water was the main responsible for the decrease in the osmotic potential in the soil (Ψo) and in bell pepper leaves.
The determination of the osmotic potential in the soil solution should not be neglected in saline soils, because it has a strong influence on the calculation of the total potential.
Figure 4. Test of comparison of means between soil and plant total potentials at each level of electrical conductivity, and the
difference (gradient) between the potentials. Same lowercase letters for each salinity level indicate no significant effect by the
Scott-Knot test (p<0.05).
-0.20
-0.40
-0.60
-0.80
-1.00
-1.20
-1.40 0.00
0
a
b
b a
b a
b a
b a a
b
1 3 5 7 9
To
tal potential (M
Pa
)
Electrical conductivity (dS m-1)
Soil Plant
REFERENCES
Amor FM, Cuadra-Crespo P. Plant growth-promoting bacteria as a tool to improve salinity tolerance in sweet pepper. Funct Plant Biol. 2012;39:82-90. doi:10.1071/FP11173
Azuma R, Ito N, Nakayama N, Suwa R, Nguyen NT, Larrinaga-Mayoral JA, Esaka M, Fujiyama H, Saneoka H. Fruits are more sensitive to salinity than leaves and stems in pepper plants
(Capsicum annuum L.). Sci Hortic. 2010;125:171-8. doi:10.1016/j.scienta.2010.04.006
Ben-Gal A, Borochov-Neori BH, Yermiyahu U, Shani U. Is osmotic potential a more appropriate property than electrical conductivity for evaluating whole-plant response to salinity? Environ Exp Bot. 2009;65:232-7. doi:10.1016/j.envexpbot.2008.09.006
Cabot C, Sibole JV, Barceló J, Poschenrieder C. Lessons from crop plants struggling with salinity. Plant Sci. 2014;226:2-13. doi:10.1016/j.plantsci.2014.04.013
Claessen MEC, organizador. Manual de métodos de análise de solo. 2ª ed. Rio de Janeiro: Centro Nacional de Pesquisa de Solos; 1997.
Coelho JBM, Barros MFC, Bezerra Neto E, Souza ER. Physiological permanent wilting point and osmotic potential of cowpea grown in saline soils. Rev Bras Eng Agric Amb. 2014;18:708-13. doi:10.1590/S1415-43662014000700006
De Pascale S, Ruggiero C, Barbieri G, Maggio A. Physiological responses of pepper to salinity and drought. J Am Soc Hortic Sci. 2003;128:48-54.
Donovan LA, Grise DJ, West JB, Pappert RA, Alder NN, Richards JH. Predawn disequilibrium between plant and soil water potentials in two cold-desert shrubs. Oecologia. 1999;120:209-17. doi:10.1007/s004420050850
Donovan L, Linton M, Richards J. Predawn plant water potential does not necessarily equilibrate with soil water potential under well-watered conditions. Oecologia. 2001;129:328-35.
doi:10.1007/s004420100738.
Donovan LA, Richards JH, Linton MJ. Magnitude and mechanisms of disequilibrium between predawn plant and soil water potentials. Ecology. 2003;84:463-70. doi:10.1890/0012-9658(2003)084[0463:MAMODB]2.0.CO;2
Groenevelt PH, Grant CD, Murray RS. On water availability in saline soils. Aust J Soil Res. 2004;42:833-40. doi:10.1071/SR03054
Hillel D. Environmental soil physics. New York: Academic Press; 1998.
Instituto Agronômico de Pernambuco - IPA. Manual de recomendação de adubação para o estado de Pernambuco: 2ª. aproximação. 2ª. ed. Recife: 2008.
James JJ, Alder NN, Mühling KH, Läuchli AE, Shackel KA, Donovan LA, Richards JH. High apoplastic solute concentrations in leaves alter water relations of the halophytic shrub,
Sarcobatus vermiculatus. J Exp Bot. 2006;57:139-47. doi:10.1093/jxb/erj016
Kirkham MB. Principles of soil and plant water relations. New York: Academic Press; 2004.
Melo HF, Souza ER, Almeida BG, Freire MBGS, Maia FE. Growth, biomass reduction and ions accumulation in Atriplex nummularia Lindl grown under abiotic stress. Rev Bras Eng Agric Amb. 2016;20:144-151. doi: 10.1590/1807-1929/agriambi.v20n2p144-151
Oliveira FA, Duarte SN, Medeiros JF, Dias NS, Oliveira MKT, Silva RCP, Lima KS. Nutrição mineral do pimentão submetido a diferentes manejos de fertirrigação. Hortic Bras. 2015;33:216-23. doi:10.1590/S0102-053620150000200013
Richards LA. Diagnosis and improvement of saline and alkaline soils. Washington, DC: United
States Salinity Laboratory Staff; 1954. (Agriculture handbook, 60).
Santos HG, Jacomine P KT, Anjos LHC, Oliveira VAVL, Francisco J, Coelho MR, Almeida JA, Cunha
TJF, Oliveira JB. Sistema brasileiro de classificação de solos. 3ª. ed. Brasília, DF: Embrapa; 2013.
Sediyama MAN, Santos MR, Vidigal SM, Pinto CLO, Jacob LL. Nutrição e produtividade de
plantas de pimentão colorido, adubadas com biofertilizante de suíno. Rev Bras Eng Agric Amb.
Soil Survey Staff. Keys to soil taxonomy. 12th
.ed. Washington, DC: United States Department of Agriculture, Natural Resources Conservation Service; 2014.
Souza ER, Freire MBGS, Cunha KPV, Nascimento CWA, Ruiz, HA, Lins CMT. Biomass, anatomical changes and osmotic potential in Atriplex nummularia Lindl. cultivated in sodic saline soil under water stress. Environ Exp Bot. 2012;82:20-7. doi:10.1016/j.envexpbot.2012.03.007
Souza ER, Melo HF, Almeida BG, Melo DVM. Comparison of methods for extracting soil solution. Rev Bras Eng Agric Amb. 2013;17:510-7. doi:10.1590/S1415-43662013000500007
Souza ER, Freire MBGS, Melo DVM, Montenegro AAA. Management of Atriplex nummularia
Lindl. in a salt affected soil in a semi arid region of Brazil. Int J Phytor. 2014;16:73-85.