http://www.uem.br/acta ISSN printed: 1679-9275 ISSN on-line: 1807-8621
Doi: 10.4025/actasciagron.v36i2.17268
Susceptibility levels and grouping of peach cultivars in relation to
peach rust under field conditions
Giselda Alves1*, Piérri Spolti2, Cristiano Nunes Nesi1, Emerson Medeiros Del Ponte2 and Louise Larissa May De Mio1
1
Departamento de Fitotecnia e Fitossanitarismo, Setor de Ciências Agrárias, Universidade Federal do Paraná, Rua dos Funcionários, 1540, 80035-050, Curitiba, Paraná, Brazil. 2
Departamento de Fitossanidade, Faculdade de Agronomia, Universidade Federal do Rio Grande do Sul, Porto Alegre, Rio Grande do Sul, Brazil. *Author for correspondence. E-mail: [email protected]
ABSTRACT. The objective of this study was to assess susceptibility and classify peach cultivars in relation to rust (Tranzschelia discolor) under field conditions. The study was conducted in an orchard during the 2007/08 and 2008/09 growing seasons and included the cultivars: Aurora 1, Chimarrita, Chiripá, Coral, Eldorado, Granada, Leonense, Maciel, Marli, Premier and Vanguarda. Several disease-related variables were evaluated, over a 10 day interval from September to February, based on estimates of disease incidence, severity and defoliation. The logistic model adequate fit to rust severity progress data (R2 > 0.90) in the two years. Principal component
analysis (PCA) using all data, irrespective of the year, identified area under the disease progress curve, initial inoculum and disease progress rate as the best variables to differentiate reactions to rust. When PCA analysis was conducted separately for each year, different disease-related variables were selected as a principal component, and cultivars were classified in three groups of susceptibility. There was inconsistency in the grouping of some cultivars, which was likely due to varying environmental conditions between the years. However, ‘Coral’ was consistently grouped in the low susceptibility group and ‘Chimarrita’ and ‘Granada’ in the high susceptibility group.
Keywords:Tranzschelia discolor, horizontal resistance, Prunus persica.
Níveis de suscetibilidade e agrupamento de cultivares de pessegueiro em relação à ferrugem
sob condições de campo
RESUMO. Objetivou-se avaliar a suscetibilidade e classificar as cultivares de pessegueiro em relação à ferrugem (Tranzschelia discolor) em condições de campo. O estudo foi conduzido em pomar nas safras 2007/08 e 2008/09, com as cultivares: Aurora 1, Chimarrita, Chiripá, Coral, Eldorado, Granada, Leonense, Maciel, Marli, Premier e Vanguarda. Diversas variáveis relacionadas com a doença foram avaliadas, em um intervalo de 10 dias de setembro até fevereiro, baseado em estimativas de incidência, severidade e desfolha da doença. O modelo logístico foi adequado aos dados do progresso da severidade (R2 > 0,90), nos dois anos. Para a análise de
componentes principais (ACP), utilizou-se todos os dados, independentemente do ano, identificou-se a área sob a curva de progresso da doença, inóculo inicial e taxa de progresso da doença como as melhores variáveis para diferenciar as reações à ferrugem. A ACP foi realizada separadamente para cada ano, variáveis diferentes foram relacionadas a doença e selecionadas como componente principal, e as cultivares foram classificadas em três grupos de suscetibilidade. Houve inconsistência no agrupamento de algumas cultivares, provavelmente influenciada pela variação das condições ambientais, entre os anos. No entanto, ‘Coral’ foi consistentemente agrupada no grupo menos suscetível e ‘Chimarrita’ e ‘Granada’ no grupo mais suscetível.
Palavras-chave:Tranzschelia discolor, resistência horizontal, Prunus persica.
Introduction
Peach(Prunus persica (L.) Batsch),a member of
the Rosaceae family, is native to Asia but is extensively cultivated in different regions worldwide. China is the largest producer with 10.2 million tons, representing 50% of the world’s production (FAO, 2011). In Brazil, due to the wide range of peach genotypes available for commercial production (FACHINELLO; MARODIN, 2004),
the crop is grown from the central (latitude 20ºS)
to southern (31ºS) regions of the country. Total
national production is approximately 200.000 tons on an area of 19.038 ha (IBGE, 2011).
In the subtropical growing regions, such as those of the state of Paraná in the South of Brazil, the frequency of peach rust epidemics caused by the fungus
Tranzscheliadiscolor (Tranz & Litv) has increased over
the last decade and represents an economic concern
168 Alves et al.
Acta Scientiarum. Agronomy Maringá, v. 36, n. 2, p. 167-174, Apr.-June, 2014
RODRIGUES et al., 2008). Although in temperate climates peach rust fungi are often present as several spore states (uredospores, teliospores, basidiospores and aeciospores), uredospores are the main type of inoculum found in Brazil and commonly overwinters in cankers and branches and produce the primary inoculum for epidemics in the following crop season. Damage by peach rust can often occur as a result of early leaf defoliation, which can cause early flowering and budding (SOTO-ESTRADA et al., 2003), and reduced yields (SOTO-ESTRADA et al., 2005; ALVES et al., 2008). Fungicide applications can suppress the disease (SOTO-ESTRADA et al., 2003), and should used under integrated pest management principles in order to avoid fungicide resistance, fruit contamination with pesticides and increasing production costs. Aiming to reduce fungicide dependence and application, current research is targeting cultivar resistance (CITADIN et al., 2010).
Previous research efforts in Brazil have identified a range of susceptibility in commercial cultivars to peach rust. For instance, Assmann et al. (2010) evaluated 29 peach genotypes and observed differences in
susceptibility including incidence, severity and
defoliation, suggesting a horizontal, non-race-specific type of genetic resistance. Horizontal resistance is considered a worthy strategy when breeding for perennial crops (DEWDNEY et al., 2003) because it restricts the adaptation of the pathogen population to a broader basis of resistance (multiple genes) (PARLEVLIET, 1979). However, the paradox between the usefulness of horizontal resistance and its limited use by breeding programs may be due to the difficulty of assessing and quantifying the horizontal resistance when compared with monogenic resistance (ANDRIVON et al., 2006).
Multivariate analysis of several responses in combination allows simplification and interpretation of the processes in complex phenomena (LEGENDRE; LEGENDRE, 1998), such as plant disease (MADDEN et al., 2007). In the case of disease data from unmanaged systems, multivariate analysis can be useful to analyze and classify a set of genotypes based on disease-related variables related to host resistance.
Reports on peach rust development in the field are scarce. In California, United States, the analysis of peach rust epidemics over several have shown that the first symptoms of the disease were observed either early or late in the season, depending on the environmental conditions in spring and summer, and that this had a direct influence on the temporal patterns of the progression of the disease (SOTO-ESTRADA; ADASKAVEG, 2004). To our knowledge, there are no literature data on the temporal progression of peach rust in commercial
cultivars under subtropical climate conditions. The objectives of this study were a) to monitor and analyze rust development in eleven peach cultivars during two consecutive growing seasons and b) to compare and classify the cultivars with regard to the levels of susceptibility to the disease, based on the phenotypical responses.
Material and methods
Study area and experimental design
The study was conducted in a 5-year-old orchard located in the metropolitan region of Curitiba, State of Paraná, Brazil (25° 24' 42" S, 49°14' 53" W and altitude of 945 m) during the 2007/08 and 2008/09 growing seasons. This orchard was introduced alongside and two years after the planting of ‘Chimarrita’, a cultivar that has been recognized as susceptible to peach rust and that has served as the source of the primary inoculum. The climate in the region is subtropical, with cool summers and no dry season (Cfb) according to Köppen.
The peach cultivars studied were: Aurora 1, Chimarrita, Chiripá, Coral, Eldorado, Granada, Leonense, Maciel, Marli, Premier and Vanguarda. The training system used was Y, and the spacing was 1 m between plants and 2.5 m between rows. Each tree was an experimental unit. On each side of the tree, three branches that emerged in the given year from the lower third, middle and top position were marked, and thus, six branches (replications) were evaluated for each cultivar.
Temporal disease assessments and analysis
For each cultivar, average disease incidence (proportion of diseased leaves related to the total number of leaves on the branch for each of six branches), mean severity (average percentage of the symptomatic area for all leaves) and defoliation (percentage of fallen leaves) were visually assessed in a 10-day interval between September (late bloom to initial fruit growth) and April (natural defoliation). Rust severity assessments were made using, as reference for visual estimation of the injured area, a diagrammatic scale for rust peach tree, with five levels of severity: 1 (0%); 2 (0.8%); 3 (2.4%); 4 (4.5%) and 5 (13.7%) (RODRIGUES et al., 2008).
Disease severity data were analyzed using nonlinear regression procedures of the Statistica 8.0 (STATSOFT, 2008). The logistic model was fitted to the rust progress data, and its biologically-significant
parameters: initial inoculum (y0), maximum severity
(ymax) and disease progress rate (r) were estimated
Univariate and multivariate analysis
Rust reactions among the cultivars were compared based on nine disease-related variables: the three parameters given by the logistic model: initial
inoculum (y0), maximum severity (ymax) and disease
progress rate (r); time in days to the first leaf symptoms (TFS); time in days from the first assessment until a maximum severity was reached (TMS); maximum severity in a single leaf of the branch (MSL); maximum average severity for all leaves in a branch (MSB); area under the disease (mean severity) progress curve (AUDPC) estimated by the trapezoidal integration method (MADDEN et al., 2007); and defoliation calculated based on the proportion of leaves present during the last evaluation in relation to the maximum foliage of the branch (DEFOL).
Univariate analysis was used to compare epidemics within each year. The three logistic model parameters were compared among the cultivars with a t-test (MADDEN et al., 2007), and the means of the other disease-related variables were subjected to analysis of variance and separated using the Scott-Knott test at 5% probability. The Sisvar program was utilized for the statistical analysis.
In multivariate analysis, principal components analysis (PCA) was used in two different ways. The 22 cases (11 cultivars x two years) were analyzed, first combined and later individually within a single year to group the 11 cultivars into levels of susceptibility. Both analyses took into account the nine disease variables. The ‘Gower’ index was calculated and used to evaluate the similarity among the sampling units (LEGENDRE; LEGENDRE, 1998). Cluster analysis was based on Ward’s criterion with a bootstrap procedure of 1,000 permutations for group sharpness (PILLAR, 1999). The number of principal components
(axes) was defined based on the eigenvalues (≥ 1) and
the accumulated variance (≥ 70%). All multivariate
analyses were performed using the multivariate analyses were performed using the MULTIV program (PILLAR, 2004).
Results and discussion
Disease description
Peach rust developed in all trees/cultivars and growing seasons. The onset of rust occurred earlier in the second season when compared to the first. Initial rust symptoms were noticed an average of 98 and 38 days from the first assessment for the first and second season, respectively. In the 2007/08 season, cultivars differed in the timing of disease onset. Disease onset was first noticed in December (~80 days from first assessment) on ‘Maciel’ and ‘Aurora 1’ and on ‘Chiripá’ and ‘Coral’ approximately one month later. In the
following season, the first symptoms were noticed again on ‘Aurora 1’ much earlier than in the previous season (13 days), and symptoms in ‘Vanguarda’, ‘Marli’ and ‘Premier’ followed (26-29 days) (Table 1).
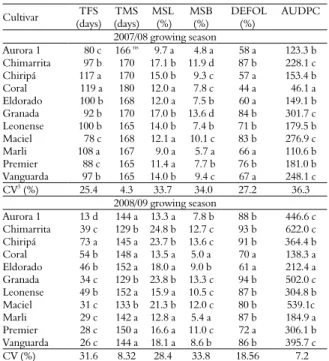
Rust incidence reached 100% in all 22 cases (data not shown). The maximum severity on a single leaf (MSL) ranged from 9% (‘Marli’) to 17% (‘Chimarrita’) for the first year and from 12.8% (‘Marli’) to 24.8% (‘Chimarrita’) for the second year. For mean branch severity (MSB), the lowest values, for both years, were observed on ‘Aurora 1’ (4.8%), ‘Coral’ (5.0%) and ‘Marli’ (5.4%), and the highest were on ‘Chimarrita’ (12.7%) and ‘Granada’ (13.3%) (Table 1). The time to reach the mean maximum severity (TMS) ranged from 165 days (‘Leonense’) to 180 days (‘Coral’) in the first growing season and from 129 days (‘Chimarrita’ and ‘Granada’) to 152 days (‘Eldorado’) in the second season (Table 1).
Table 1. Means1 of disease-related variables2 assessed in naturally
developing peach rust (Tranzschelia discolor) on eleven peach trees/cultivars during two consecutive growing seasons (2007/08 and 2008/09) in Curitiba, Paraná State, Brazil.
Cultivar TFS
(days) TMS (days)
MSL (%)
MSB (%)
DEFOL (%)
AUDPC
2007/08 growing season
Aurora 1 80 c 166 ns 9.7 a 4.8 a 58 a 123.3 b
Chimarrita 97 b 170 17.1 b 11.9 d 87 b 228.1 c
Chiripá 117 a 170 15.0 b 9.3 c 57 a 153.4 b
Coral 119 a 180 12.0 a 7.8 c 44 a 46.1 a
Eldorado 100 b 168 12.0 a 7.5 b 60 a 149.1 b
Granada 92 b 170 17.0 b 13.6 d 84 b 301.7 c
Leonense 100 b 165 14.0 b 7.4 b 71 b 179.5 b
Maciel 78 c 168 12.1 a 10.1 c 83 b 276.9 c
Marli 108 a 167 9.0 a 5.7 a 66 a 110.6 b
Premier 88 c 165 11.4 a 7.7 b 76 b 181.0 b
Vanguarda 97 b 165 14.0 b 9.4 c 67 a 248.1 c
CV3
(%) 25.4 4.3 33.7 34.0 27.2 36.3
2008/09 growing season
Aurora 1 13 d 144 a 13.3 a 7.8 b 88 b 446.6 c
Chimarrita 39 c 129 b 24.8 b 12.7 c 93 b 622.0 c
Chiripá 73 a 145 a 23.7 b 13.6 c 91 b 364.4 b
Coral 54 b 148 a 13.5 a 5.0 a 70 a 138.3 a
Eldorado 46 b 152 a 18.0 a 9.0 b 61 a 212.4 a
Granada 34 c 129 b 23.8 b 13.3 c 94 b 502.0 c
Leonense 49 b 152 a 15.9 a 10.5 c 87 b 304.8 b
Maciel 31 c 133 b 21.3 b 12.0 c 80 b 539.1c
Marli 29 c 142 a 12.8 a 5.4 a 87 b 184.9 a
Premier 28 c 150 a 16.6 a 11.0 c 72 a 306.1 b
Vanguarda 26 c 144 a 18.1 a 8.6 b 86 b 395.7 c
CV (%) 31.6 8.32 28.4 33.8 18.56 7.2
1Means of six replicates. Means followed by same letter in a column do not differ significantly by the Scott-Knott test at 5% significance level. 2
Time in days to the first leaf symptoms (TFS); time in days from the first assessment until reaching the maximum severity (TMS); maximum severity estimated in a single leaf of the branch (MSL); maximum average severity value for all leaves on a branch (MSB); area under the disease (mean severity) progress curve (AUDPC); and defoliation (DEFOL) assessed on 07/03/2008 and 02/14/2009 and estimated based on the proportion of leaves present in the last evaluation in relation to the maximum foliage of the branch. 3Experimental coefficient of variation.
170 Alves et al.
Acta Scientiarum. Agronomy Maringá, v. 36, n. 2, p. 167-174, Apr.-June, 2014
highest levels of defoliation (> 84%), while ‘Coral’ and ‘Eldorado’ had the lowest defoliation percentage (70 and 60%, respectively).
There was a significant correlation (p < 0.05) between DEFOL and MSB (r = 0.64 in 2007/08 and r = 0.34 in 2008/09). In addition to earlier onset, the epidemics were more severe in the second season than in the first season in general, as demonstrated by the higher AUDPC values, which ranged from 138 (‘Coral’) to 622 (‘Chimarrita’) across the cultivars (Table 1).
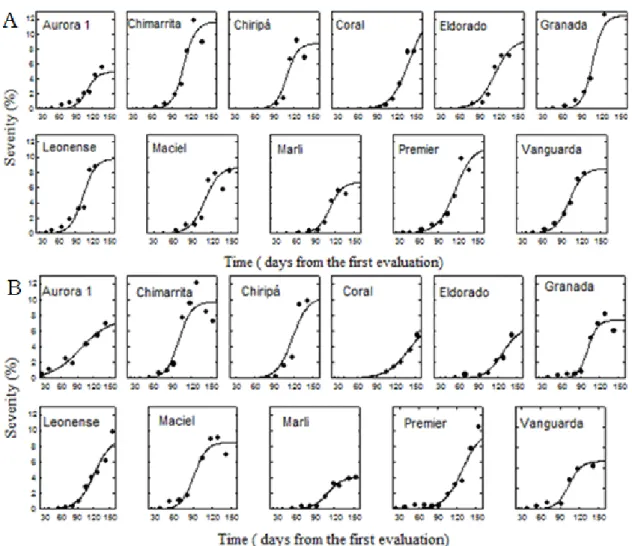
Modeling of the temporal disease progress
The logistic model had a good fit to mean severity data, with coefficients of determination higher than 0.90 (Table 2, Figure 1). When comparing the model parameters among the cultivars, no significant
difference was observed for the initial inoculum (y0),
whereas the disease progress rate (r) varied across the cultivars. The highest r values were determined for the epidemics that developed on ‘Chimarrita’ (0.109) and
‘Granada’ (0.119). The maximum severity (ymax)
estimated was 11.62% (‘Chimarrita’) in the first year and 10.34% (‘Chiripá’) in the second year (Table 2).
Table 2. Mean values for the parameters1 and coefficient of determination (R2
) from a fitted logistic model fitted to peach rust (Tranzschelia discolor) severity progress curves for eleven peach cultivars monitored during two consecutive growing seasons in Curitiba-Paraná state, Brazil.
2007/08 growing season 2008/09 growing season
Cultivar
ymax y0 r R
2 y
max y0 r R
2
Aurora 1 4.99 a 0.163 e-4 ns 0.099 ab 95 7.55 b 0.025 ns 0.037 a 98
Chimarrita 11.62 b 0.0611 e-4 0.109 b 97 9.75 b 0.402 e-4 0.101 b 94
Chiripá 8.78 ab 0.0208 e-4
0.032 a 94 10.34 c 0.524 e-4
0.083 ab 91
Coral 9.57 b 0.438 e-4 0.044 a 98 7.27 b 3.45 e-4 0.056 a 99
Eldorado 7.89 ab 0.026 e-4 0.053 ab 98 6.45 b 0.584 e-4 0.076 ab 97
Granada 12.48 b 0.0245 e-4 0.119 b 98 7.42 b 0.0177 e-4 0.087 ab 97
Leonense 9.83 b 1.02 e-4 0.089 ab 97 9.02 b 3.87 e-4 0.064 ab 97
Maciel 8.70 ab 0.604 e-4
0.088 ab 94 8.51 b 0.948 e-4
0.101 b 97
Marli 6.77 ab 0.101 e-4 0.101 ab 97 4.12 a 0.700 e-4 0.087 ab 98
Premier 11.38 b 0.213 e-4 0.073 ab 97 10.12 c 0.158 e-4 0.067 ab 97
Vanguarda 8.55 ab 0.845 e-4 0.091 ab 99 7.10 b 0.280 e-4 0.034 a 98
1From a logistic model y = y
max/(1+((1/y0)-1)*exp(-rt)), where y= rust severity, t = time in days after the beginning of the evaluation, ymax= asymptote maximum, y0 = initial inoculum and r = disease progression rate in which values followed by the same letter, in a column, do not differ according to a t-test.
PCA analysis and clustering of cultivars
When PCA was used to analyze the set of 22 cases (cultivar x year) cases three principal
components (PC1, PC2 and PC3) were selected
that accounted for 76.9% of the total variance, and
all had eigenvalues >1 (Table 3). AUDPC, y0 and
r were the variables that best described the diseases and contributed to 24.16%, 22.97% and 33.76%, respectively, of the total variance in each of these components (data not shown). These three variables showed the highest correlation with the axes (Table 4).
Table 3. Principal component analysis of the twenty two epidemics of leaf rust (Tranzschelia discolor) monitored during two consecutive growing seasons (2007/08 and 2008/09), in eleven peach cultivars, in Curitiba, Paraná State, Brazil.
Variable PC1x
PC2 PC3
Eigenvalues 3,504 2,182 1,241
% Variance 38,93 24,25 13,79
TFS Time in days to the first leaf symptoms 0,208 0,459 0,435
TMS Time in days to reach maximum severity 0,114 0,389 0,526
MSL Maximum severity for a single leaf of the
branch 0,467 0,077 0,253
MSB Maximum average severity for all leaves
on a branch 0,457 0,255 0,190
DEFOL Defoliation 0,447 0,128 0,193
AUDPC Area under the severity progress curve 0,492 0,154 0,063
Ymax Maximum incidence 0,202 0,409 0,232
y0 Initial inoculum 0,055 0,479 0,033
R Epidemic progression rate 0,176 0,359 0,581
xPC= principal components; yeigenvalues and variance associated with the components; zeigenvectors of the variable resistance of 11 cultivars of peach trees to T. discolor in the 2007/08 and 2008/09 seasons. The variables in bold correspond to 24.16%, 22.97% and 33.76% of the variance descriptors in each of the original components, PC1 to PC3, respectively
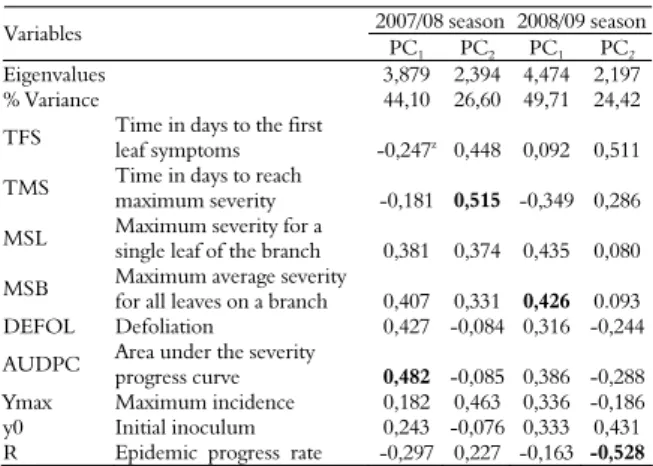
Table 4. Principal component analysis in the evaluation of the resistance of eleven peach tree cultivars to rust (Tranzschelia discolor) over two seasons (2007/08 and 2008/09) in Curitiba-Paraná State, Brazil.
2007/08 season 2008/09 season Variables
PC1 PC2 PC1 PC2
Eigenvalues 3,879 2,394 4,474 2,197
% Variance 44,10 26,60 49,71 24,42
TFS Time in days to the first
leaf symptoms -0,247z 0,448 0,092 0,511
TMS Time in days to reach
maximum severity -0,181 0,515 -0,349 0,286
MSL Maximum severity for a
single leaf of the branch 0,381 0,374 0,435 0,080
MSB Maximum average severity
for all leaves on a branch 0,407 0,331 0,426 0.093
DEFOL Defoliation 0,427 -0,084 0,316 -0,244
AUDPC Area under the severity
progress curve 0,482 -0,085 0,386 -0,288
Ymax Maximum incidence 0,182 0,463 0,336 -0,186
y0 Initial inoculum 0,243 -0,076 0,333 0,431
R Epidemic progress rate -0,297 0,227 -0,163 -0,528
x
Principal component; y
Eigenvalues and variance associated with the components; zEigenvectors of the variables of resistance of 11 cultivars of peach trees to T. discolor.
PCA analysis of the data from the 2007/08
season showed that two components, PC1 and
PC2, accounted for 71% of the total variance, with
an eigenvalue greater than 1 (Table 4). AUDPC and TMS were significantly correlated with the axes (p <0.05, data not shown) and were the
variables that showed the highest coefficients (0.94 and 0.80, respectively), contributing to 23.25% and 26.57% of the total variance in each of these main components.
For the data from the 2008/09 season, PC1 and
PC2 again accounted for 74% of the total variation
(Table 4), and the variables MSB and r had the
highest coefficients in PC1 and PC2, respectively,
explaining 29% and 28% of the total variance in each of these components (Table 4). These components were significantly correlated with the
axes (p <0.05), being equal to 0.92 between PC1
and MSB and -0.78 between PC2 and r (data not
shown). The correlation between variables and axes, as well as the sharpness of the clusters, were used to define the clusters of the cultivars for each year (Figure 2).
Discussion
In this study, the logistic model had a good fit to the temporal data of rust severity in eleven peach cultivars, o the typical polycyclic nature of this rust disease. In a previous epidemiological study conducted in a temperate climate, no single model could adequately fit most datasets of rust incidence (not severity) progress from California, United States (SOTO-ESTRADA; ADASKAVEG, 2004). The authors hypothesized that the various patterns of the progress curves were likely influenced by seasonal variations in the onset of the disease and observed that the logistic model best described epidemics in which onset was later in the growing season.
According to Bergamin Filho and Amorim (1996), overwintering and the early build-up of inocula for rust epidemics would be enhanced under subtropical compared to temperate climate conditions. The early availability and uniformity of primary inoculum levels for the epidemics assessed in this study are evident based on the lack of difference in the estimated values
of the initial inoculum (y0) parameter among the
cultivars. This suggests that strategies for managing peach rust in the studied region should aim to reduce the epidemic progress rate, either through the use of fungicide sprays or by growing cultivars that show slow rust progress (JEGER, 2004).
172 Alves et al.
Acta Scientiarum. Agronomy Maringá, v. 36, n. 2, p. 167-174, Apr.-June, 2014
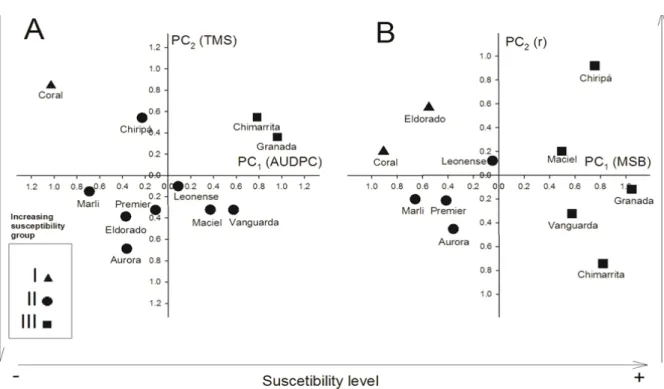
Figure 2. Grouping of the cultivars of peach trees according to susceptibility to leaf rust (Tranzschelia discolor) in the 2007/08 (A) and 2008/09 (B) growing seasons in an orchard in Curitiba, PR, Brazil. Susceptibility increases with the increasing order of roman numerals, according to which the arrows are defined by correlations between the variables area under disease progress curve (AUDPC) (r= 0,94), maximum severity on a branch (MSB) (r = 0,92) with principal component 1 (PC1) and time to reach maximum severity (TMS) (r = 0,80), and epidemic progress rate
(r = -0,78) with the principal component 2 (PC2) in their seasons.
For example, Assmann et al. (2010) analyzed 29 peach genotypes grown in the southwestern region of the state of Paraná, Brazil, and suggested that the variable levels of susceptibility, which were determined based on single-time assessments of incidence, severity and defoliation, were due to the horizontal resistance in some cultivars. Similarly, Citadin et al. (2010) evaluated 36 cultivars of peaches in the same geographic region and also found no immune reaction, and they associated the different reactions among the cultivars with variations in the weather conditions from one year to another.
In our study, the highest rust severity levels were observed in ‘Chimarrita’ (24.8%) and ‘Granada’ (23.8%). Citadin et al. (2010), when evaluating the maximum severity of these same cultivars in southwestern Paraná, also observed significantly higher values for the Chimarrita cultivar (45%). As for defoliation, ‘Chimarrita’ reached a maximum of 93% in the present study, whereas ‘Chimarrita’ showed 58.8% defoliation in southwestern Paraná (CITADIN et al., 2010). Such differences may be due, among other factors, to varying the seasonal inoculum levels and environmental conditions as well as the nutritional status of the tress.
Early defoliation can affect plant growth and, consequently, reduce peach yields in Brazil (ALVES; MAY DE MIO, 2008). Defoliation was
significantly correlated with disease severity in both years. Similar findings were reported by Assmann et al. (2010) (r = 0.79, p < 0.01) for a distinct set of cultivars. ‘Chimarrita’ and ‘Granada’ showed defoliation levels >80%, while ‘Coral’ and ‘Eldorado’ maintained leaves longer, with higher resistance levels. These results are in agreement with those obtained by Assmann et al. (2010), who observed significantly higher plant foliage in resistant cultivars when compared to more susceptible cultivars.
The multivariate analysis we used allowed the identification of AUDPC as the best variable to synthesize the set of 22 cases, and this may be due its nature of integrating aspects related to both the initial inoculum and disease progress. AUDPC is typically used in studies aimed at measuring the components of the quantitative resistance of plants to pathogens (JEGER; VILJANEN-ROLLINSON, 2001) and has been previously used to compare peach rust epidemics in Brazil (CITADIN et al., 2010). Moreover, AUDPC was significantly correlated to other variables, such as time to the first rust symptom, severity variables and defoliation.
rust susceptibility. The Coral cultivar was consistently positioned in the least susceptible group, regardless of the year and variables used as the principal components, which suggests the quantitative nature of rust resistance in peach
trees (ASSMANN et al., 2010). However, a lack of
consistency in the classification of cultivars was observed in our dataset, which may have been influenced by varying environmental conditions that affect the expression of horizontal resistance. The displacement of cultivars from group II in the 2007/08 season to group III in the 2008/09 season, for example, may be due to highly favorable weather conditions for epidemics that developed in the second season (Table 1 and Table 2). The confounding environmental effect when determining disease resistance should not be disregarded when evaluating quantitative disease resistance in plant breeding programs (IRFAQ et al., 2009), which can be attenuated by maintaining and evaluating germplasm in distinct locations and historical series of the detailed epidemic data (CHERIF et al., 2010).
Conclusion
The peach rust epidemic development in southern Brazil is strongly influenced by both weather and genetic resistance of the cultivars, which suggests that disease control can be enhanced by using less susceptible genotypes.
Coral cultivar was consistently grouped in the low susceptibility group and ‘Chimarrita’ and ‘Granada’ in the high susceptibility group.
References
ALVES, G.; MAY DE MIO, L. L. Efeito da desfolha causada pela ferrugem na floração e produtividade do pessegueiro. Revista Brasileira de Fruticultura, v. 30, n. 4, p. 907-912, 2008.
ALVES, G.; MAY DE MIO, L. L.; ZANETTE, F.; OLIVEIRA, M. C. Ferrugem do pessegueiro e seu efeito na desfolha e na concentração de carboidratos em ramos e gemas. Tropical Plant Pathology,v. 33, n. 5, p. 347-353, 2008.
ANDRIVON, D.; PELLÉ, R.; ELLISSÈCHE, D. Assessing resistance types and levels to epidemic diseases from the analysis of disease progress curves: principles and application to potato late blight.
American Journal of Potato Research, v. 83, n. 6, p. 455-461, 2006.
ASSMANN, A. P.; CITADIN, I.; SANTOS, I.; WAGNER JUNIOR, A. Reação de genótipos de pessegueiro à ferrugem-da-folha. Pesquisa Agropecuária Brasileira, v. 45, n. 1, p. 32-40, 2010.
BERGAMIN FILHO, A.; AMORIM, L. Doenças de planta tropicais:epidemiologia e controle econômico. São Paulo: Agronômica Ceres, 1996.
CHERIF, M.; REZGUI, S.; DEVAUX, P.; HARRABI, M. Genotype x environment interaction and heritability of quantitative resistance to net blotch in Tunisian barley.
Journal of Plant Breeding and Crop Science, v. 2, n. 5, p. 110-116, 2010.
CITADIN, I.; BERTUOL, O.; BASSANI, M. H.; SOUSA, R. N.; PINOTTI, L. C. A.; SOLETTI, T. Controle da ferrugem da folha de pessegueiro mediante pulverizações com diferentes fungicidas. Revista Brasileira de Fruticultura, v. 27, n. 2, p. 317-319, 2005. CITADIN, I.; MAZARO, S. M.; DANNER, M. A.; RASEIRA, M. C. B.; MALAGI, G. Variability in leaf rust susceptibility among peach cultivars. Revista Ceres,v. 57, n. 2, p. 185-193, 2010.
DEWDNEY, M.; CHAREST, J.; PAULITZ, T.; CARISSE, O. Multivariate analysis of apple cultivar susceptibility to Venturia inaequalis under greenhouse conditions. Canadian Journal of Plant Pathology,v. 25, n. 4, p. 387-400, 2003. FACHINELLO, J. C.; MARODIN, G. A. B. Implantação de pomares. In: MONTEIRO, L. B.; MAY DE MIO, L. L.; SERRAT, B. M.; CUQUEL, F. L. (Ed.). Fruteiras de caroço: uma visão ecológica. Curitiba: UFPR, 2004. p. 33-49.
FAO-Food and Agriculture Organization of the United Nations. The world agricultural production. Available from:<http://faostat.fao.org/site/339/default.aspx>. Access on: Mar. 22, 2011.
IBGE-Instituto Brasileiro de Geografia e Estatística.
Produção Agrícola Municipal. Available from: <http://www.ibge.gov.br/estadosat/temas.php.2011>. Access on: Mar. 10, 2011.
IRFAQ, M.; MIR, A.; HONGXIANG, M.; GSS, K. Assessment of genes controlling area under disease progress curve (AUDPC) for stripe rust (Puccinia striiformis f. sp. tritici) in two wheat (Triticum aestivum L.) crosses. Cytology and Genetics, v. 43, n. 4, p. 241-252, 2009.
JEGER, M. J. Analysis of disease progress as a basis for evaluating disease management practices. Annual Review of Phytopathology, v. 42, p. 61-82, 2004.
JEGER, M. J.; VILJANEN-ROLLINSON, S. L. H. The use of the area under the disease-progress curve (AUDPC) to assess quantitative disease resistance in crop cultivars.
Theoretical and Applied Genetics, v. 102, n. 2, p. 32-40, 2001.
LEGENDRE, P.; LEGENDRE, L. Numerical ecology. Amsterdam: Elsevier Science, 1998.
MADDEN, L. V.; HUGHES, G.; VAN DEN BOSCH, F. The study of plant disease epidemics. St. Paul: APS Press, 2007.
PARLEVLIET, J. E. Components of resistance that reduce the rate of epidemic development. Annual Review of Phytopathology,v. 17, p. 203-222,1979.
174 Alves et al.
Acta Scientiarum. Agronomy Maringá, v. 36, n. 2, p. 167-174, Apr.-June, 2014 PILLAR, V. P. MULTIV: software para análise
multivariada, testes de aleatorização e auto reamostragem ‘bootstrap’. Porto Alegre: Universidade Federal do Rio Grande do Sul, 2004.
RODRIGUES, A.; SCARPARE FILHO, J. A.; ARAÚJO, J. P. C.; GIRARDI, E. A.; SCARPARE, F. V. Intensidade de poda verde em pessegueiro para controle da ferrugem Tranzschelia discolor (Fuckel) Tranzschel e Litvinov. Revista Brasileira de Fruticultura, v. 30, n. 3, p. 634-638, 2008.
SOTO-ESTRADA, A.; ADASKAVEG, J. E. Temporal and quantitative analyses of stem lesion development and foliar disease progression of peach rust in California.
Phytopathology, v. 94, n. 1, p. 52-60, 2004.
SOTO-ESTRADA, A.; FÖRSTER, H.; HASEY, J.; ADASKAVEG, J. E. New fungicides and application strategies based on inoculum and precipitation for managing
stone fruit rust on peach in California. Plant Disease, v. 87, n. 9, p. 1094-1101, 2003.
SOTO-ESTRADA, A., FÖRSTER, H., DEMASON, D. A., ADASKAVEG, J. E. Initial infection and colonization of leaves and stems of cling peach by Tranzschelia discolor.
Phytopathology,v. 95, n. 8, p. 942-950, 2005.
STATSOFT, Inc. Statistica: data analysis software systems. Version 8.0. Tulsa: StatSoft, 2008.
Received on May 16, 2012. Accepted on September 20, 2012.