Antero Augusto Magalhães Pires
Licenciado em Engenharia InformáticaCombining paper maps and smartphones
in the exploration of cultural heritage
Dissertação para obtenção do Grau de Mestre em
Engenharia Informática
Orientadora: Teresa Romão, Prof. Auxiliar, Faculdade de Ciências e Tecnologia da Universidade Nova de Lisboa
Co-orientador: Fernando Birra, Prof. Auxiliar, Faculdade de Ciências e Tecnologia da Universidade Nova de Lisboa
Júri
Presidente: Doutor Miguel Carlos Pacheco Afonso Goulão Arguente: Doutora Ana Paula Boler Cláudio
Combining paper maps and smartphones in the exploration of cultural heritage
Copyright © Antero Augusto Magalhães Pires, Faculdade de Ciências e Tecnologia, Uni-versidade NOVA de Lisboa.
A c k n o w l e d g e m e n t s
First of all, I would like to thank my advisor Professor Teresa Romão and co-advisor Professor Fernando Birra for entrusting me with this dissertation and for their continued guidance, support, suggestions and patience.
I would also like to thank my college, Faculdade de Ciências e Tecnologia da Uni-versidade Nova de Lisboa, specially Departamento de Informática, for providing all the conditions needed to achieve my goal of obtaining a BSc and now a MSc.
Next, I’d like to thank Luís Marques for his availability and collaboration in the de-velopment of the dissertation, and Professor José António Tenedório from FCSH-UNL for his advice and support.
Thirdly, my thanks goes to my family for their support, assistance and understanding in the final of this chapter of my academic life. Special thanks to my mother for trying to calm me down in the most difficult moments and my grandmother Laura for all the
meals I was late to.
Last, but definitely not least, I thank my friends Tiago Ferreira, Joana Pires, Fábio Pires, Tânia Martins, José Jorge, Ana Tavares, Liliana Gonçalves and David Soares for their encouragement, patience, help and support on the most difficult moments of this
dissertation and of course, for sharing great moments with me over this last year. A great special thanks to Joana for her grammar check abilities and suggestions for the writing of this document. I would also like to thank Pedro Soares for his post-deadline surprise gift.
And finally, of course, Professor Tavares da Cruz for his major support in my first years of college.
A b s t r a c t
Latest advances in technology allowed us to have, nowadays, powerful computing devices in our pockets. These advances have also allowed the rapid growth of Augmented Reality, which continues to expand into new areas where the integration of virtual and real worlds brings new and beneficial experiences.
It is on these Augmented Reality capable devices that there may be a key that will open a door to a new experience in exploring cultural and historical sites, currently very dependent on paper and static information maps or mobile interactive applications that, although capable of providing real-time information, may not give users a contextualized view of the different cultural elements in their surrounding environment.
The goal of this dissertation is to explore new ways to interact and view content asso-ciated with a cultural and historical site through a smartphone-focused application with Augmented Reality and location-aware features. Combining a paper map with a smart-phone, the user can see virtual representations of sites, manipulate them in 3D, overlap historical cartography on the map or view relevant multimedia information, among oth-ers. In an effort to raise awareness of less known sites or whose location isn’t immediately
apparent, the application alerts the user about sites near his position.
Then, the application underwent various tests by potential users, in order to evaluate its concept and usability.
In the end, it is expected to develop a new user interactive experience, as an attempt to increase interest and awareness of cultural and historic sites and their roles, and formulate recommendations on the development of heritage-oriented applications.
R e s u m o
Os rápidos avanços na tecnologia permitiram que, hoje em dia, tenhamos poderosos dispositivos de computação nos nossos bolsos. Estes avanços permitiram também o rápido crescimento da Realidade Aumentada, que continua a expandir-se para novas áreas onde é possível integrar o mundo virtual com o mundo real para trazer novas e benéficas experiências.
É nestes dispositivos capazes de Realidade Aumentada que pode estar uma chave que permitirá abrir uma porta de uma nova experiência de exploração do património cultural e histórico, actualmente muito dependente de mapas e informação estática em papel ou aplicações interactivas que, embora sejam capazes de fornecer informação em tempo real, podem não conseguir dar ao utilizador uma vista contextualizada dos vários elementos culturais no seu redor.
O objectivo desta dissertação será explorar novas maneiras de interacção com o patri-mónio cultural e histórico, visualizando conteúdo associado a um espaço através de uma aplicação com funcionalidades de Realidade Aumentada e de localização vocacionada para smartphones. Combinando um mapa de papel com um smartphone, o utilizador poderá ver representações virtuais dos espaços, manipulá-las em 3D, sobrepor cartografia histórica sobre o mapa, ou consultar um conjunto de elementos multimédia relevantes, entre outros. Num esforço de divulgação de locais menos conhecidos ou cuja localização não seja imediatamente aparente, a aplicação alerta o utilizador da presença desses locais nas suas imediações.
A aplicação foi depois submetida a vários testes com potenciais utilizadores para avaliar o conceito e a sua usabilidade.
No final, espera-se desenvolver uma nova experiência interactiva aos utilizadores que aumente o interesse pelo património e os seus papeis, bem como formular recomendações sobre o desenvolvimento de aplicações vocacionadas para o património.
C o n t e n t s
List of Figures xv
List of Tables xvii
1 Introduction 1
1.1 Motivation and Context. . . 1
1.2 Problem Description . . . 2
1.3 Proposed Approach . . . 3
1.4 Contributions . . . 5
1.5 Document Organization . . . 5
2 Related Work 7 2.1 Augmented Reality . . . 7
2.1.1 Displaying Augmented Reality . . . 7
2.1.2 Tracking Techniques . . . 10
2.2 Case Studies . . . 12
2.3 Tools . . . 13
2.3.1 Vuforia . . . 14
2.3.2 OpenCV . . . 14
2.3.3 Unity . . . 14
2.4 Discussion . . . 15
3 Approach 17 3.1 Introduction . . . 17
3.2 Experimental Work . . . 18
3.2.1 Teapots and multiple image targets . . . 18
3.2.2 Model positioning and displaying. . . 19
3.3 System description . . . 20
3.3.1 Augmented Paper Map . . . 21
3.3.2 Multimedia Content . . . 23
3.3.3 Location-aware service . . . 25
3.3.4 Content web server . . . 25
C O N T E N T S
3.4.1 Digital Terrain Model issues . . . 28
3.4.2 3D Models . . . 28
3.4.3 Splitting the app . . . 29
3.4.4 Various Image Targets vs. Single Image Target. . . 29
3.5 Conclusion . . . 30
4 Evaluation 31 4.1 Early Evaluation . . . 31
4.1.1 Methodology. . . 31
4.1.2 Results . . . 32
4.2 Urban Heritage Valuation Workshop . . . 35
4.2.1 Methodology. . . 35
4.2.2 Results . . . 35
4.3 On-Site Evaluation . . . 37
4.3.1 Methodology. . . 37
4.3.2 Results . . . 38
5 Conclusions 43 5.1 Conclusions . . . 43
5.2 Recommendations and Future Work . . . 44
Bibliography 47
L i s t o f F i g u r e s
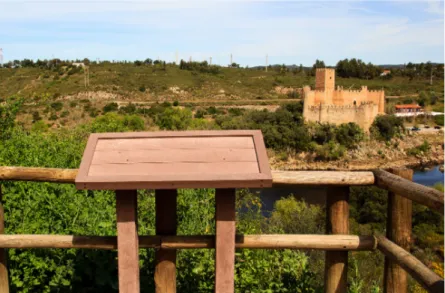
1.1 A worn-out panel that held content about the castle ofAlmourol, Tancos, Portugal 2
1.2 System architecture . . . 3
1.3 A portion of theÁguas Livresaqueduct system . . . 4
2.1 Milgram’s [18] Virtuality Continuum diagram . . . 8
2.2 Azuma’s [2] conceptual diagram of an optical HMD . . . 8
2.3 Azuma’s [2] conceptual diagram of a video HMD . . . 9
2.4 Azuma’s [2] conceptual diagram of a monitor based AR system . . . 10
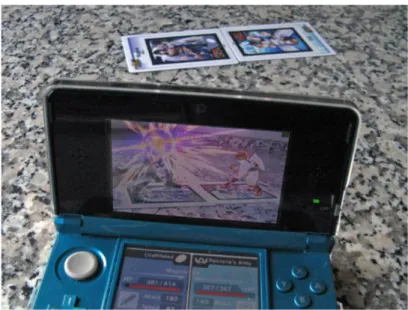
2.5 Kid Icarus Uprisinguses a marker-based technique for its AR game mode . . 11
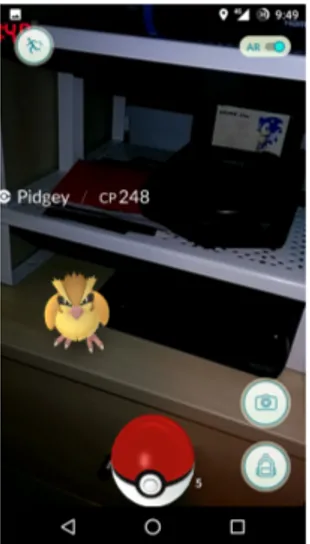
2.6 Some of Pokémon GO’s gameplay mechanics . . . 15
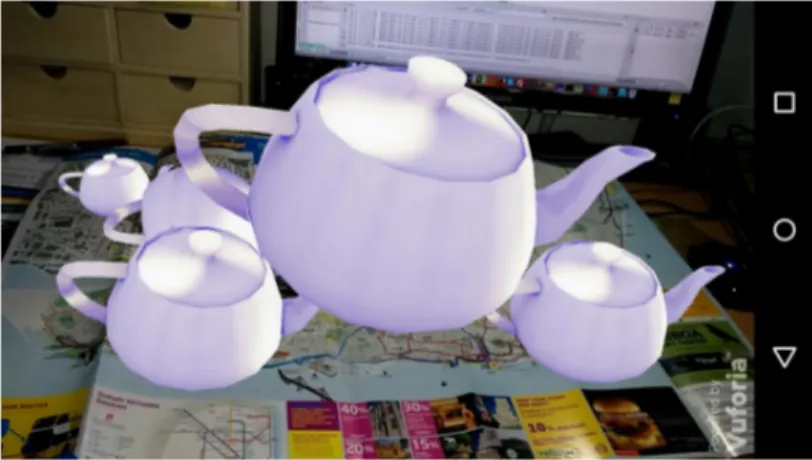
3.1 First tests: multiple overlapped image target recognition using Vuforia . . . 19
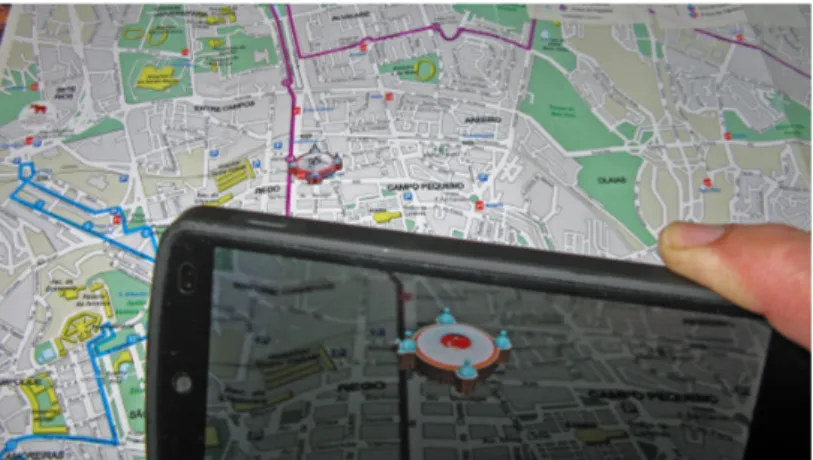
3.2 Campo Pequeno3D model (4161 polygons) displayed over a Lisbon Map . . . 20
3.3 2016 edition of the Official Lisbon Plan paper map . . . . 21
3.4 Overview of the camera view, with the cartography, pathway, 3D models and location marker on the map . . . 22
3.5 Part of Lisbon’s downtown in Filipe Folque’s cartography . . . 23
3.6 Various screenshots of the Augmented Reality features of Aqueduct AR . . . 24
3.7 Screenshots of some of the multimedia and location features of Aqueduct GPS 26 3.8 Database diagram . . . 27
3.9 In-app comparison between the original model of theEsperançafountain (3.9a) and the cut model (3.9b) . . . 29
3.10 Interface mockup of the detail view before the app split . . . 30
4.1 Main screen of Aqueduct Digital showing the pathway, cartography and the sites represented by markers . . . 32
4.2 Early evaluation: questionnaire results of Likert-type scale statements . . . . 33
4.3 Early evaluation: comparison of questionnaire results between the two versions 34 4.4 Workshop evaluation results, comparing Aqueduct’s mean with the apps over-all mean . . . 36
4.5 Common route taken by all on-site test sessions . . . 38
L i s t o f F i g u r e s
4.8 On-site evaluation: questionnaire results of AR and GPS service specific state-ments . . . 40
L i s t o f Ta b l e s
4.1 Statement label key for figure 4.2 chart . . . 33
4.2 Statement label key for figure 4.4 chart . . . 36
4.3 Statement label key for figure 4.7 chart . . . 39
C
h
a
p
t
e
r
1
I n t r o d u c t i o n
This first chapter introduces the context where this dissertation fits and the motivation behind it. Then it formalizes the problem identified and presents a proposed approach to solve it. Finally, this chapter outlines the expected contribution of this dissertation and the structure of the rest of document.
1.1
Motivation and Context
Over the course of history, mankind had the need to adapt and develop various infras-tructures to improve life, whether for subsistence or means of leisure. Such achievements, which had an important contribution to modern life, are represented by sites that resisted the flow of time and are considered as part of our cultural and historic heritage.
Often overlooked, these sites can go unnoticed by potential visitors and curious peo-ple. Exploring new ways of interaction and raising public awareness of these sites is a challenge in a modern society, where people tend to be with their heads down focused on smartphones, oblivious of their surroundings.
Advancements in technology in recent years made possible to have almost the entire world inside our pocket, thanks to smartphones. Small yet powerful, they offer an
exten-sive amount of resources such as location sensors, camera, internet access and graphics processing. This potential can be explored for its ubiquity and interactive capabilities, allowing the development of mobile applications that open a new door for the communi-cation between the user and the heritage of cultural and historic sites.
This dissertation was developed in collaboration with Luís Marques working at Inspecção-Geral da Agricultura, do Mar, do Ambiente e do Ordenamento do Território1 and a PhD
student atEscola Tècnica Superior d’Arquitectura de Barcelona - Universitat Politècnica de
C H A P T E R 1 . I N T R O D U C T I O N
Catalunya2co-advised by Professor José António Tenedório fromFaculdade de Ciências
Sociais e Humanas - Universidade Nova de Lisboa3. Luís provided 3D models and various
multimedia content of theÁguas Livresaqueduct system which will be detailed in chapter 3.
1.2
Problem Description
Public awareness of cultural and historical sites is correlated with the way they are pre-sented to potential visitors. Often that kind of sites can go unnoticed by passersby or less informed tourists, due to poor or inexistent information of their existence.
Worn out panels like the one seen on figure1.1and no information available on the user’s native language are some of the ways to sever this communication link between visitors and sites, leaving interested people oblivious of the heritage and major roles those sites once had on their historical timeline.
Figure 1.1: A worn-out panel that held content about the castle of Almourol, Tancos, Portugal
Even when those problems aren’t visibly present, information displayed often consists of static elements, making the human interaction reduced to simply watching, reading or moving to the next place. Devices specialized on interactivity require some investment and maintenance costs that are usually unsustainable by the organization that takes care of the place, effectively putting out of commission interactive content such as simulation
of water movement on an aqueduct or picture overlapping.
A paper tour map and a smartphone are two items that are usually part of a tourist’s inventory. A tour map is easy to find and carry, has basic (and static) information [31] about major cultural sites and their location and sometimes small 2D representations.
2http://www.etsab.upc.edu/ 3http://www.fcsh.unl.pt/
1 . 3 . P R O P O S E D A P P R OAC H
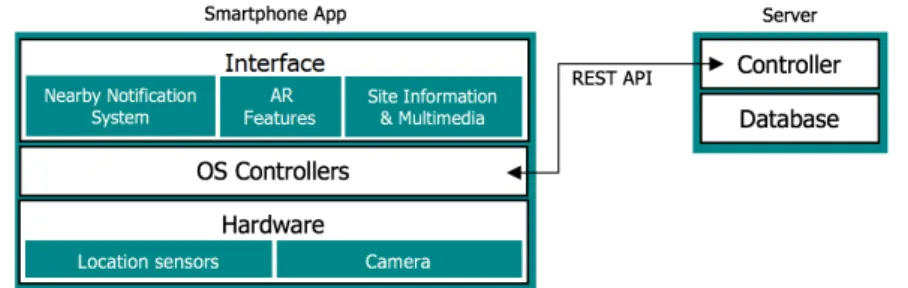
Figure 1.2: System architecture
They provide a friendly, familiar and easy way to plan a visit or navigate in a city and a wide overview of the area they cover, something hard to achieve in a small screen of a mobile device, specially for an overall analysis of long routes. According to Brown and Chalmers [4], a paper map is an important tool for tourists, along with a guidebook.
However, further detailed information often requires getting additional pamphlets or using the smartphone (provided that an internet connection is available) for a web search that may not be as quick as expected because of a possible need to filter unwanted results.
How to address these problems and at the same time provide the user with an inter-active experience?
1.3
Proposed Approach
The proposed approach takes advantage of the benefits of paper maps and overcomes their limitations. With the use of AR we can transform a paper map into a dynamic map capable of delivering contextual information to its users in real-time. Because this information is dynamic, it’s easy to update without the need to reprint and replace its base paper map and it can be theoretically infinite, giving the users the option to select which piece of information they want to view at a given moment, as not to clutter the screen [11].
This approach has three main components for its architecture (see Figure1.2): An Augmented Reality component for displaying virtual objects on the paper map, a multi-media component where each cultural site has associated content (updatable through a web server) and a location-aware component that will help the user discovering cultural sites, that may not be easily spotted on a normal sightseeing tour. With these compo-nents, the system hopes to answer the questions “What’s that?” and “What’s here?”, two important questions that mobile tour systems need to support according to Davies et. al [7].
It is centered on a mobile smartphone application (app) targeted to Android devices, with features that aim to enhance the user experience while touring and exploring histor-ical and cultural heritage sites. More information will be detailed in chapter3.
C H A P T E R 1 . I N T R O D U C T I O N
users preparing their visits beforehand and notifying them about interesting and lesser known sites, that may be near them while traveling the city and informing about historic content and details of the site’s role.
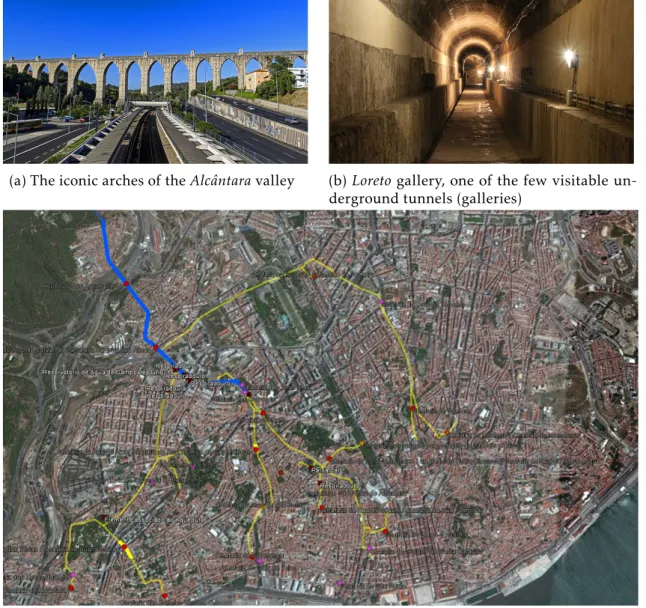
As a working example, the application will be using theÁguas Livresaqueduct system (Figure1.3) in Lisbon, Portugal as a basis. TheÁguas Livresaqueduct system was built
(a) The iconic arches of theAlcântaravalley (b)Loretogallery, one of the few visitable un-derground tunnels (galleries)
(c) The aqueduct’s final pathway diagram as it enters Lisbon
Figure 1.3: A portion of theÁguas Livresaqueduct system
in the 18th century as an effort to solve the problem of lack of drinking water in the
city. A quick web search usually shows us the most iconic part of the aqueduct pathway, which are the arches over theAlcântaravalley, but in fact that’s only a little part of the whole system, composed of many fountains, reservoirs and a vast underground network of tunnels scattered over Lisbon, part of them open to visits. The variety of sites associated
1 . 4 . C O N T R I B U T I O N S
with the whole system, their not so directly apparent connection and different levels of
public awareness were the key factors in choosing theÁguas Livresaqueduct.
1.4
Contributions
The mobile application and the research done on new ways to explore the cultural and historic heritage sites are the main contributions of this dissertation. Research has been done on the interaction with Augmented Reality systems that combine the use of paper maps and smartphone and their impact in public awareness of the related sites.
The developed work hopes to bring more public awareness to cultural and historic sites, (in this case theÁguas Livresaqueduct) with new ways of interaction and to give the user an intuitive experience in exploring new types of views, historic content and details of the site’s role.
User feedback will be important not only for studying the impact of these types of augmented experiences on people’s cultural awareness and navigation when exploring cultural elements in a city, but also for input for current work and recommendations for future development.
Finally, this dissertation’s work is reflected on two papers, one published and pre-sented at the EPCGI’2016 in Covilhã on 25th November 2016 [24], and the other accepted for future publication in the ACE magazine [16].
1.5
Document Organization
In addition to this chapter, the rest of the document is organized as follows:
• Chapter2addresses the related work on the Augmented Reality concept in detail and introduces some case studies directly or indirectly related to the context of this dissertation. It also mentions tools for developing AR-enabled software and wraps up with a brief discussion.
• Chapter 3 details the implementation of the proposed approach, describing the
experimental work done, the system’s components and how major drawbacks were overcame.
• Chapter4is dedicated to the testing of the proposed approach done by potential users and to the analysis of their evaluation and feedback.
C
h
a
p
t
e
r
2
R e l a t e d Wo r k
This chapter starts by describing the Augmented Reality (AR) concept, a major compo-nent of this dissertation’s approach, detailing methods and techniques of displaying and aligning it with the real world. Next, it introduces some notable case studies done in the AR department, some of which close to the context of this dissertation. Then, this chapter examines some examples of tools available for Augmented Reality, and finally wraps up with a brief discussion.
2.1
Augmented Reality
According to Milgram and Kishino [18], Augmented Reality can be located between the real world and the Virtual Reality environments in the Virtuality Continuum (figure2.1). It is part of the Mixed Reality environment concept where real and virtual objects are present together in the same view. It is a technology that allows the user to observe the real world with imposed virtual objects in a way that they seem to co-exist in the same space as real world objects. Azuma et al. [1] defines AR systems to share these properties:
• Brings real and virtual objects together in a real environment.
• Is real-time interactive.
• Aligns virtual and real objects in three dimensions.
2.1.1 Displaying Augmented Reality
C H A P T E R 2 . R E L AT E D WO R K
Figure 2.1: Milgram’s [18] Virtuality Continuum diagram
of the first devices that made Augmented Reality possible. They were used, for example, in military aircraft providing basic navigation and flight information by a see-through lenses, that allowed the pilot to see the real world with said information superimposed.
2.1.1.1 Optical Technology
Optical technology such as optical see-through HMD’s works by placing optical combin-ers in front of the user’s eyes. They are partially transmissive and reflective, so that the user can view the real world through them at the same time he sees virtual images cre-ated by the scene generator as seen on the diagram in figure2.2. Depending on the used hardware, this direct view of the real world may have some drawbacks: only a fraction of the real world light reaches the user’s eyes and while the real world is seen without any delay, there may exist some lag on virtual images. However in case of system failure, the user can still view the real world albeit with that portion of missing light (similar to when wearing a pair of sunglasses). Google Glass1and the upcoming Microsoft Hololens2are
examples of optical AR displays.
Figure 2.2: Azuma’s [2] conceptual diagram of an optical HMD
1http://www.google.com/glass
2https://www.microsoft.com/microsoft-hololens/
2 . 1 . AU G M E N T E D R E A L I T Y
2.1.1.2 Video Technology
Video technology relies on video cameras to display the real world to the user. This technology is used by another type of HMD’s and monitor-based systems.
Video see-through HMD’s combines a closed-view HMD with head mounted video cameras that capture and provide the user’s view of the real world combined with virtual images created by the scene generator. A diagram by Azuma [2] can be seen in figure2.3. In case of failure the user can no longer view the real world through the video HMD’s, unlike their optical counterparts. The Oculus Rift3is an example of video head-mounted display.
Figure 2.3: Azuma’s [2] conceptual diagram of a video HMD
Monitor-based systems include one or two cameras to capture the real environment and display it combined with the virtual generated images on a display monitor in front of the user, like shown on figure 2.4. Any device with a camera, screen and the appro-priate software can be considered an AR system of this type. Rekimoto called this"the magnifying glass metaphor approach"when he proposed a system called theNaviCamthat consisted of a small LCD-TV, CCD camera and a gyro sensor [27]. Advancements in tech-nology made possible to incorporate this concept in modern day devices like smartphones, portable computers and videogame systems. In fact, the high portability of these systems led to the growth of AR games like the one seen in figure2.5. Notably handheld displays are“a good alternative to HMD [...] systems for AR applications, particularly because they are minimally intrusive, socially acceptable, readily available and highly mobile”according to Zhou et al. [35].
C H A P T E R 2 . R E L AT E D WO R K
Figure 2.4: Azuma’s [2] conceptual diagram of a monitor based AR system
2.1.2 Tracking Techniques
Tracking is the most popular researched topic according to Zhou et al. [35]. There are two main techniques used for tracking - sensor and vision based - that can be used independently or in conjunction (hybrid technique).
2.1.2.1 Sensor Based Tracking
This technique relies on sensors such as GPS, gyroscopes, accelerometers and magnetome-ters in order to find the location and orientation of real world objects. Rolland et al. [28] identifies six main principles of sensor based tracking:
• Time of Flightrelying on measuring distances between sensors attached to targets via the time of propagation of pulsed signals.
• Spatial Scanusing beacons and sensors, where the beacon is in a fixed position and the sensors on the targets (inside-out) or the other way around (outside-in).
• Inertial Sensing attempting to conserve a given axis of rotation (gyroscope) or a position (accelerometer).
• Mechanical Linkagesusing mechanical parts that can be used to compute the ori-entation via incremental encodings. Wires rolled on coils in a spring system are tensed to measure distance.
• Phase-Differencemeasures the difference of a target’s incoming signal with a
com-parison signal located on the reference, sharing the same frequency. Sutherland’s system [32] used this type of tracking in the 1960s.
• Direct-Field Sensing using a known field, such as Earth’s magnetic and gravita-tional field, to get orientation and position.
2 . 1 . AU G M E N T E D R E A L I T Y
2.1.2.2 Vision Based Tracking
This technique uses image processing methods to calculate the camera’s pose in relation to real world objects.
Marker-basedmethods determines the camera pose in real time from artificial mark-ers recognized by detecting marker properties known to the processing algorithm (such as patterns or corners). With this information it is possible to calculate and position a vir-tual object within the real world scene captured by the camera, according to the marker’s position and orientation. Think of a marker as a portal between real and virtual realms -without it, the virtual object cannot be placed in the real world. Some videogames use a marker-based methods such asKid Icarus: Uprisingfor theNintendo 3DSin its AR game mode, as seen in figure2.5.
Figure 2.5:Kid Icarus Uprisinguses a marker-based technique for its AR game mode
Feature-basedmethods rely on points, edges, textures and other naturally occurring features to determine the camera’s pose. With the pose known, additional captured features can be used to extend tracking and update position. According to Zhou et al. [35],"the most recent trend in computer vision tracking techniques [...] is model-based tracking methods". A model of features of tracked objects is used to track their location on the real world. As edges are efficient to find and illumination resistant, they are the most
C H A P T E R 2 . R E L AT E D WO R K
2.2
Case Studies
Many case studies were developed in order to explore the full potentials of mixing virtual and real world realms.
One notable example in historic heritage isArcheoguide. As defined by Vlahakis et al. [34], it stands for "Augmented Reality-Based Cultural Heritage On-Site Guide". It was designed to be an electronic guide to historic sites. The system consisted of a client-server architecture with 3 different type of mobile clients: A laptop with a HMD for Augmented
Reality displaying 3D models of sites like they used to be and offering a personalized
tour based on the user’s profile, a tablet that used DGPS for navigation and a palmtop (a precursor of smartphones) that presented information at certain points and augmented multimedia, like an animation of virtual athletes competing on a site that once was a stadium.
Olympia was the place chosen for testing, where three access points were installed in order to provide a network connection and a DGPS beacon to correct GPS position. The test received good reviews with the major issues being some users feeling uncomfortable in wearing the HMD and the small screen of the palmtop. The application of this disser-tation aims to bring together many features of the 3 separate clients like the animations present on the palmtop and the AR component of the laptop.
One of the earliest case studies isTouring Machine: A prototype campus informa-tion system. This prototype aimed to use AR in order to make an interactive information system about buildings of an university campus based on the location and users’ field of view. As the researchers wanted to use off-the-shelf hardware for this experimental
prototype, the system weighted about 40 pounds and consisted of a backpack computer, a handheld computer, HMD, and orientation and GPS position trackers [8].
With advancements on technology., all this hardware can fit on a small device such as a smartphone. That led to further explorations of this concept with case studies like Swis-sPeaks, which used a smartphone’s camera and GPS sensor to help identifying mountain peaks of Switzerland [12], and in commercial apps. In Portugal,Grande Rota do Vale do Côa4 andRota do Românico5 are examples of commercial cultural and historic heritage
related applications that explore this concept. These applications rely on location and camera to display 2D content over the captured image, rather than the paper map with 3D models approach that this dissertation’s application aims to achieve.
MapLensis another case study close to the context of this dissertation. This case study compared the use of two different solutions in group collaborative tasks. One solution
(called DigiMap) relied only on a smartphone with built in map software, while the other said device augmented a paper-city map in a context Morrison et al. [20] call "magic lens", hence the name MapLens. In both solutions the smartphone would display information such as text or images about certain points that were visible at the moment (either by
4http://granderotadocoa.pt/ 5http://www.rotadoromanico.com/
2 . 3 . T O O L S
displaying the built-in map with DigiMap or the part of the map captured by the camera with MapLens).
A test in form of a location and team-based treasure hunt game was run in Helsinki in March 2008. The results showed that although the users of MapLens had some trou-ble with navigation, as the map needed to be stabilized in order to be detected by the smartphone, these group members worked together and shared the map unlike DigiMap groups where one user used the device and the others observed their surroundings.
This concept of magic lens dates back to early 90’s when Fitzmaurice presented a sys-tem namedChameleon[9], which investigated how palmtop devices can bridge physical objects with computer generated information, aware of their location. Schöning et al. presented a different approach calledMap Torchlight, which placed virtual elements
di-rectly on a physical map through a projector unit [30], rather than viewing them through a screen.
In a similar way to MapLens,APM: Augment Paper Mapexplores the potential that paper maps have when combined with devices with GPS and connectivity capabilities, augmenting said maps with additional content and features via a mobile device. Paelke and Sester focused their work [23] on small water craft navigation. A device is used in conjunction with a paper navigation chart to provide current position, location updates and interactivity such as defining a route and finding out about last minute warnings and changes impossible to visualize on a static piece of paper.
The prototype uses a webcam pointed to a map where a PDA with an ARToolkit marker attached could be used. Based on the marker’s distance and rotation from the webcam, ARToolkit through image processing [13], could calculate the PDA’s position and orientation with the appropriate information for its location being displayed on the screen. This case study is one of the closest to the context of this dissertation, as while it focused on the use of paper maps in sailing, it can be expanded to other areas, namely the exploration of cultural heritage.
ARTourMap[22] is another interesting example close to the context of this disserta-tion, as it uses the MapLens concept to display 3D buildings on a paper map, though apparently with no great level of detail and not easily manipulable, as few details are currently available.
2.3
Tools
C H A P T E R 2 . R E L AT E D WO R K
2.3.1 Vuforia
Vuforia6(now owned and developed by PTC) is a software development kit originally
developed by Qualcomm that makes possible the creation of Augmented Reality applica-tions for mobile devices. Currently, it provides an API both for native Android (Java) and iOS (Objective C) systems and also an Unity game engine extension, making possible the development of an application that can be easily ported to both systems.
It’s capable of tracking up to five 2D images simultaneously (called Image Targets)[25] as well as cuboid and cylinder 3D objects. Upon detecting the pre-configured image, Vuforia is able to display virtual objects like 3D models and positioning them according to position and orientation of the detected image target in real time, giving the perception that the virtual objects are part of the environment captured by the device’s camera.
2.3.2 OpenCV
OpenCV7 is an open source computer vision software library. It has hundreds of al-gorithms including computer vision and machine learning ones that can identify faces, objects, tracking movements, image processing, producing 3D models, among others.
On the AR field, besides the tracking and identification algorithms, OpenCV is capa-ble of recognizing scenery and establish markers on it. There are a number of AR-focused programs and libraries that rely on OpenCV such as OpenAR8and ArUco9.
Being an open-source software, OpenCV is available for many platforms like Win-dows, Android and MacOS and has interfaces written in C++, C, Python, Java and MAT-LAB.
2.3.3 Unity
Unity10is a specialized game development engine. It supports various devices such as PCs, videogame consoles and handheld devices like smartphones and tablets, providing a multi-platform solution for the developers that want to create 2D and 3D experiences. Coding is made on C#, and it supports extensions to further enhance the platform’s capabilities.
AR on Unity is achieved using specialized extensions, such as the previously men-tioned Vuforia and UART11. Although the main focus of Unity is game development, it is possible to develop applications that although interactive, cannot fall into the category of "pure game", making Unity an interesting platform for applications that aim to support multiple operating systems.
2 . 4 . D I S C U S S I O N
2.4
Discussion
In this chapter, we analyzed the various technologies related to Augmented Reality, one major focus of this dissertation’s work. Although in the early days this way of joining virtual and real objects was very limited to what hardware could offer, achievements over
recent years in microprocessing and mobile technology opened a new door for AR to evolve and walk towards a mature state. What in the past was limited to a single user carrying a heavy backpack and a headset that wouldn’t be out of place in a futuristic movie, can now be enjoyed be many at the same time, sharing one device that fits well in the palm of the hand.
Tracking techniques also evolved and are more efficient thanks to evolution of
hard-ware and image processing and recognition algorithms, with some techniques dismissing the use of markers and relying on naturally occurring features. All these advancements in recent years allowed the rapid appearance of multiple AR-based experiences, mainly games.
During the writing of this document, a game that takes advantage of historic sites for some of its gameplay mechanics was released to a worldwide success.Pokémon GO, released in July 2016 by Niantic Labs, is a game which uses a real world map and the user’s smartphone location to place virtual "pocket monsters" in various locations of the real world. The game’s objective is for the user (called the trainer) to catch all the different
types of Pokémon. If the user is in reach of a Pokémon’s location, they will appear on the map and upon interaction, it will be given the chance to catch the monster. The catching process has an AR component that uses the phone’s camera to place the Pokémon in the real world as shown in figure2.6a.
(a) Pokémon catching AR screen (b) Pokéstop dropping items
Figure 2.6: Some of Pokémon GO’s gameplay mechanics
C H A P T E R 2 . R E L AT E D WO R K
a site with relevant historic / cultural role. Players must go to those locations in order to battle and conquer Gyms from rival teams. Besides being Gyms, cultural and historic sites can play another role in the game, as form of a "Pokéstop", where the trainer can walk to and the site will give them items to progress in the game [21]. Released to critical success, Pokémon GO has the potential of raising public awareness of cultural and historic sites, as it encourages users to move within the site’s location in order to obtain items or battle and, in some cases, it gives a little background information of the site (figure2.6b). Whether this potential will have a great impact or not remains to be studied. Although the game has an AR component, it is more considered a "location-based entertainment" (as discussed by Perlin [10]), as the AR experience is limited to place the Pokemon in the camera’s view when trying to catch it.
Moreover, a research survey made in Switzerland showed, according to Costanza et al. [6], "a trend towards more application-specific projects". Nowadays, there is a wide variety of tools that help the developer building an AR-based prototype in a short period of time and then tune it and turn it into a fully functional application. Exploring the many possibilities that AR-based mobile applications have to offer in benefit of exploring
the vast cultural and historical heritage in a existence is one of the challenges that this dissertation looks to overcome.
C
h
a
p
t
e
r
3
A p p r o a c h
This chapter explains in detail the proposed approach to solve the problem identified in chapter 1. There’s a section that describes the experimental work done before the implementation, that led to the development of a first small prototype and the selection of Unity and Vuforia as the platform and framework for AR features. Next, all of the approach’s implemented components and features are described, along with screenshots illustrating them. Finally, there’s a section that enumerates major drawbacks and how they were overcome, justifying some design choices.
3.1
Introduction
As stated earlier, the proposed approach is based on a smartphone application (app), that takes advantage of the benefits of paper maps and overcomes their limitations, endowing them with dynamic virtual elements and information. Usage is centered (but not limited to) in exploring the paper map and the virtual information displayed on it. A paper map can give a wider depth of detail in various angles, something not easily attainable in a digital map on a small screen and does not rely on a constant data connection.
The user can also turn on a GPS service, running in background on the smartphone, that notifies him of a nearby site that may be interesting, even if the smartphone is on the user’s pocket while touring the area. This gives a great layer of visibility to sites that could go frequently unnoticed. Kuikkaniemi et. al. stated the important role of ubiquitous media technologies in raising public visibility and awareness [14]. Upon launching for the first time, the user will be prompted to download the latest sites’ information and multimedia content. This is done in an effort to reduce data usage to a minimum and not
C H A P T E R 3 . A P P R OAC H
to other cultural and historic heritage sites, in hopes for it to raise the interest of current tourists and captivate new ones to these sites.
As mentioned in section1.1, this dissertation was developed in collaboration with Luís Marques. Luís provided most of the multimedia content and data related to theÁguas Livresaqueduct, built the 3D models in collaboration with GEODRONE1and helped with on-site research arranging visits to the arches over theAlcântaravalley,Mãe de Águaand Patriarcal’s reservoir andLoreto’s underground gallery.
With the data available, drafts for the system and database schema were developed as well as interface mockups. Work in the concept started by conducting some experimental work in the AR field which resulted in a first small prototype. This prototype, that dis-played 3D models of certain points of interest over a paper map, was shown informally to some potential users, who liked the concept and shown interest in further developments. The prototype laid the foundations of the app’s implementation and development.
3.2
Experimental Work
Early before the implementation, some experimental work was done in the AR field of the mobile app to know how the Vuforia framework worked under various conditions. A Lisbon Yellow Bus tour map was used as the base of the image targets. In the end, the Unity platform was chosen for the AR component, over a native Android solution. These tests were done on a Google Nexus 5 smartphone running Android 5.0 Lollipop.
3.2.1 Teapots and multiple image targets
The first phase of testing was to know how Vuforia would handle displaying multiple objects when various image targets were on the camera’s range. For this test, each image target had a 3D teapot model assigned to the origin of the axes, located on the center of the target. The map was sectioned in three different levels of depth of image targets:
• The first level was the whole map itself consisting of a single image target.
• The second level was the map split into four image targets, each one containing a quarter of the first level’s target.
• The third level further split the map, with each image target containing a quarter of the second level’s targets. This level had 16 image targets in total.
These 21 images were then uploaded to Vuforia’s Target Manager2, a tool used by the
framework to create and manage target datasets, by identifying image features to be used for recognition and placement of virtual objects. Each picture had a maximum file size of 2MB, a limit imposed by the Target Manager and was 2500 pixels wide.
1http://www.geodrone.pt/
2https://developer.vuforia.com/target-manager
3 . 2 . E X P E R I M E N TA L WO R K
As mentioned in section2.3.1, Vuforia can track up to five targets simultaneously, so how would it behave when more are present on the map? Furthermore, how can Vuforia handle overlapped image targets, if some are a fraction of another present on camera’s field of view? Upon pointing the camera to specific regions and then to the whole map, it was clear that Vuforia had no trouble in handling overlapped images, but only displayed 5 teapots corresponding to the 5 most frequent image targets that it recognized (see figure 3.1). As there is no specific order of detection and a way to filter the different targets
associated to the levels of depth puts a great amount of processing on the device, with little benefits, the idea of levels of depth was abandoned. Furthermore, splitting the map into different image targets, in an attempt to obtain a faster recognition, revealed to be
more troublesome than advantageous further down the road, as stated in section3.4.
Figure 3.1: First tests: multiple overlapped image target recognition using Vuforia
3.2.2 Model positioning and displaying
The next step was to position and display some models, other than the generic teapot, on the map. One goal was to position a previously georeferenced model in the map. This can be easily done if the corners of the image targets are also georeferenced and the model is built centered on the origin of the X and Z axes. Vuforia uses a local coordinate system for each target expressed in units that can be equal or different than the image’s original
width, with the origin of this system located on the center of the image. This means that, for example, the coordinates of a point located on the bottom-left of the image target will be negative on both axes. With all that taken into account, converting the global coordinates to the target’s local coordinates can be done in a simple process.
C H A P T E R 3 . A P P R OAC H
Although this type of conversion can be swiftly done for vertices, the same cannot be said for textures as the process of merging all texture files into one and reassigning them to their polygon may vary from model to model. The results were not very satisfactory, as because of redundant information of some more detailed models (such as the ones that were built initially using quads) extra processing power was required, draining the battery at alarming rates and slowing down the performance, even though the tested models had a low polygon count. Adding to that, the extra work required to adapt the texture on the models could take too much of development time. Vuforia’s documentation on placing 3D models on Android SDK is very poor, unlike its Unity extension counterpart. Search for an alternative was a necessity.
Provided that Unity gives full support out of the box for most common 3D models file types, including Collada, OBJ and FBX and direct export to Android and iOS devices, a test with the Vuforia extension was run on that platform. And not only the models were successfully imported, they displayed correctly and no massive battery drain or slowdowns caused by extra processing were verified.
At this point, development switched from native Android to the Unity platform, com-ing up with a small prototype (see figure3.2) that, when pointed to a Lisbon Yellow Bus plan, displays 3D models of some important Lisbon buildings. This small prototype was the foundation of the AR component of the mobile app.
Figure 3.2:Campo Pequeno3D model (4161 polygons) displayed over a Lisbon Map
3.3
System description
This section describes in detail the system, with each subsections focusing on its major components. The last subsection explains in detail the webserver. Due to some issues that arose during the development, the smartphone app had to be split into two, that communicate with each other. The reason for this split is explained in section3.4. Hence-forth, for the rest of this document each app will have a distinct name, introduced in their respective subsection, and the whole system will be dubbedAqueduct.
3 . 3 . S YS T E M D E S C R I P T I O N
3.3.1 Augmented Paper Map
The AR component of the system is an app, dubbedAqueduct AR, that relies on a paper map recognized using the Vuforia AR framework powered by the Unity platform. The "Official Lisbon Plan" (figure3.3) was used as the base map. A portion of the map was
inserted in the Vuforia Target Manager. Although the paper map version used is from 2016, due to great similarities with the 2014 and 2015 maps, these versions are also rec-ognized, though not immediately, and therefore can also be used. Vuforia takes less than 10 seconds to recognize these versions, provided there exists good lighting conditions.
Figure 3.3: 2016 edition of the Official Lisbon Plan paper map
The lit portion of the map was used as the Image Target, although due to big similarities the top left area of the map also displays virtual objects when viewed with the app
Upon recognition, the app places various virtual 3D objects on the map. Elements may be filtered on the interface according to their type. Figure3.4depicts the user interface. The user can view on the map:
• 3D representations of real sites related to theÁguas Livresaqueduct system, which can be inspected in detail upon touch (detail view, as seen in figure3.6d). Additional content can be accessed as seen in subsection3.3.2. 3D models have an orange base / overlay in order to better distinguish them from the map, being that some also have an orange wall when they’re against another building’s wall.
C H A P T E R 3 . A P P R OAC H
Figure 3.4: Overview of the camera view, with the cartography, pathway, 3D models and location marker on the map
Description of the interface: 1. Flash toggle, 2. Close map view, 3. Cartography toggle, 4. Pathway toggle, 5. Pathway settings, 6. DTM toggle (offin the image), 7. 3D/2D mode
switch, 8. Location marker
aqueduct arches, reservoirs, fountains and a special type of fountains that were displaced from their original position (figure3.6c).
In detail view (after touching one of the sites), the user can rotate and pinch to zoom the model in order to inspect it and look at its details (figure3.6d). Another detail view was experimented: instead of taking the user to a different screen, where
he could manipulate the model, the selected model would grow larger over the map (hiding the others in the process) and then the user could inspect it, by approaching the smartphone and rotate the paper map or view from a different angle. This type
of detail view wasn’t appealing to the users in the early evaluation and as such, was scrapped. More information can be found on chapter4.
• Pathway of the aqueduct’s network, where the user can highlight the underground, surface or visitable paths (figure3.6b) or view an animation (image sequence) of the water flow. Three different colors are used: pink for the aqueduct’s main pathway,
blue for the pathway ramifications (galleries) and orange for the parts selected by the user. This is an example of a selective view of elements that cover vast areas of the map and how AR can be used to visualize hidden infrastructures [29].
• A 19th century cartography of Lisbon (figures3.5and3.6a), made by portuguese mathematician General Filipe Folque, where we can see the rapid expansion that the city underwent since the aqueduct was built. Touching the cartography will take the user to a view, where he can navigate it as a digital map. This represents an
3 . 3 . S YS T E M D E S C R I P T I O N
example of overlapping different map layouts, with different content and possibly
from different time periods.
Figure 3.5: Part of Lisbon’s downtown in Filipe Folque’s cartography
• A Digital Terrain Model (DTM) of the city of Lisbon, colored in a 10 meter range elevation quota, where the user can better understand the aqueduct’s pathway in relation to the terrain with a 3D representation of the pathway. The DTM can be opaque (figure3.6e), allowing only the surface parts of the pathway to be visible or translucent (figure3.6f), where the underground parts and the map are visible too.
• If the user is within the map’s boundaries, a marker is placed on the paper mark indicating the user’s current location, assisting in retrieving contextual spatial infor-mation (be it printed or overlaid), such as nearest historic sites. This is possible by matching the global location coordinates with the Image Target’s local coordinate system [3].
User preference of which elements should be present on the map is stored between app usages. The user can also manually focus the camera, by touching anywhere on the screen, that isn’t a button or a virtual object and turn on the smartphone’s flashlight (if available) to help the exploration in low light conditions.
3.3.2 Multimedia Content
Multimedia content and the location-aware service (section3.3.3) are in a separate app calledAqueduct GPS. This app can be launched from Aqueduct AR directly to the se-lected element, or standalone. It allows the user to browse a list of cultural / historic sites, including the ones that aren’t present on Aqueduct AR as they lack a 3D representation (figure 3.7b). Each site has a small text description that emphasizes its building date, historic role and eventual changes that it suffered. Information is available in Portuguese
C H A P T E R 3 . A P P R OAC H
(a) 3D models and cartography overlapped on the map
(b) Underground pathway highlighted (blink-ing in orange)
(c) Displaced fountains highlighted (blinking in yellow)
(d)Janelas Verdesfountain in detail view
(e) Opaque DTM, allowing only the surface pathway to be visible
(f) DTM with transparency, making the under-ground pathway visible
Figure 3.6: Various screenshots of the Augmented Reality features of Aqueduct AR In figure3.6d, top right buttons takes the user to the fountain’s multimedia content view or back into the paper map camera view.
3 . 3 . S YS T E M D E S C R I P T I O N
may be accompanied by pictures (historic and recent, as seen in figure3.7e), videos and a 3D representation (as seen in subsection3.3.1), when available. Regarding cultural sites that require a fee for visiting and / or have a specific opening schedule, that information is also provided (figure3.7d). Multimedia content is available through a web server. This allows the continued addition of updated information, multimedia content and even the addition of new sites. The system is designed to be used on situations where an immedi-ate data connection may not be available (be that because of no network coverage, lack of WiFi hotspots or very limited data plan like in roaming networks). For that reason, data is cached locally and the user can always update the contents on demand. Further details on the web server will be described in subsection3.3.4. Finally, a digital map with all site locations and pathway was added after user feedback from early evaluations (see figure 3.7cand chapter4).
3.3.3 Location-aware service
Aside placing a marker on the paper map, Aqueduct GPS has a notification service that the user can activate, called "Near me". This service triggers a notification when the current location falls within a site’s 150 meter radius, even if the phone is in the user’s pocket. That notification, when touched, can provide more information or start a navigation app that directs the user towards the site (figure3.7f). Location is calculated using the smartphone built-in GPS sensors which are more appropriate for wide areas [5]. "Near me" is an effort to minimize the overlook of less known sites on a normal sightseeing trip
(for example, a user might be notified about an underground gallery of the aqueduct, that passes under the street he’s currently in, and view photographs of that site).
3.3.4 Content web server
The web server is a very simple content hub, where the latest information and multimedia contents are stored. Aqueduct GPS downloads such data from the webserver via a REST API, that communicates with a MySQL database, whose diagram can be seen in figure 3.8.
REST API is implemented through PHP, which executes specific database queries and returns data processed in a JSON file format, that in turn, will be parsed by the app. Given the prototype nature of this implementation, no backend interface was developed (data must be inserted into the database manually and files must be uploaded through FTP) and only the necessary API calls were implemented. However, both the database structure and the API implementation are flexible, giving the possibility to be easily extended. Calls implemented are as follows:
• GET places.php- Lists all cultural and historic sites available, their type,
C H A P T E R 3 . A P P R OAC H
(a) Drawer menu of the multi-media & GPS app
(b) List of sites with their type (c) Digital map
(d) Text and visits views (e) Picture gallery (f) Notification of the "Near me" GPS service
Figure 3.7: Screenshots of some of the multimedia and location features of Aqueduct GPS Figure 3.7dshows an historic description of the Mãe de Água’s reservoir, as well infor-mation about fees and opening schedule. Touching on the marine floating button will take the user to Aqueduct AR, where he can see the 3D representation in detail. This button is only available when such representation exists. The blue button will center the digital map on the site’s location if it’s a building or will show the whole extension of the pathway if it’s an underground gallery.
3 . 4 . OV E R C O M I N G D R AW BAC K S
Figure 3.8: Database diagram
• GET files.php- Lists all multimedia files available for download. Used by the app
file downloader.
• GET multimedia.php?type=TYPE - Lists all multimedia content available that is
linked to a specific cultural and historic site and their caption (if available), in all available languages. This call in particular has a mandatoryTYPEparameter that
returns the list associated to that type. As there were only two types of files available, two API calls were implemented:
GET multimedia.php?type=photo- Returns a list of all pictures available.
GET multimedia.php?type=video- Returns a list of all videos available.
• GET visitables.php- Lists schedule and price information about all cultural and
historic sites that are open to visits.
• GET pathways.php- Special API that returns a set of coordinates for each specific
pathway of the aqueduct system. Used internally by the app for digital map and GPS service.
3.4
Overcoming drawbacks
C H A P T E R 3 . A P P R OAC H
3.4.1 Digital Terrain Model issues
The DTM was provided in an ARCGIS format, which has no direct conversion to a format supported by Unity. The only 3D formats that ARCGIS allowed to export the DTM were Collada and VRML. With Unity only supporting the first, it seemed to be the most direct approach, but as the DTM had too much information, ARCGIS would just abort the conversion due to "out of memory" errors. Many attempts were made with different
elevation intervals (5, 10 and 20 meters), all returning fruitless results and taking up too much time offdevelopment. An alternate export method was needed. Upon research,
it was found that Blender3 had an extension, that allowed imports of models in the VRML format4. After some trial and error, a DTM with a 10 meter elevation interval in
a VRML format was successfully exported and afterwards imported to Blender. It was now possible to export the terrain model in a format supported by Unity. As the pathway dataset (in Google Earth’s KML format) didn’t have any elevation data, it couldn’t be used for displaying the pathway underground and at surface. As such, the 3D pathway had to be done from scratch, based on the KML data, and adapted to the DTM, giving an approximate overview to the reality.
3.4.2 3D Models
The original provided 3D models had a high polygon count (one of the highest having almost 214000 polygons) and weren’t centered in the origin of the 3D axes. Although the high polygon count meant more depth of detail, it weighted on the app’s size and performance, as Aqueduct AR took over 150MB of space and performed very poorly on mid-range smartphones, to the point of closing unexpectedly due to "out of memory" errors. Such depth of detail isn’t needed for the propose of displaying the model on a paper map, but would be wise to maintain a acceptable degree of quality for the detail view, as reducing it drastically would defeat the propose of this view. Also, not being centered in the origin of the 3D axes caused the touch rotation to be rather clunky, with the model rotating in orbit of an invisible axis rather than on itself. All models were, one by one, centered to the origin and had their polygon count greatly reduced to a degree where they were very lighter, but only lost a negligible level of quality. This process was done with Autodesk Maya5. After this, the biggest model in terms of polygon count had just over 47000 polygons, enabling the app to run smoothly even on mid-range smartphones. Figure3.9shows a comparison between the original model of theEsperança fountain and a lighter version of the same model, with less than a quarter of its original number of polygons.
3https://www.blender.org/
4https://sourceforge.net/projects/vrml97import/ 5http://www.autodesk.com/products/maya
3 . 4 . OV E R C O M I N G D R AW BAC K S
(a) 33716 polygons (b) 7969 polygons
Figure 3.9: In-app comparison between the original model of theEsperançafountain (3.9a) and the cut model (3.9b)
3.4.3 Splitting the app
Initially, the implementation was to be done only in one app, which eventually became Aqueduct AR. The detailed model view had the description and multimedia features inte-grated in the interface mockup, as shown in figure3.10. As the development progressed, the GUI tools provided by Unity didn’t allow the creation of a good looking interface, without time-consuming design from scratch. As such, an alternative was sought and it came in form of an embedded HTML5 webview, that could emulate a solid and less time-consuming interface. However, performance of the webview in Unity turned out to be poor with great slowdowns, even when it was the only element present on screen, rendering it practically unusable. Parallel to this problem, was the issue of integrating the GPS service with Aqueduct AR. As Unity is a game-oriented platform, it has no na-tive support for some system-specific features such as Android services. In this case, the tailored code must be built on the native Android SDK (e.g. Android Studio) and then exported in the form of a Java plugin to Unity [33]. The plugin was made, exported and integrated but, for an unknown reason, neither the service or the debug worked (which was complex to do, as two different programming languages were being used). At this
point, and given the prototype nature of this implementation, putting the multimedia content and the GPS service in a standalone native Android app seemed to be a more fea-sible solution in terms of time-consumption and easiness of development. Aqueduct AR and the multimedia / GPS app (initially dubbed the "native" app, due to being developed using the native Android SDK and later, Aqueduct GPS) communicate with each other via system messages (Intents) and the fast transition between each other revealed to be the most viable solution for the sake of time constraints. This is the main reason for the existence of two apps that depend on each other instead of a single one.
3.4.4 Various Image Targets vs. Single Image Target
C H A P T E R 3 . A P P R OAC H
Figure 3.10: Interface mockup of the detail view before the app split
effort to allow the usage of more features for faster recognition, the area where the virtual
objects were to be placed was sectioned into 4 separate image targets, each corresponding to a quadrant of the area. Although 3D models of sites were put on their corresponding image target, putting the cartography, pathway and the DTM on the map presented a problem as they covered all four targets. Placing these elements in one of the 4 targets, or sectioning into the 4 targets seemed both a viable solution, until they were experimented with the actual paper map. In the first case, the cartography and the pathway became distorted outside the image target’s area, while on the second case the section cutting points were clearly visible. Overlapping a fifth image target covering the whole area was tested, but it yielded poor results as it slowed the recognition of the image targets. As a single image target was the viable solution for the virtual objects that covered all the map’s area, all 3D models that remained on the sectioned targets were moved to the single target that covered the whole area and the sectioned targets were removed from Vuforia’s dataset. Testing of the single image target approach yielded some interesting results. Even though the image inserted on the Vuforia Target Manager had theoretically less features (as it was an image of the whole area with just 2500 pixels wide as opposed to 4 quarters of the same area but each 2500 pixels wide, due to Vuforia’s limitations), this single image target was recognized very much faster, even in very low light conditions. With these positive results in mind and the simplification for placing the larger virtual objects, a single image target approach was adopted, also allowing for a simple placement on the map of marker identifying the user’s location, a feature added late in development.
3.5
Conclusion
This chapter described Aqueduct, the proposed approach, and presented its features, technical details and the drawbacks that arose during its development, justifying some of the design choices that were made. The app was submitted to various user evaluation moments as seen in the next chapter.
C
h
a
p
t
e
r
4
E va l u a t i o n
Evaluation by potential users is an important role in a new kind of approach, as it has a crucial part deciding whether the concept is on the right direction or needs to be rethought. This chapter details the three evaluation moments that Aqueduct underwent: one during its development, other after the end where it was compared to other heritage-related apps and finally a real on-site situation usage. User feedback is presented and analyzed in detail.
4.1
Early Evaluation
During the development, an early evaluation was conducted in order to understand user reaction to this concept and their preferences. Some features were not yet available (like the DTM) or were still being finalized (GPS service, which wasn’t tested on-site). For this purpose, two different applications were used: one that uses the paper map in
combi-nation with the smartphone (Aqueduct, the proposed approach, consisting of Aqueduct AR and Aqueduct GPS) and another that only uses the smartphone with a digital map software (henceforth called Aqueduct Digital). Except for the 3D representation on the map (replaced by markers), this version has the same features of Aqueduct. Figure4.1 depicts the main screen of Aqueduct Digital. Two types of 3D model detail views were tested for the AR app of Aqueduct, in order to know which one appealed more.
This user study was conduced with 15 voluntary users (6 male and 9 female) with ages between 21 and 78 years ( ¯x= 45,σ = 19.53).
4.1.1 Methodology
C H A P T E R 4 . E VA LUAT I O N
Figure 4.1: Main screen of Aqueduct Digital showing the pathway, cartography and the sites represented by markers
per approach. A within-subject experimental design was used to test the two different
approaches and the sequence of use of the different apps (Aqueduct, Aqueduct Digital)
was counterbalanced to minimize learning effects.
The set of tasks consisted in choosing sites, inspecting their 3D representations and associated information, viewing the aqueduct system pathway in order to understand the connection between the different sites and finally observing the 19th century cartography
overlapped with the current map. At the end of each test session, users were asked to answer a questionnaire to evaluate their experience with the apps.
The questionnaire started by asking users’ age and gender. Next, users were asked to rate a set of statements for each one of the two apps, using a five-point Likert-type scale, which ranged from disagree (1) to agree (5). Then, users were asked about which variant of the app they would prefer in different situations. Finally, users could express
any further suggestions and comments.
4.1.2 Results
Regarding the overall features (figure4.2), users generally agreed that overlapping the pathway helped them to understand the connection between places ( ¯x= 4.47,σ = 0.52) and they found the possibility of overlapping historic cartography on the map interesting ( ¯x= 4.6,σ = 0.63).
When compared to Aqueduct (figure 4.3), users found that Aqueduct Digital was easier to use ( ¯x = 4.47 of Digital vs. ¯x = 4.13 of the proposed approach, with bothσ
4 . 1 . E A R LY E VA LUAT I O N
4,27 4,47 4,40 4,20 4,47 4,60 4,73
0,70 0,64 0,74 0,77 0,52 0,63 0,59
0 1 2 3 4 5
S1 S2 a. S2 b. S2 c. S3 S4 S5
Ra
ti
n
g
Statements
Mean Standard DeviationFigure 4.2: Early evaluation: questionnaire results of Likert-type scale statements
Table 4.1: Statement label key for figure4.2chart
Statements
S1 Multimedia information associated with each site helps to understand its historic role
S2 The indication of the following information associated with a historic site is helpful:
a. Location b. Opening hours c. Visiting price
S3 Viewing the pathway on the map helps you understand the connection between the various locations
S4 The possibility of overlapping historical cartography on the map is inter-esting
S5 3D representations of the sites on the map are an added value
= 0.64). Some users, of different ages, had difficulty using Aqueduct AR, mainly with
choosing the correct button to activate the different pathway view options and with the
![Figure 2.2: Azuma’s [2] conceptual diagram of an optical HMD](https://thumb-eu.123doks.com/thumbv2/123dok_br/16532025.736337/26.892.220.681.781.1022/figure-azuma-s-conceptual-diagram-optical-hmd.webp)
![Figure 2.3: Azuma’s [2] conceptual diagram of a video HMD](https://thumb-eu.123doks.com/thumbv2/123dok_br/16532025.736337/27.892.208.682.456.713/figure-azuma-s-conceptual-diagram-of-video-hmd.webp)