www.IJoFCS.org
FORENSIC COMPUTER SCIENCE
Abstract - Model order selection (MOS) schemes, which are frequently employed in several signal processing applications, are shown to be effective tools for the detection of malicious activities in honeypot data. In this paper, we extend previous results by proposing an efficient and parallel MOS method for blind automatic malicious activity detection in distributed honeypots. Our proposed scheme does not require any previous information on attacks or human intervention. We model network traffic data as signals and noise and then apply modified signal processing methods. However, differently from the previous centralized solutions, we propose that the data colected by each honeypot node be processed by nodes in a cluster (that may consist of the collection nodes themselves) and then grouped to obtain the final results. This is achieved by having each node locally compute the Eigenvalue Decomposition (EVD) to its own sample correlation matrix (obtained from the honeypot data) and transmit the resulting eigenvalues to a central node, where the global eigenvalues and final model order are computed. The model order computed from the global eigenvalues through RADOI represents the number of malicious activities detected in the analysed data. The feasibility of the proposed approach is demonstrated through simulation experiments. (6)
Keywords - Intrusion Detection, Honeypot, Model Order Selection, Principal Component Analysis.
A Parallel Approach to PCA Based Malicious Activity
Detection in Distributed Honeypot Data
Bernardo Machado David
(1), João Paulo C. L. da Costa
(2),
Anderson C. A. Nascimento
(3), Marcelo D. Holtz
(4), Dino Amaral
(5),
Rafael Timóteo de Sousa Júnior
(6)Department of Electrical Engineering University of Brasilia (UnB)
(1) [email protected] (2) [email protected],
(3) [email protected] (4) [email protected] (5) [email protected] (6) [email protected]
URL: www.ppgee.unb.br
(6) This is an extended version of the paper Blind Automatic Detection of Malicious Activities in Honeypot Data that appeared in ICOFCS 2011 [1]
I. IntroductIon
The Problem. A honeypot system collects
malicious traffic and general information on malicious activities directed towards the net-work where it is located [2]. It serves both as data source for intrusion detection systems as well as a decoy for slowing down automated at-tacks [3], [4]. Efficient algorithms for identifying malicious activities in honeypot data are par-ticularly useful in network management statis-tics generation, intelligent intrusion prevention systems and network administration in general as administrators can take actions to protect the network based on the results obtained [5]. Even though honeypots provide a reliable and representative source for identifying attacks and threats [6], they potentially produce huge volumes of complex traffic and activity logs making their efficient and automated analysis quite a challenge. The problem of processing such data is further aggravated in distributed settings, where data is collected from multiple nodes in multiple network portions.
Previous Works: Several methods have been proposed for identifying and characterizing malicious activities in honeypot traffic data based on a variety of approaches and techniques [7], [8], [9]. Classical methods typically employ data mining [8], [9] and text file parsing [7] for detecting patterns which indicate the presence of specific attacks in the analysed traffic and computing general statistical data on the collected traffic. These methods depend on previous knowledge of the attacks which are going to be identified and on the collection of significant quantities of logs in order to work properly.
Recently, machine learning techniques have also been applied to honeypot data analysis and attack detection [10] yielding interesting results as such techniques are able to identify malicious activities without relying on previously provided malicious traffic patterns and attack signatures. However, it is necessary to run several analysis cycles during a learning period in order to
train the system to recognize certain attacks. Although such methods are efficient, they are computationally expensive. Furthermore, if the legitimate traffic patterns are altered by any natural causes, machine learning based methods may yield a significant number of false positives, identifying honest connections as malicious activities. These systems are also prone to failure in not detecting attacks which were not included in the learning process or whose traffic resembles honest patterns.
Principal component analysis (PCA) based methods [11], [12] came on to the scene as a promising alternative to traditional techniques. PCA based methods identify the main groups of highly correlated indicators (i.e. principal components) which represent outstanding malicious activities in network traffic data collected at honeypots. Such methods are based on the clever observation that attack traffic patterns are more correlated than regular network traffic. Since they solely rely on statistical analysis of the collected data, these methods need not to be provided with previous information on the attacks to be detected neither need to be trained to recognize attacks and separate them from legitimate traffic. This characteristic makes PCA based honeypot data analysis methods suitable for automatic attack detection and traffic analysis. However, current PCA based methods [11], [12] still require human intervention, rendering them impractical for automatic analysis and prone to errors such as false positives.
Our Contributions: We propose a method
for automatically identifying attacks in low interaction honeypot network traffic data based on state-of-the-art model order selection schemes [13], [14]. Our method can also be implemented in cluster environments using parallel processing in order to achieve higher efficiency and scalability. In order to obtain this result we present the following contributions:
high-ly correlated components as significant network activities (in this case, malicious activities).
• It is possible to identify malicious activi-ties in honeypot network flow datasets without any previous information or at-tack signatures by applying model order selection schemes.
• We adapt RADOI to successfully identify the main attacks contained in the simu-lation data set, efficiently distinguishing outstanding malicious activities from noise such as backscatter and broadcast packets.
• A technique to distribute RADOI compu-tation across a cluster of worker nodes that may consists of the honeypot nodes themselves, allowing for a significative in-crease in efficiency and scalability of our malicious activity detection system.
While blind malicious detection schemes in the literature [12], [11] require human inspection to detect malicious activities. In this paper, we obtain a blind automatic detection method without the need of any human intervention by using model order selection schemes. More generally, our method is an intrusion detection system which does not require previous knowledge of attack signatures and might find interesting applications in contexts other than honeypot systems.
According to recent results [15], it is possible to obtain high efficiency in distributed network data colelction and processing in the MapReduce framework by having each node running a network sensor process its own collected data. Our results show that model order selection (specifically RADOI) can be applied in such scenario, where each honeypot node processes its collected data, which is subsequently aggregated in order to obtain final comprehensive detection results. Hence, our method is an efficient and scalable alternative for high traffic load distributed honeypot scenarios.
Roadmap. The remainder of this paper is
organized as follows. In Section II, we define the notation used in this paper. In Section III, we formally introduce the concept of honeypots, discuss classical analysis methods and present an analysis of related work on PCA based methods for honeypot data analysis. In Section IV, we describe the dataset preprocessing method through which we transform the data before Model Order Selection (MOS). In Section V, we introduce classical MOS and also state-of-the-art schemes and propose our analysis method based on RADOI. In Section VI, we evaluate several MOS schemes in experiments with real data, presenting experimental results which attest the validity of our approach. In Section VII, we finally conclude with a summary of our results and direction for future research..
II. notatIon
Throughout the paper scalars are denoted by
italic letters , vectors by
lower-case bold-face letters (a, b) and matrices by bold-face capitals . Lower-order parts are consistently named: the (i, k)-element of the matrix is denoted as . We denote by diag( ) the diagonal vector of a matrix . The element-wise productorial of vectors is denoted by . Concatenation between two elements α and b is
denote by α|b.
We use the superscripts T
and-1 for
transposi-tion and matrix inversion, respectively.
III. related Works
In this section, we introduce the concept of honeypot systems and discuss the several methods used for obtain and analysing data in such systems. Special attention is given to methods based on principal component analysis, which are the focus of our results.
unauthorized or illicit use of that resource [2], although various definitions exist for specific cases and applications. Honeypot systems are designed to attract the attention of malicious users in order to be actively targeted and probed by potential attackers, differently from intrusion detection systems (IDS) or firewalls, which protect the network against adversaries. Generally, network honeypot systems contain certain vulnerabilities and services which are commonly targeted by automated attack methods and malicious users, capturing data and logs regarding the attacks directed at them. Data collected at honeypot systems, such as traffic captures and operating system logs, is analyzed in order to gain information about attack techniques, general threat tendencies and exploits. It is assumed that traffic and activities directed at such systems are malicious, since they have no production value nor run any legitimate service accessed by regular users. Because of this characteristic (inherent to honeypot systems) the amount of data captured is significantly reduced in comparison to network IDSs which capture and analyze as much network traffic as possible.
Network honeypot systems are generally di-vided into two categories depending on their lev-el of interaction with potential attackers: Low and High interaction honeypots. Being the simplest of network honeypots, the Low Interaction variant simply emulates specific operating systems TCP/ IP protocol stacks and common network services, aiming at deceiving malicious users and auto-mated attack tools [16]. Moreover, this type of honeypot has limited interaction with other hosts in the network, reducing the risks of compromis-ing network security as a whole if an attacker successfully bypasses the isolation mechanisms implemented in the emulated services. High in-teraction honeypots are increasingly complex, running real operating systems and full imple-mentations of common services with which a ma-licious user may fully interact inside sandboxes and isolation mechanisms in general. This type of honeypot captures more details concerning the malicious activities performed by an attacker,
enabling analysis systems to exactly determine the vulnerabilities which were exploited, the at-tack techniques utilized and the malicious code executed.
Depending on the type of honeypot system deployed and the specific network set up, honeypots prove effective for a series of applications. Since those systems concentrate and attract malicious traffic, they can be used as decoys for slowing down or completely rendering ineffective automated attacks, as network intrusion detection systems and as a data source for identifying emergent threats and tendencies in the received malicious activity [3]. In the present work, we focus on identifying the principal malicious activities performed against a low interaction network honeypot system. Such a method for malicious activity identification may be applied in different scenarios, e.g. network intrusion detection.
A. Data Collection
Among other logs which may provide interesting information about an attacker's action, low interaction honeypots usually collect information regarding the network connections originated and directed at them, outputting network flow logs. These log files represent the basic elements which describe a connection, namely: timestamp, protocol, connection status (starting or ending), source IP, source port, destination IP and destination port. The following line illustrates the traffic log format of a popular low interaction honeypot system implementation [17]:
B. Data Analysis Methods
Various methods for honeypot data analysis with different objectives have been developed in order to accompany the increasing size of current honeypot systems, which are being deployed in progressively larger settings, comprising several different nodes and entire honeynets (networks of decoy hosts) distributed among different sites [6]. Most of the proposed analysis techniques are focused on processing traffic captures and malicious artefacts (e.g. exploit binaries and files) collected at the honeypot hosts [7]. Packet capture files, from which it is possible to extract network flow information (representing network traffic received and originated at the honeypot), provide both statistical data on threats and the necessary data for identifying intrusion attempts and attacks [18].
Classical methods for analysis of honeypot network traffic capture files rely on traffic pattern identification through file parsing with standard Unix tools and custom made scripts [16]. Basically, these methods consist of direct analysis of plain-text data or transferring the collected data to databases, where relevant statistical information is then extracted with custom queries. Such methods are commonly applied for obtaining aggregate data regarding traffic, but may prove inefficient for large volumes of data. Recently, distributed methods based on cloud infrastructure have been proposed for traffic data aggregation and analysis [19], efficiently delivering the aggregated traffic information needed as input for further analysis by other techniques.
In order to extract relevant information from sheer quantities of logs and collected data, data mining methods are applied to honeypot data analysis, specifically looking for abnormal activity and discovery of tendencies detection among regular traffic (i.e. noise). The clustering algorithm DBSCAN is applied in [9] to group packets captured in a honeypot system, distinguishing malicious traffic from normal traffic. Multiple series data mining is used to analyze aggregated network flow data in [8] in
order to identify abnormal traffic features and anomalies in large scale environments. However, both methods require previous collection of large volumes of data and do not efficiently extract relevant statistics regarding the attacks targeting the honeypot with adequate accuracy.
A network flow analysis method based on the MapReduce cloud computing framework and capable of handling large volumes of data was proposed in [19] as a scalable alternative to traditional traffic analysis techniques. Large improvements in flow statistics computation time are achieved by this solution, since it distributes both processing loads and storage space. The proposed method is easily scalable, achieving the throughput needed to efficiently handle the sheer volumes of data collected in current networks (or honeypots), which present increasingly high traffic loads.This method may be applied to honeypot data analysis, providing general statistical data on the attack trends and types of threats.
C. Methods based on Principal Component Analysis
Basically, the model order of a dataset is estimated as the number of main uncorrelated components with energy significantly higher than the rest of components. In other words, the model order can be characterized by a power gap between the main components. In the context of network traffic, the principal components are represented by outstanding network activities, such as highly correlated network connections which have, for example, the same destination port. In this case, the principal components represent the outstanding groups of malicious activities or attacks directed at the honeypot system and the model order represents the number of such attacks. The efficacy and efficiency of PCA based methods depend on the MOS schemes adopted, since each scheme has different probabilities of detection for different kinds of data (depending on the kind of noise and statistical distribution of the data itself) [14].
A method for characterizing malicious activi-ties in honeypot traffic data through principal component analysis techniques was introduced in [11]. This method consists in mainly two steps, dataset preprocessing and visual inspec-tion of the eigenvalues profile of the covariance matrix of the preprocessed honeypot traffic samples in order to obtain the number of prin-cipal components (which indicate the outstand-ing groups of malicious activities), i.e. the model order. First, raw traffic captures are parsed in order to obtain network flows consisting of the basic IP flow data, namely the five-tuple con-taining the key fields: source address, destina-tion address, source port, destinadestina-tion port, and protocol type. Packets received or sent during a given time slot (300 seconds in the presented experiments) which have the same key field val-ues are grouped together in order to form these network flows. The preprocessing step includes further aggregation of network flow data, ob-taining what the authors define as activity flows, which consist of combining the newly generated flows based upon the source IP address of the attacker with a maximum of sixty minutes inter-arrival time between basic connection flows. In
the principal component analysis step, the pre-processed data is denoted by the p-dimensional
vector representing the network
flow data for each time slot. First, the network flow data obtained after the preprocessing is transformed into zero mean and unitary vari-ance with the following equation:
(1)
for , where is the sample mean and
is the sample variance for . Then the sample correlation matrix of C is obtained with the following expression:
(2)
After obtaining the eigenvalues of the basic network flow dataset correlation matrix
R
, the number of principal components is obtained via visual inspection of the screen plot of eigenvalues in descending order. The estimation of the model order by visual inspection is performed by following subjective criteria such as considering only the eigenvalues greater than one and visually identifying a large gap between two consecutive eigenvalues.including visual inspection of the eigenvalues screen plot.
Even though those methods are computa-tionally efficient, they are extremely prone to error, since the model order selection schemes (through which the principal components are determined) are based on subjective parameters which require visual inspection and human in-tervention. Apart from introducing uncertainties and errors, the requirement for human interven-tion also makes it impossible to implement such methods as an independent automatic analysis system. Thus these PCA based analysis methods are impractical for large networks, where the vol-ume of collected data is continuously growing. Moreover, the uncertainty introduced by subjec-tive human assistance is unacceptable, since it may generate a significant number of false posi-tive detections.
IV. applyIng Model order selectIon to
Honeypot data analysIs
Our method for MOS based honeypot data analysis bascially consists in applying state of the art MOS schemes to identify principal components of pre-processed aggregated network flow datasets. Each principal component represents a malicious activity and the number of such principal components (obtained through MOS) represents the number of malicious activities. In case this number is equal to zero, no malicious activity is present and in case it is greater than zero, there is malicious activity. Our objective in this paper is to automatically estimate the number of principal components (i.e. model order) of network flow datasets collected by honeypots. In this section, we introduce our method in details and the steps of data pre-processing necessary before model order selection is performed on the final dataset.
It has been observed that the traffic generated by outstanding malicious activities targeting honeypot systems has significantly higher volumes than regular traffic and is also highly
correlated, being distinguishable from random traffic and background noise [11]. Due to these characteristics it is viable to apply model order selection schemes to identify the number of principal components which represent malicious activities in network traffic captured by honeypot systems. Assuming that all traffic directed to network honeypot systems is malicious (i.e. generated by attempts of intrusion or malicious activities), outstanding highly correlated traffic patterns indicate individual malicious activities. Hence, each principal component detected in a dataset containing information on the network traffic represents an individual malicious activity. Analysing such principal components is an efficient way to estimate the number of different hostile activities targeting the honeypot system and characterizing them.
In order to estimate the number of principal components (i.e. malicious activities) the application of model order selection schemes arises naturally as an efficient method. After an appropriate preprocessing of the raw network traffic capture data, it is possible to estimate the model order of the dataset thus obtaining the number of malicious activities. The preprocessing is necessary in order to aggregate similar connections and network flows generated by a given malicious activity. It is observed that, after applying the preprocessing described in the previous section, groups of network flows pertaining to the same activity (e.g. groups which represent connections to and from the destination and source ports, respectively) have high correlated traffic profiles, yielding only one principal component. Thus, hostile activities which generate multiple connections are correctly detected as a single activity and not several different events.
Our method consists in applying RADOI with noise pre-whitening, a state-of-the-art
automatic model order selection scheme
RADOI with noise pre-whitening was determined to be the most efficient method for performing model order selection of this type of datasets through experiments with real honeypot data where several classical and state-of-the-art MOS schemes were evaluated (refer to Section VII for the results).
Since it is generally assumed that all traffic received by network honeypot systems is malicious, the model order obtained reflects the number of significant malicious activities present in the collected traffic, which are characterized by highly correlated and outstanding traffic. In our approach, the model order d obtained after applying the MOS scheme is considered as the number of malicious activities detected and the d highest dataset covariance matrix eigenvalues obtained represent the detected malicious activities. Further analysis of these eigenvalues enables other algorithms or analysts to determine exactly which ports were targeted by the detected attacks [12].
A. Data Pre-Processing Model
Before performing model order selection on the collected dataset it is necessary to transform it in order to obtain aggregate network flow data which represents the total connections per port and transport layer protocol. The proposed pre-processing method considers an input of network flow data extracted directly from log files gener-ated by specific honeypot implementations (e.g. honeyd [17]) or from previously parsed and ag-gregated raw packet capture data (such parsing may be easily performed via existing methods [11]). It is possible to efficiently implement this preprocessing method based on a cloud infra-structure, providing nice scalability for large vol-umes of data [19]. Network flow data is defined as lines which represent the basic IP connection tuple for each connection originated or received by the honeypot system, containing the follow-ing fields: time stamp, transport layer protocol, connection status (starting or ending), source IP address, source port, destination IP address and destination port.
First, the original dataset is divided into n time slots according to the time stamp information of each network flow (n is chosen according to the selected time slot size). Subsequently the total connections directed to each m destination ports targeted during each time slot are summed up. We consider that the total connections to a certain destination port m during a certain time slot n is represented as follows:
(3)
where is the measured data in the
port, is the component related to the outstanding malicious activities and
is the noise component, mainly consisting of random connections and broadcasts sent to port m. Note that in case that no significant malicious activity is present, the traffic is mostly composed of port scans, broadcasts and other random non-malicious network activities, for instance. Therefore, the noise presentation fits well in (3).
In the matrix form, we can rewrite (3) as
(4)
Where is the total number of
con-nections directed to ports during time slots. Particularly, if a certain port has not been targeted by outstanding malicious activities, the line of is fulled with zeros. On the other hand, if a certain host is responsible for a malicious activity resulting in connections to ports, these ports have a malicious traffic highly correlated. Therefore, math-ematically, is given by
(5)
to-tal number of principal components, represent-ing the total number of outstandrepresent-ing malicious activities detected in the honeypot dataset.
In order to represent the correlated traffic of the malicious traffic, we assume the following model
(6)
where represents totally uncorrelated traffic and is the correlation matrix between the ports. Note that if the correlation is not extremely high, the model order represents the sum of the number of uncorrelated malicious activities of all hosts which interacted with the honeypot environment. Therefore, the model order is at least equal to the total number of malicious hosts.
The correlation matrix of defined in (4) is computed as
(7)
where is the expected value operator and is valid for zero mean white noise, where is the variance of the noise samples in (3). Note that we assume that the network flows generated by outstanding malicious activities are uncorrelated with the rest of traffic.
V. Model order selectIon scHeMes
Several model order selection schemes exist, each of them with different characteristics which may affect their efficacy when applied to network traffic data. In this section, we present an overview of model order selection schemes and propose the necessary modifications in order to apply those schemes to malicious activity identification in honeypot data.
Usually, model order selection techniques are evaluated by comparing the Probability of Correct Detection or PoD (i.e. the probability of correctly detecting the number of principal components of a given dataset) of each technique
for the type of data that is being analysed, since the different statistical distributions, noise and characteristics of specific datasets may alter the functioning and accuracy of different MOS schemes [14]. In other words, it is necessary to evaluate different MOS schemes with different characteristics in order to determine which MOS scheme is better suited for detecting malicious activities in honeypot network flow data. In this sense, we propose methods based on different schemes and evaluate them in the experiments presented in the next section.
In Subsection V-A, we show a brief review of the Akaike's Information Criterion (AIC) [20], [13] and Minimum Description Length (MDL) [20], [13], which are classical MOS methods, serving as a standard for comparing and evaluating novel MOS techniques and applications. Since RADOI [21] is one of the most robust model order selection schemes mainly for scenarios with colored noise, we propose the RADOI together with a noise prewhitening scheme in Subsection V-B.
Considering data preprocessed with the procedures described in the previous section, our method proceeds to performing model order selection of the dataset obtained. Similarly to [11], we also apply the zero mean in the measured sample. Therefore,
(8)
where the vector has all temporal sam-ples of network flows directed to the port is the mean value, and contains the zero mean temporal samples. Such procedure is ap-plied for each group of network flows directed to a single port in order to obtain . By applying (8), the assumption that the samples have zero mean is fulfilled.
(9)
where is an estimate of . In contrast to [11], we do not apply the unitary variance reviewed in (1), since the variance, which is the power of the components, is an useful information for the adopted model order selection schemes.
The eigenvalue decomposition of is given by
(10)
where is a diagonal matrix with the eigenvalues
with and the matrix
has the eigenvectors. However, for our model order selection schemes, only the eigenvalues are necessary.
A. 1-D AIC and 1-D MDL
In AIC, MDL and Efficient Detection Criterion (EDC) [22], the information criterion is a function of the geometric mean, , and arithmetic mean, , of the smallest eigenvalues of (10) respectively, and is a candidate value for the model order .
In [23], we have shown modifications of AIC
and MDL for the case that , which we
have denoted by and . These
techniques can be written in the following general form
(11)
where represents an estimate of the model order . The penalty functions for and
are given by and
respectively.
Accor-ding to [13] , while according to
[23], we should use , and .
B. RADOI with Noise Prewhitening
The RADOI model order selection scheme is an empirical approach [21]. Here we propose to incorporate the noise prewhitening to the RADOI scheme in order to improve its performance. In order to apply the noise prewhitening, first
samples containing only noise traffic are collected. Such noise samples can be obtained from ports where no significant malicious activities are observed. In practice, we can select the ports with lowest traffic rates (i.e. ports which received an insignificant number connections during the time span observed, for example, less than 1 connection per minute). By using the noise samples, we compute an estimate of the noise correlation matrix
(12)
where contains the zero mean noise
samples computed similarly as in (8). With , the noise prewhitening matrix can be computed by applying the Cholesky decomposition
(13)
where is full rank.
The noise prewhitening of is given by
(14)
We compute the eigenvalues of the
covariance matrix of and we apply them on the RADOI cost function, which is given by
where (15)
(16)
where
and is given by
(17)
[25] in the presence of colored noise, while its performance in the presence of white noise is similar to the GDE criterion.
VI. IMproVIng perforMance
In parallel enVIronMentsThe previous pre-processing and MOS analysis methods are fit for small and medium sized environments with few honeypot systems collecting data and consequently generating moderate quantities of network flow data for subsequent analysis. However, in current enterprise network environments, it is often necessary to set up many honeypot systems distributed across different network portions in order to capture all relevant activities. In such an environment, the quantities of data generated may increase exponentially and overwhelm centralized data analysis solutions. In order to construct a scalable honeypot data analysis system, a promising approach consists in applying parallel processing techniques that distribute data analysis across several computer nodes that concurrently perform the necessary computation, thus increasing system velocity and capacity.
A trivial method to parallelize our techniques consists in aggregating the data collected by different honeypot systems at a central location and then distributing slices of data to individual computer nodes, that then run our analysis algorithms (pre-processing and MOS schemes) on their assigned data. The results are then aggregated at a central node. An analogous alternative is simply using parallel algorithms to compute the pre-processing and MOS scheme operations on the centralized data, distributing the computation (as opposed to data) to the computer nodes in a cluster. However, both of these direct approaches have a common shortcoming. In both cases, it is necessary to first transfer vast amounts of data to a central location in the network in order to start the analysis and then redistributed this data to the
cluster nodes, which adds a huge communication overhead to the overall solution while degrading performance. Formally, we consider that the total quantity of data collected by honeypots in the network is given by:
(18)
where is the data matrix of the node. In this approach, the node transmits its by data matrix to the central node. Therefore, a data overhead of is foreseen. Note that usually . The central node then computes the eigenvalues of the sample covariance matrix .
Fortunately, it is possible to build on characteristics of our data model and the underlying MOS schemes to perform distributed analysis of the collected data without having to transfer it between different nodes. We propose instead an architecture where each node locally computes the eigenvalue decomposition of the sample covariance matrix corresponding to its locally collected data. The nodes then transmit only the diagonal vector of the resulting eigenvalue matrix to a central node, which aggregates the individual eigenvalue and estimate the model order of the full datatset employing global eigenvalue techniques [26], [23], [27]. A similar approach for locally processing network data in collection nodes is also presented in [15], where the authors adapt the MapReduce framework to enable nodes to perform local computation on their local data and then aggregate the result, instead of transfering data to a central local that then redistributes it to the worker nodes. Apart from improving network performance, this technique also results in a larger gap between eigenvalues, increasing overall probability of detection, making it more efficient in detecting attacks and less prone to false negatives.
for . In the end of the collection period of time slots, each node then computes the sample covariance matrix for its locally collected data . Notice that, at this point, the trivial next step would be for each node to simply send its sample covariance matrix to a central node that would perform the remaining steps in estimating the model order.
(19)
where is the sample covariance matrix of . In this case, since the sample covariance matrix is transmitted the data overhead is . Note that mathematically we obtain the same eigenvalues via (18) or via (19). Therefore, (19) should be preferentially used due to the reduced overhead. On the other hand, we avoid the ex-cessive data transfers by requiring that each node computes the eigenvalue decomposition of , obtaining the eigenvalue matrix . Fi-nally, each node transfers only the diagonal ei-genvalue vector , instead of the complete sample covariance matrix . The central node then aggregates each individual eigenvalue vec-tor into a global eigenvalues vector , which is used to estimate model order through RADOI. is obtained as follows:
(20)
Notice that in this approach, each node is only required to transfer vectors of real numbers representing the eigenvalues. If the full data ma-trix or the local sample covariance mama-trix were transmitted, it would be necessary to transfer or real number values, respectively. This represents a factor or a factor decrease in the total size of transmitted data, in compari-son to transmitting the full data matrix or the local sample covariance matrix, respectively. No-tice that even if N increases, meaning that the resolution is increased with more samples being taken for each time period, the size of the
trans-mitted data is the same. In practice, it means that the local resolution of each sensor does not affect the total quantity of data that needs to be transmitted for the central node for analysis.
VII. sIMulatIons
In this section, we describe a series of experi-ments that were performed in order to validate our proposed scheme for detection of malicious activities in honeypot network traffic. Through-out this section we consider a dataset collected at a large real world honeypot installation. First, in Subsection VII-B, we manually determine the number of attacks in the experimental dataset and then analyse the data preprocessing mod-el. In Subsection VII-C, we compare the perfor-mance of several model order selection schemes presented in Section V, determining that RADOI with zero mean and noise pre-whitening is the most efficient and accurate method for analys-ing such data.
A. Experimental Environment
In the experiments presented in this section we consider a dataset containing network flow information collected by a large real world honeyd virtual network honeypot installation. The reader is referred to [14], [13] in order to check the performance of the MOS schemes for simulated data. Extensive simulation campaigns are performed in [14], [13].
Among other monitoring and management re-lated data, honeyd automatically generates net-work activity logs in the form of netnet-work flow data as described in Section III-A. A dataset comprised of such network flow logs is analysed in the fol-lowing experiments. For experimental purposes, the data preprocessing model and the different model order selection schemes were numerically implemented, providing accurate results. How-ever, the issues of efficiency [28], [29] and scal-ability [19] for large volumes of data are not ad-dressed, which is left as subject for future works.
Figure 1: Traffic over different ports vs time slots. Each time slot spans 10 minutes. The total amount of ports and the total amount of time slots are 29 and 37, respectively.
B. Data model fitting based on collected data It is necessary to manually analyse the experi-mental dataset in order to obtain an accurate es-timate of the number of attacks that it contains. Notice that this manual analysis is not part of the proposed method, which is completely auto-matic. The results obtained in this analysis are merely utilized as a reference value to be com-pared with the results obtained by the different MOS schemes in the process of validating our automatic results.
Besides the number of connections per port, this manual analysis takes into consideration common knowledge on which services are most-ly targeted in such attacks. First, we are inter-ested in obtaining summarized information on the total number of connections per port. Thus, we evaluate our proposed data preprocessing model, obtaining a preprocessed summarized dataset from the original network flow data.
A time slot of 10 minutes is considered, with data collection starting at at 2007-08-02-13:51:59 and spanning approximately 370 min-utes (or 37 slots). During the data collection pe-riod considered, network activities targeting 29 different TCP and UDP ports were observed, thus yielding a preprocessed data matrix
with different ports and time
slots, representing the total number of connec-tions directed to or originated from the ports during each of the time slots. In Fig. 1, the preprocessed data matrix is depicted, provid-ing graphical information on the traffic profiles. Although it is not possible to distinguish all curves, notice that some ports have outstand-ingly higher traffic while the traffic profile per-taining to the rest of the ports are close to zero, behaving akin to noise. Thus, we show that some traffic profile curves are significantly higher than others due to the attacks directed at them. Once again note that this is not part of the blind auto-matic method proposed, serving only as a refer-ence for our experiments.
According to Fig. 1, the traffic profiles of some ports clearly indicate malicious activities and attacks. By manually analysing the collected network flow data and visually inspecting the traffic plot, it is possible to determine that a threshold of more than an average of 100 con-nections per 10 minutes time slots to a certain port during the observed time span indicates malicious activities. Traffic profiles of less than an average of 100 connections per 10 minutes to a given port (or 0.17 connections per sec-ond) are considerably less than the number of connections to the highly attacked ports, being considered noise and not indicating significant malicious activities. Therefore, we conclude that outstanding malicious activities are observed on
ports , that in Fig. 1
respec-tively correspond to the following ports: TCP 1080, TCP 445, TCP 1433, TCP 135, TCP 8555, TCP 23293, and TCP 17850.
the same connections respectively. Therefore, their traffic profiles are almost identical, i.e., highly correlated. The ports TCP 445 and TCP 8555 are also destination and source ports for a certain group of connections, as well as the ports TCP 1433 and TCP 17850. The destination ports of the pairs described before along with TCP port 1080 are typically opened by common-ly probed and attacked services, which explains the intense activity observed and confirms the hypothesis that the traffic directed to those ports actually represents malicious activities.
Although a high level of network activity is observed in 7 different ports, 3 pairs have very highly correlated patterns and for this reason can be considered as only 3 main components (representing 3 different significant malicious activities which, in this case, are easily identifiable as attacks to services commonly present in popular operating systems and network equipment). Hence, given the traffic profile in Fig. 1 we conclude that the model order for the dataset being analysed in the following experiments is equal to 4, since it is the number of malicious activities or attacks identified after manually analysing network data.
In Fig. 2, the traffic profile of all ports which received or originated less than an average of 100 connections per time slot is depicted. Notice that, once again, it is not possible to distinguish the traffic profiles but this figure clearly shows that traffic not generated by attacks behaves like random noise. Thus, the traffic in those ports is considered noise (generated by broadcast messages, faulty applications and other random causes) and we consider, therefore, that it does not characterize malicious activities. This analysis is not part of the method proposed, serving only as reference for analysing our experiments.
Based on the data model presented in Section IV, the data shown in Fig. 2 is that of the noise
components represented by matrix .
Note that since and m= 1, 2, 7, 8, 12, 15, 20 , the zero padding matrix described
in (5) which indicates the ports with outstanding
malicious activities has only for the
following values of (i, k) = {(1,1), (2,2) (7,3),
(8,4), (12,5), (15,6) (20,7)}, otherwise, .
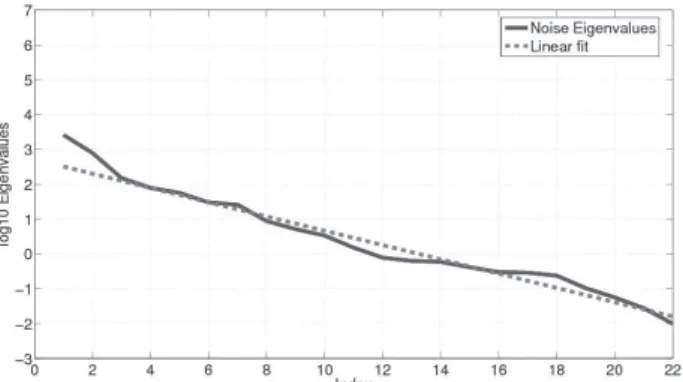
Figure 2: Noise traffic over ports vs time slots ( and ). This traffic profile represents noise which does not indicate significant malicious activities.
We now compute the eigenvalues of the
cova-riance matrix of obtained from the preprocessed
dataset depicted in Fig. 1 and the eigenvalues
of the covariance matrix of obtained from the
noise only components of the preprocessed
da-taset depicted in Fig. 2. The eigenvalue profiles
of the covariance matrices obtained from the full
preprocessed dataset and the noise only
compo-nents of are depicted in Fig. 3 and in Fig. 4,
re-spectively. Comparing both eigenvalues profiles
in log scale, the eigenvalues in Fig. 4 which do
not represent malicious activities fit much better
to the linear curve than the eigenvalues which
indicate outstanding malicious activities.1 In
ad-dition, by visual inspection, it is possible to
esti-mate the model order in the malicious traffic in
Fig. 3, which is clearly equal to 4 (as indicated
by the break up in the linear eigenvalues profile,
which behaves as a super-exponential profile).
Figure 3: Malicious activity traffic plus noise eigenvalues profile compared to the linear fit. Plot of the logarithm base 10 of the eigenvalues vs the index of the eigenvalues.
The total of eigenvalues is . The
covariance matrix is computed via obtained from the complete preprocessed dataset shown in Fig. 1.
After analysing the eigenvalue profile in Fig 3, the raw collected honeypot network activity logs and the traffic profiles obtained in the preprocessed dataset it is possible to consistently estimate the model order as 4. While the traffic profile and the network activity logs indicate a high level of network activity in certain ports, further analysis of the collected data confirms that the connections to such ports pertain to 4 significant malicious activities, since the 4 destination ports targeted are typically used by commonly probed and attacked services. Furthermore, the break up in the eigenvalue profile of the covariance matrix obtained from the full preprocessed dataset also indicates that the model order is 4. Therefore, we conclude that the model order of the dataset used for the experiments proposed in this section is equal to 4, and consider this value as the correct model order for evaluating the accuracy of the several MOS schemes tested in the remainder of this section.
As shown in this subsection, it may be possible to estimate the model order by visual inspection, manually determining the amount of malicious activities present in the dataset. Note that it was necessary to correlate raw collected network data, traffic profiles and information on common attacks in order to verify the correctness of the estimated model order. However, by visual inspection, the model order estimation becomes
subjective, i.e., the model order of a same eigenvalue profile may vary for each person who inspects it, introducing an unacceptable uncertainty in the malicious activity identification process. Since the PoD of human dependent MOS schemes varies uncontrollably, it is impossible to guarantee a minimal probability of correctly detecting attacks and an average false positive percentage. Moreover, for real time applications and scenarios involving large quantities of data, it is necessary to employ an automatic scheme to estimate the model order.
Figure 4: Noise only eigenvalues profile compared to the linear fit. The total of eigenvalues is
. The covariance matrix is computed via obtained from the noise only preprocessed dataset shown in Fig. 2.
C. Model order selection on the preprocessed dataset
In several scenarios it is not possible to visually identify the malicious traffic. However, in our data, this is possible. Therefore, in Section VII-B, we estimate the amount of malicious traffic, i.e., the model order, through human intervention. Once the model order is known for our measured data from Section VII-B, we can apply our model order selection schemes presented in Section V. In this section, we verify the performance of these model order selection schemes, determining that RADOI with zero mean and noise pre-whitening is the most efficient and accurate method for analysing such data.
negative values, which have no physical meaning but affect the PoD of several MOS schemes. The effect on the eigenvalues profile is almost insig-nificant when comparing the pure preprocessed dataset to the dataset after the application of zero mean. However, the accuracy of the model order selection schemes may vary when the zero mean is applied, even though it is insignificant for visual inspection purposes.
Note that the eigenvalues profiles obtained for the noise only and full dataset cases after applying the zero mean have similar character-istics to the eigenvalues profiles obtained for the preprocessed data before applying the zero mean, in the sense that the eigenvalues which do not represent malicious activities fit much better to the linear curve than the eigenvalues which indicate outstanding malicious activities. Moreover, it is also possible to clearly estimate the model order as 4 by visual inspection of the signal plus noise eigenvalues profile after zero mean.
Having preprocessed the original network flow dataset, applied the zero mean in the noise only dataset and applied the zero mean in the full dataset, we now proceed to actually estimat-ing the model order of the original dataset. In order to evaluate each MOS scheme the model orders of both the full dataset (containing both noise and outstanding traffic) and the noise only dataset are estimated. In these experiments we estimate the model order using the following MOS schemes: 1-D AIC [20], [13], 1-D MDL [20], [13], efficient detection criterion (EDC) [22], Na-dakuditi Edelman Model Order selection scheme (NEMO) [24], Stein's unbiased risk estimate (SURE) [32], RADOI [21] and KN [33].
Finally, the model order of the complete da-taset after applying the zero mean is estimated, yielding the results shown in Table I.
Table 1: Model order selection via the eigenvalues of the covariance matrix of the signal plus noise samples.
AIC MDL EDC SURE RADOI RADOI
w/ PKT KN NEMO
21 21 13 11 3 4 11 13
In Table I, note that RADOI with prewhiten-ing returns the correct estimation of the model order while the other MOS schemes fail. In other words, RADOI correctly detects the number of attacks in the analysed dataset. These results validate our assumption that RADOI can suc-cessfully detect attacks in network traffic flow data obtained in honeypot systems, since it cor-rectly estimates the model order as the number of attacks present in the dataset. Hence, we con-clude that RADOI has the best performance in real world honeypot network flow data analysis via PCA.
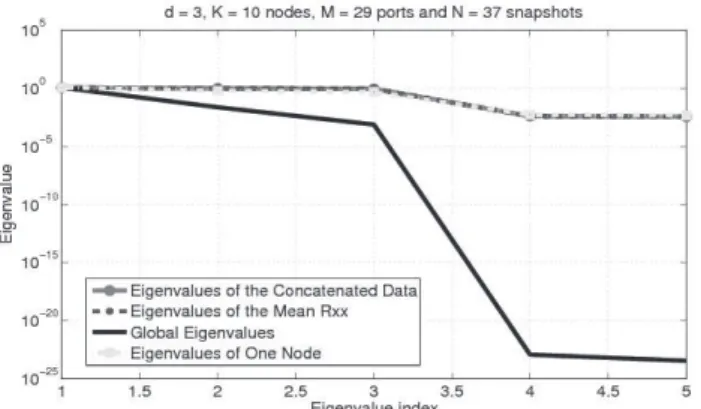
D. Simulating the Parallel Processing Approach In order to validate the approach for estimat-ing the model order of the analysis dataset par-allely as described in Section VI, simulation ex-periments were performed. These exex-periments show that the threshold between eigenvalues in-creases as expected, while the total data transfer dramatically decreases. In these experiments we compare the global eigenvalues profile obtained by the parallel method described in the previous section with the eigenvalue profiles obtained by three trivial approaches for distributed honeypot data model order estimation. We consider a
sce-nario with nodes, model order and
traffic to ports collected over 10 minute time slots. The signal and noise samples are i.i.d. zero mean Gaussian and the SNR is de-fined as
(21)
obtained from the sample covariance matrix of only one node.
Notice that the fourth curve, which represents the global eigenvalues profile obtained according to (19), displays a much more significant gap between the signal and noise eigenvalues. The gap in Figure 5 is significantly bigger than the gap observed in Figure 3. Such a contrast shows that, besides increasing performance and scalability for large environments, our parallel detection approach also improves the probability of detection.
Figure 5: Comparison between global eigenvalues profile and eigenvalue profiles from different approaches with K = 10 nodes, model order d = 3 and traffic to M = 29 ports collected over NG = 37 10 minute time slots.
VIII. conclusIons
In this paper we present a blind automatic method for detecting malicious activities and attacks in network traffic flow data collected at honeypot systems. First we propose a dataset preprocessing model for network flow data obtained by many honeypot systems and we verify the validity of our approach through simulation results with real log files collected at a honeypot system in operation at the network of a large banking institution. Several model order selection methods are experimented with the preprocessed simulation data, showing that RADOI yields the best results for this type of data.
The presented methods are further improved by utilizing a model order selection parallelization
approach that distributes computational load between nodes in a cluster. In this case, the raw tcp flow data is distributed among cluster nodes, which then locally apply the EVD to the sample covariance matrix of their assigned portions of data. The diagonal vector of the eigenvalues matrix is transmitted to a central node where the global eigenvalues are computed and the model order is estimated based on RADOI. This approach also allows for local data processing in the data collection nodes, eliminating the need for a dedicated cluster and increasing efficiency, since only the obtained eigenvalues have to be transmitted to a central node.
Honeypot traffic flow data behaves like measurements in signal processing, in the sense that if the traffic in honeypots does not represent significant attacks, the eigenvalues of the covariance matrix of the traffic samples have an exponential profile, linear in log scale. On the other hand, if connections are highly correlated (indicating significant malicious activities), a break appears in the exponential curve of the eigenvalues profile of the traffic samples covariance matrix. This break in the exponential curve profile indicates the model order which, in this case, represents the number of significant malicious activities observed in the honeypot data. The principal components and eigenvalues obtained can also be further analysed for identifying the exact attacks which they represent depending on which ports they are related to.
out further experimentation with other model order selection schemes in order to obtain an attack detection method that yields correct results even when malicious activities are not present in the analysed dataset (i.e. yield model order equal to zero).
Acknowledgements
The research presented in this paper was conducted under a grant from DELL Computers of Brazil under the agreement 001/2010.
References
[1] B. M. David, J. P. C. L. da Costa, A. C. A. Nascimento, D. Amaral, M.D. Holtz, and R. T. de Sousa Jr., “Blind automatic malicious activity detection in honeypot data,” in The International Conference on Forensic Computer Science (ICoFCS), 2011.
[2] L. Spitzner, “Honeypots: Catching the insider threat,” in Proceedings of the 19th Annual Computer Security Applications Conference, ser. ACSAC ’03. Washington, DC, USA: IEEE Computer Society, 2003,pp. 170–.
[3] Z. Li-juan, “Honeypot-based defense system research and design,” Com-puter Science and Information Technology, International Conference on, vol. 0, pp. 466–468, 2009.
[4] I. Mokube and M. Adams, “Honeypots: concepts, approaches, and challenges,” in Proceedings of the 45th annual southeast regionalconference, ser. ACM-SE 45. New York, NY, USA: ACM, 2007, pp. 321–326. [Online]. Available: http://doi.acm. org/10.1145/1233341.1233399
[5] F. Zhang, S. Zhou, Z. Qin, and J. Liu, “Honeypot: a supplemented active defense system for network security,” in Parallel and Distributed Com-puting, Applications and Technologies, 2003. PDCAT’2003. Proceedings of the Fourth International Conference on, 2003, pp. 231 – 235.
[6] E. Alata, M. Dacier, Y. Deswarte, M. Kaniche, K. Kortchinsky, V. Nicomette, V. H. Pham, and F. Pouget, “Collection and analysis of attack data based on honeypots deployed on the internet,” in Quality of Protection, ser. Advances in Information Security, D. Gollmann, F. Massacci, and A. Yautsiukhin, Eds.Springer US, 2006, vol. 23, pp. 79–91.
[7] F. Raynal, Y. Berthier, P. Biondi, and D. Kaminsky, “Honeypot foren-sics,” in Information Assurance Workshop, 2004. Proceedings from the Fifth Annual IEEE SMC, June 2004, pp. 22 – 29.
[8] W. He, G. Hu, X. Yao, G. Kan, H. Wang, and H. Xiang, “Applying multiple time series data mining to large-scale network traffic analysis, ”in Cybernetics and Intelligent Systems, 2008 IEEE Conference on, September 2008, pp. 394 –399.
[9] A. Ghourabi, T. Abbes, and A. Bouhoula, “Data analyzer based on data mining for honeypot router,” Computer Systems and Applications, ACS/IEEE International Conference on, vol. 0, pp. 1–6, 2010.
[10] Z.-H. Tian, B.-X. Fang, and X.-C. Yun, “An architecture for intrusion detection using honey pot,” in Machine Learning and Cybernetics, 2003 International Conference on, vol. 4, 2003, pp. 2096 – 2100 Vol.4.
[11] S. Almotairi, A. Clark, G. Mohay, and J. Zimmermann, “Characteriza-tion of attackers’ activities in honeypot traffic using principal component analysis,” in Proceedings of the 2008 IFIP International
Conference on Network and Parallel Computing. Washington, DC, USA: IEEE Computer Society, 2008, pp. 147–154.
[12] ——, “A technique for detecting new attacks in low-interaction honeypot traffic,” in Proceedings of the 2009 Fourth International Conference on Internet Monitoring and Protection. Washington, DC, USA: IEEE Computer Society, 2009, pp. 7–13.
[13] J. P. C. L. da Costa, A. Thakre, F. Roemer, and M. Haardt, “Comparison of model order selection techniques for high-resolution parameter estimation algorithms,” in Proc. 54th International Scientific Colloquium (IWK’09), Ilmenau, Germany, Oct. 2009.
[14] J. P. C. L. da Costa, Parameter Estimation Techniques for Multi-dimensional Array Signal Processing, 1st ed. Shaker, 2010.
[15] D. Logothetis, C. Trezzo, K. C. Webb, and K. Yocum, “In-situ mapreduce for log processing,” in Proceedings of the 2011 USENIX conference on USENIX annual technical conference, ser. USENIXATC’11. Berkeley, CA, USA: USENIX Association, 2011, pp. 9–9. [Online]. Available: http://dl.acm.org/citation. cfm?id=2002181.2002190
[16] V. Maheswari and P. E. Sankaranarayanan, “Honeypots: Deployment and data forensic analysis,” in Proceedings of the International Conference on Computational Intelligence and Multimedia Applications (ICCIMA 2007) - Volume 04, ser. ICCIMA ’07. Washington, DC, USA: IEEE Computer Society, 2007, pp. 129–131. [17] N. Provos, “A virtual honeypot framework,” in Proceedings of
the 13th conference on USENIX Security Symposium - Volume 13, ser. SSYM’04. Berkeley, CA, USA: USENIX Association, 2004, pp. 1–1. [Online]. Available: http://portal.acm.org/citation. cfm?id=1251375.1251376
[18] F. Raynal, Y. Berthier, P. Biondi, and D. Kaminsky, “Honeypot forensics part i: Analyzing the network,” IEEE Security and Privacy, vol. 2, pp.72–78, July 2004.
[19] Y. Lee, W. Kang, and H. Son, “An internet traffic analysis method with mapreduce,” in Network Operations and Management Symposium Workshops (NOMS Wksps), 2010 IEEE/IFIP, April 2010, pp. 357 –361.
[20] M. Wax and T. Kailath, “Detection of signals by information theoretic criteria,” IEEE Trans. on Acoustics, Speech, and Signal Processing, vol. ASSP-33, pp. 387–392, 1985.
[21] E. Radoi and A. Quinquis, “A new method for estimating the number of harmonic components in noise with application in high resolution radar,” EURASIP Journal on Applied Signal Processing, pp. 1177– 1188, 2004.
[22] L. C. Zhao, P. R. Krishnaiah, and Z. D. Bai, “On detection of the number of signals in presence of white noise,” J. Multivar. Anal., vol. 20, pp. 1–25, October 1986. [Online]. Available:http://portal.acm. org/citation.cfm?id=9692.9693
[23] J. P. C. L. da Costa, M. Haardt, F. Roemer, and G. Del Galdo, “Enhanced model order estimation using higher-order arrays,” in Proc. 40th Asilomar Conf. on Signals, Systems, and Computers, Pacific Grove, CA, USA, Nov. 2007.
[24] R. R. Nadakuditi and A. Edelman, “Sample eigenvalue based detection of high-dimensional signals in white noise using relatively few samples, ”IEEE Transactions of Signal Processing, vol. 56, pp. 2625–2638, Jul. 2008.
[25] H.-T. Wu, J.-F. Yang, and F.-K. Chen, “Source number estimators using transformed Gerschgorin radii,” IEEE Transactions on Signal Processing, vol. 43, no. 6, pp. 1325–1333, 1995.
[26] J. P. C. L. da Costa, F. Roemer, M. Haardt, and R. T. de Souza Jr., “Multi-dimensional model order selection,” EURASIP Journal on Advances inSignal Processing, vol. 26, 2011.
[27] J. P. C. L. da Costa, M. Haardt, and F. Roemer, “Robust methods based on the HOSVD for estimating the model order in parafac models, in Proc. 5-th IEEE Sensor Array and Multichannel Signal Processing Workshop (SAM 2008), 2008, pp. 510–514.
[29] Y. Hu, “Parallel eigenvalue decomposition for toeplitz and related matrices,” in Acoustics, Speech, and Signal Processing, 1989. ICASSP-89., 1989 International Conference on, May 1989, pp. 1107 –1110 vol.2.
[30] J. Grouffaud, P. Larzabal, and H. Clergeot, “Some properties of ordered eigenvalues of a wishart matrix: application in detection test and model order selection,” in Proceedings of the IEEE International Conference on Acoustics, Speech and Signal Processing (ICASSP’96), vol. 5, May 1996, pp. 2463 – 2466.
[31] A. Quinlan, J. Barbot, P. Larzabal, and M. Haardt, “Model order selec-tion for short data: An exponential ?tting test (EFT),”
EURASIP Journal on Applied Signal Processing, 2007, special Issue on Advances in Subspace-based Techniques for Signal Processing and Communications.
[32] M. O. Ulfarsson and V. Solo, “Rank selection in noisy PCA with SURE and random matrix theory,” in Proc. International Conference on Acoustics, Speech and Signal Processing (ICASSP 2008), Las Vegas, USA, Apr. 2008.
[33] S. Kritchman and B. Nadler, “Determining the number of components in a factor model from limited noisy data,” Chemometrics and Intelligent Laboratory Systems, vol. 94, pp. 19–32, Nov. 2008
Bernardo Machado David is currently pursuing his bachelor degree in Network Engineering at the University of Brasilia. He was an internship student at the NTT Cryptography Research Group between the years of 2011 and 2012. His current interests include coding based cryptography, secure multi-party computation and structure reserving cryptography.
João Paulo Carvalho Lustosa da Costa received the Diploma degree in electronic engineering in 2003 from the Military Institute of Engineering (IME) in Rio de Janeiro, Brazil, his M.S. degree in 2006 from University of Brasília (UnB) in Brazil, and his Doktor-Ingenieur (Ph.D.) degree D with Magna cum Laude in 2010 from Ilmenau University of Technology (TU Ilmenau) in Germany. During his Ph.D. studies, he was a scholarship holder of the National Counsel of Technological and Scientific Development (Conselho Nacional de Desenvolvimento Científico e Tecnológico, CNPq) of the Brazilian Government and also a captain of the Brazilian Army. Currently, he is a professor at the Electrical Engineering Department, University of Brasília (UnB), and he participates in the Laboratory of Technologies for Decision Making (LATITUDE) supported by DELL computers of Brazil. He is co-responsible for the Laboratory of Array Signal Processing (LASP) at UnB. His research interests are in the areas of multi-dimensional array signal processing, model order selection, principal component analysis, MIMO communications systems, parameter estimation schemes, and development of communication solutions and sensors for UAVs.
Anderson C A Nascimento obtained his Ph.D. from the university of Tokyo in 2004. He is currently a professor with the department of Electrical Engineering of the University of Brasilia. Prior to returning to his alma mater, Prof. Nascimento was a research scientist with Nippon Telegraph and Telecom. His research interests are information security, cryptography and information theory.
Dino Macedo Amaral is graduated in Computer Science at Universidade de Brasília (2003) and received his master's degree in Electrical Engineering at Universidade de Brasília (2008). He is Security Analist at Banco do Brasil and currently a PhD student at UnB. His research interests include cloud computing, e-banking, cryptography and network security.