International Business Research; Vol. 6, No. 12; 2013 ISSN 1913-9004 E-ISSN 1913-9012 Published by Canadian Center of Science and Education
17
China Inward FDI and Chinese Exports to High-Income Countries
(HICs): A Historical Perspective Based on Bibliometric Method
Eurico Brilhante Dias1 & Kristina Makalengva1 1Business Research Unit, ISCTE-Lisbon University Institute, Lisbon, Portugal
Correspondence: Eurico Brilhante Dias, ISCTE-Lisbon University Institute, Avenida das Forças Armadas, cac. 301, 1649-026, Lisbon, Portugal. Tel: 351-21-7903412. E-mail: eurico.dias@iscte.pt
Received: October 14, 2013 Accepted: October 25, 2013 Online Published: November 22, 2013 doi: 10.5539/ibr.v6n12p17 URL: http://dx.doi.org/10.5539/ibr.v6n12p17
Abstract
PR China is capturing FDI mainly from the overseas Chinese territories and from High-Income Countries (HICs); this last group is also the most important Chinese export-market. Adopting an inductive methodology, based on the bibliometric method, our purpose is the understanding of which were the determinants that led to attract inward FDI and, later, to increase exports from PR China to HICs. Taking into account the time frame 1980–2010, 367 different publications were collected. Using the ISI Web of Science and the HistCite Software 10 research papers were the basis for a bibliometric diagram (LCS > or equal to 5). From this diagram was possible to extract two main streams: economic reforms toward an inward FDI attraction and world exports leadership; and inward FDI—mainly from HICs—led to an increasing value of the exports basket. A third issue emerged also, not as a stream, but as an important conclusion based on the Gilboy (2004) paper, published on
Foreign Affairs: foreign companies dominate high-tech industries and a lion’s part of Chinese industrial exports.
PR China has reached the world exporting ranking leadership based on economic reforms, focused on the attraction of FDI export driven, which had on companies from HICs a major contribution.
Keywords: inward FDI, Chinese economic reforms, exports, bibliometric method 1. Introduction
People’s Republic of China (PR China), since the end of the last decade, has become the largest exporter in the World (World Bank, 2012; Economist Intelligence Unit, 2012). A remarkable leadership, based on a rising trend, which begun in the late 70’s of the last century. Several authors relate this leadership with three main issues: economic reforms since 1978, with Deng Xiaoping Communist Party of China (CPC) leadership; an economic policy toward foreign direct investment (FDI) attraction; and, an exporting oriented policy.
A sustainable growth, where FDI, exports and economic development were (are) “mutually reinforcing under the open-door policy” (Liu, Burridge & Sinclair, 2002); an economic growth which has been leveraged by the inputs expansion (Krugman, 1994)—capital and labor—which gives to FDI attraction an important role in the last 30 years of the Chinese economy history (Dunning, 2003). Additionally, as it was mentioned by Markusen (1995), among others, these new resources were focused, and used, to serve not only the domestic Chinese market, but mainly foreign demand, as part of global or international value chains (vertical FDI—Buckley, Clegg & Wang, 2002).
Thus, this context has been the focus, and was under the spotlight, of several economic and international business researchers. PR China became a field of research, where FDI attraction determinants, exporting oriented policies, the impact of economic reforms or the Chinese WTO membership, were topics discussed, and the academic community and some practioners have given awareness to the key factors that led this country to a long and steady growth uptrend. Following this common work, where many researchers have made their contribution, and based on the bibliometric method, Fetscherin et al. (2010) have published a research paper where defined four research streams related with FDI into PR China, considering the time range between 1980 and 2010; a time range which considers the impacts of economic reforms made by the CPC under Deng Xiaoping leadership which led, as we have mentioned before, to a huge increase of inward FDI and exports from PR China to all over the world, but mainly to high-income countries (HICs)(Note 1)(World Bank, 2012).
www.ccsenet.org/ibr International Business Research Vol. 6, No. 12; 2013
multinational enterprise (MNE); (3) the impact of MNE activities; and, (4) policy implications for the host country (PR China)” (Fetscherin et al., 2010). Nevertheless, one of these streams, the first one, can be followed, and it is our main research purpose. It is important to add knowledge doing the link between these motives and determinants of FDI and Chinese exports to HICs, with special focus on European Union (EU) countries, which are an important origin of inward FDI and are, at same time, as a group of countries, the most important Chinese trade partner (the Chinese first client market—a unique tariff trade area).
Taking into account 2010 data, and PR China and EU, in the end of the range period studied by Fetscherin, Voss and Gugler (2010), the NOI—Net Outward Investment—ratio was clearly higher than one, and considering the FDI stock, the same ratio has as result a figure higher than ten. Nevertheless, if the FDI flow direction was mainly from EU countries to PR China, the trade flows have more volume from PR China to EU. In 2010 EU has faced a huge trade deficit in the bilateral balance with PR China: more than 156,000 million euros, with an export/import ratio below 0.5 (EUROSTAT, 2011).
Considering our purpose, we have defined as objective the understanding which were the determinants would lead to attract inward FDI and, later, to increase exports from PR China to HICs. An inductive methodology is going to be applied, using the bibliometric method, trying to develop historical streams, relating concepts and research findings within the time period since 1980 until 2010, and giving awareness to the path taken in this field by the Chinese economy.
2. 30 Years of Reforms toward a Global Leadership 1980–2010
2.1 Economic Reforms, Inward FDI and Exports
Several authors, in last decades, have embraced this task: how political and economic reforms were critical issues in order to attract FDI? and, how FDI was related with a vertical approach, where investors were looking for new resources—e.g., labor—in order to export, mainly, manufacturing products to HICs?
Chen, Chang and Zhang (1995) have looked to this topic, relating FDI with Chinese economic development, and, among other conclusions, have highlighted the positive effects perceived, firstly mainly on coastal provinces, and how this positive perception was an important contribution toward a successful political and economic reforms implementation. These authors have given special attention to Deng Xiaoping post-1978 reforms, and underlined how important was the development of Special and Economic Zones (SEZs)—in Guangdong and Fujian provinces. Furthermore, these authors have mentioned the introduction of a law which has created a legal framework to Wholly Owned Subsidiaries (WOS) and moreover a law of FDI encouragement and incentives was approved. Among other reforms, during the 80’s, the joint ventures life-time period was increased and Chinese civil law was changed introducing a new legal framework for foreign-invested enterprises (FIEs) (Chen et al., 1995; Dées, 1998; Cheng & Kwan, 2000; Tuan & Fung-Yee Ng, 2002; 2002a; Sun, Tong & Yu, 2002; Huang, 2003).
Nonetheless, until the mid-1980’s, the inward FDI amount was rather limited (OECD, 2000) and highly concentrated within SEZs. During this period, in the first decade post-1978 reforms, Hong Kong (Note2), Macao (Note 3) and Taiwan were the main FDI source, which was called, among others, by Lardy (1996) as ‘closed-loop’ FDI (or ‘round-tripping’ FDI). Foreign investors were looking to SEZs as places where they were able to add labor-resources, and then export finished products (Naugthon & Lardy, 1996). As we mentioned before, an economic development based on inputs expansion (Krugman, 1994), where foreign capital was merged with the local labor-resources. Thus, Dées (1998) has described the late years of the 1980’s as a period when inward FDI and exports growth rates were facing a sharply increasing trend.
Tuan and Fung-Yee Ng (2002a; 2006) and Whalley and Xin (2006; 2010) have noted a change in the early-1990s; not only a progressive insertion of local companies in global competition (Chen et al., 1995; Wei, 1995; Naugthon & Lardy, 1996; Wei, Liu, Parker & Vaidya, 1999; Zhang & Song, 2000; Zhang & Flemingham, 2001; Zhang, 2005), but also a next (new) generation of reforms (Tuan & Fung-Yee Ng, 2002), reaffirming the open policy, which has led to a diversification of FDI sources, adding to those three overseas Chinese origins (Hong Kong, Macao and Taiwan), other sources, as Europe and United States (Chen, Zhou & Wan, 2000; Tuan & Fung-Yee Ng, 2006).
However, this increasing FDI was located mainly at Special Economic Zones (SEZs), and it was the SEZs expansion which has been the basis where these export-led investments were developed (OECD, 2000; Fujita & Hu, 2001). Chen et al. (2000), nevertheless, have mentioned the Asian Crisis, in the late 1990s, as an event which has impacted on investors’ confidence (Dillip, 2007). Even considering this event, exports were growing in this period; nevertheless, FDI has stopped it raising trend, and decline in the end of the decade (Chen et al.,
www.ccsen 2000; Wor The first d measures nonetheles Subprime domestic s huge decre States are Liu et al. growth and these varia early 1980 growth (G Data Source: Data Source: net.org/ibr rld Bank, 2012 decade of the 2 were adopted ss, since 2008 crisis and, the sources (overs ease in world presented as th (2002) have d trade. These ables, which “ 0’s show a com GDP growth as
World Bank Data
World Bank Data
2). 21 Century wa d. In this dec 8, Chinese ex e sovereign de seas Chinese t trade during t he main reason published a re authors, focus “appear to be mmon evolutio a proxy)—Fig Figure 1. abase. Figu abase. Internationa s PR China be cade PR Chin xports have fa ebt crisis withi territories) as the year of 20 ns for this chan esearch paper sing on the PR mutually rein on pattern amo g. 1 and Fig. 2. GDP growth a
ure 2. FDI inflo
al Business Res 19 ecame WTO m na has becom aced a slowdo in the Euro Cu predominant i 009, and the G nge (Chiu, 200 where is con R China case, h nforcing under
ong these three .
and exports (%
ows and export earch
member, and ad me the first ex own, due the urrency Area. in the time pe GDP slowdown 08; Morrison, 2 ncluded a caus have found a “ r the open-doo e variables: inw %GDP) 1982–2 ts 1982–2010 dditional libera xporter in the uncertainty g Some authors eriod from 200 n in EU count 2009; Overhol sal link betwe “bi-directional or policy”. Th ward FDI, exp
2010 Vol. 6, No. 12; al and transpar e World econ generated afte s, as mentione 08 until 2010. tries and in U lt, 2010). een FDI, econ
casuality” betw he figures sinc
ports and econ 2013 rency omy; r the d the The nited omic ween e the omic
www.ccsenet.org/ibr International Business Research Vol. 6, No. 12; 2013
2.2 Exports Destinations, Imports Origins, Exports Complexity and Inward FDI Sources
In 2012 PR China is the first exporter and the second importer in the world (EIU, 2011; World Bank, 2012). This leading position was reached in 2009—when the Subprime crisis was hitting the World economy—and in 2012 PR China has exported more than 2 trillion USD, and has imported more than 1.7 trillion USD (EIU, 2011; World Bank, 2012). A surplus of 325 billion USD based on an international trade where the United States, Hong Kong, Japan, South Korea and Germany (an EU country) are the most important clients. These countries are OECD countries, classified by the World Bank as HIC’s, and, together, represent 48% of the PR China goods exports. (Table 1)
Table 1. PR China exporting markets (TOP 5)-% of the total-ITC statistics, 2012
Rank Markets 2010 2011 2012
1 United States of America 18.0 17.1 17.2
2 Hong Kong 13.8 14.1 15.8
3 Japan 7.7 7.8 7.4
4 South Korea 4.4 4.4 4.3
5 Germany 4.3 4.0 3.4
Additionally, Chinese providers are also HICs, and the Top 5, in 2012, comprises Japan, South Korea, Taiwan, United Sates and Germany. These set of countries represents 40% of the goods imports into PR China (Table 2). Table 2. PR China importing markets (TOP 5)-% of the total-ITC statistics, 2012
Rank Markets 2010 2011 2012
1 Japan 12.7 11.2 10.2
2 South Korea 9.9 9.3 9.5
3 Taiwan 8.3 7.2 7.6
4 United States of America 7.4 7.1 7.4
5 Germany 5.3 5.3 5.3
In an analysis based on goods exported, we find electrical and electronic equipment (487 billion USD), and machinery and nuclear reactors (376 billion USD) as the most important groups of products sent/sold to foreign markets; nevertheless, apparel products, furniture, and optical and photo equipment—as it is shown in Table 3—are important also, reaching together more than 250 billion USD (ITC Statistics, 2012).
Furthermore, if in the Top 10 of the goods exported we can find mainly industrial goods, when we take a look to imported goods—Table 4—it is important to highlight energy raw materials (minerals fuels, oils and other energy related products), and some other goods, as can be ores, organic chemicals, copper or even oil seed and oleagic fruits, which are mainly raw materials in order to fulfill industrial and manufacturing needs. Nevertheless, electrical and electronic equipment is the group of products which lead the ranking of imported goods Top10 (381 billion dollars—ITC Statistics, 2012).
Taking into account the previous analysis we should stress a major difference among Chinese exports and PR China imports: even if electrical and electronic equipment is leading both Top10, the exporting goods are mainly manufactured and among importing goods we can find raw materials or other agriculture products. Considering this issue we can identify intra-industry trade, but also an inter-industry trade based on labor abundance in China and a lack of resources—mainly energy and other raw materials—in order to feed or supply the local industry. It is also important to underline the main industrial sectors in which foreign companies are investing. Taking into account UNCTAD (2012) data, the most important industrial FDI receptors are the following four sectors: ‘Chemicals and Chemicals Products’, ‘Machinery and Equipment’, ‘Electrical and Electronic Equipment’ and ‘Motor Vehicles and Other Transport Equipment’. These industrial sectors are also exporting sectors; this element can be indicting a link between inward FDI and PR China exports.
www.ccsenet.org/ibr International Business Research Vol. 6, No. 12; 2013
21
Table 3. PR China exporting goods (TOP 10)-thousand USD-ITC statistics, 2012
Rank Sector 2010 2011 2012
1 Electrical, electronic equipment 388,755,010 445,756,705 487,462,307
2 Machinery, nuclear reactors, boilers, etc 309,813,672 353,763,873 376,002,094
3 Articles of apparel, accessories, knit or crochet 66,710,933 80,164,561 87,059,741
4 Furniture, lighting, signs, prefabricated buildings 50,584,032 59,336,352 77,904,042
5 Optical, photo, technical, medical, etc apparatus 52,109,780 60,684,983 72,816,793
6 Articles of apparel, accessories, not knit or crochet 54,361,478 63,073,873 61,237,963
7 Articles of iron or steel 39,143,621 51,196,168 56,202,059
8 Plastics and articles thereof 34,696,577 45,420,906 55,218,364
9 Vehicles other than railway, tramway 38,397,962 49,539,445 55,174,251
10 Footwear, gaiters and the like, parts thereof 35,633,851 41,722,333 46,817,564
Table 4. PR China importing goods (TOP 10)-thousand USD-ITC statistics, 2012
Rank Sector 2010 2011 2012
1 Electrical, electronic equipment 314,282,498 350,954,252 381,597,419
2 Mineral fuels, oils, distillation products, etc 188,965,812 275,766,337 311,857,463
3 Machinery, nuclear reactors, boilers, etc 172,150,025 199,313,752 181,912,452
4 Ores, slag and ash 109,386,524 150,655,638 133,685,768
5 Optical, photo, technical, medical, etc apparatus 89,919,369 99,140,733 106,369,794
6 Vehicles other than railway, tramway 49,504,235 65,438,574 70,612,733
7 Plastics and articles thereof 63,704,657 70,198,652 69,486,436
8 Organic chemicals 48,263,067 63,131,991 60,921,639
9 Copper and articles thereof 46,183,467 54,251,470 54,607,290
10 Oil seed, oleagic fruits, grain, seed, fruit, etc 27,061,892 32,020,530 38,550,840
Table 5. Inward FDI sources (TOP 10)-% of the total-UNCTAD, 2012
Rank Country/Origin 2012
1 Hong Kong 63.8
2 Japan 6.6
3 Singapore 5.9
4 Taiwan 5.5
5 United States of America 2.8
6 South Korea 2.7
7 Germany 1.3
8 Netherlands 1.0
9 United Kingdom 0.9
www.ccsenet.org/ibr International Business Research Vol. 6, No. 12; 2013
The sources of inward FDI are mainly from PR China overseas territories, and foremost from Hong Kong. If we consider also Taiwanese investors, more than two thirds of the FDI attracted are from these overseas Chinese territories. A ‘closed-loop’ FDI, where Chinese investors or companies located at Hong Kong, Macao and Taiwan invest in the PR China mainland. Nonetheless, if we exclude this ‘closed-loop’ FDI, the main FDI sources are HICs—Japan, Singapore, South Korea, United States of America and other HICs from the EU. The TOP10 origins/sources, together, represent 91.3% of the PR China inward FDI—Table 5.
3. Method and Results: Bibliometric Method Applied to PR China Inward and Exports to HICs
3.1 Bibliometric Method
The bibliometric citation analysis illustrates linkages between research publications, authors and specific topics. Their importance is shown by a local or global citation score (LCS and GCS). This research method is based on the assumption that researchers publish their most important findings; their research is based predominantly on other, previously published, materials (Borgman & Furner, 2002; Van Raan, 2003). The analysis’ unit is a citation (Kim & McMillan, 2008). This method goes beyond counting publications (Quer, Claver & Rienda, 2007): identify publications’ concentration centers that ‘map out’ research streams (Kim & McMillan, 2008). Data for our research was collected in February/March 2012 from the ISI Web of Knowledge database. It provides an opportunity to use the Social Sciences Citation Index (SSCI). The purpose of this program is to collect only English written research papers. The author’s search period was from 1980 until 2012 to coincide with the major changes and improvements in the Chinese economy, after the conclusions of the Third Plenary Session of the 11th CPC Central Committee, in 1978, when have begun the new reforms and opening policy. During the search period, the type of publication was not specified, giving more focus on a topic overview. In order to collect comprehensive data, have been specified a more detailed search classification. The search combinations included: ‘Inward FDI in China’; ‘Chinese export to the EU’; and ‘China-EU relations’. A criteria ‘FDI impact on export’ was added to improve quality of research. Our main objective when was selected EU as target market was to focus on a specific market—or tariff trade area—where we can find the large majority of HICs, and, as it was mentioned before, together, EU member-states, are the most important PR China client. The search result find 300 research papers, and were added 67 publications were added manually, when was concluded a more deep analysis based on the previous 300. Total authors’ amount was 547 and, among them, 7 are anonymous. These 367 articles were published in 229 journals. Their total citation amount is 8080 references (TGCS). In order to identify these references was used the HistCite software, where research papers can be observed and related by author, date or journal type. Local and Global Citation Score (LCS and GCS) have been the key indicators in order to evaluate the relevance of each research paper of our sample. An approach considering the average citation per year was used also (LCS/t and GCS/t).
The Local Citation Score (LCS) shows the number of times the research paper has been cited within the sample—our sample is 367 research papers collected; the Global Citation Score (GCS) shows the number of times the research paper has been cited in the ISI Web of Science (Garfield, Pudovkin & Istomin 2003); LCS/t is the Local Citation Score per year from research paper publication to the end of the sample period; and, GCS/t is the Global Citation Score per year from research paper publication to the end of the sample period (Fetscherin et al., 2010). Taking into account our purpose, our analysis it was made mainly considering local citations (journals and research papers).
3.2 Most Influential Journals
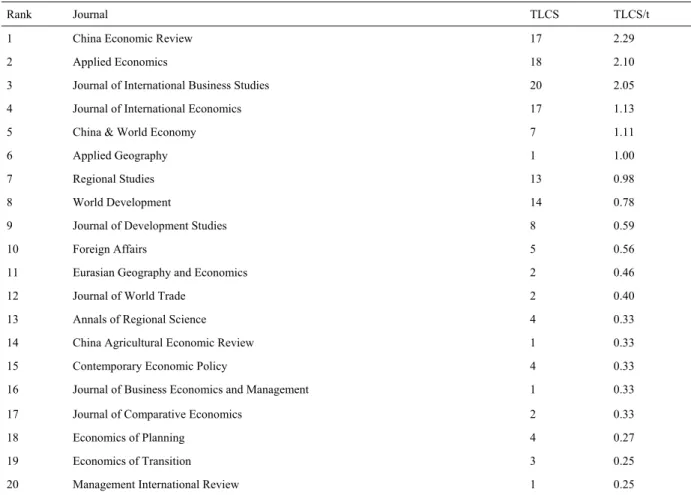
The 367 publications of our sample can be subdivided into three main categories: economics (30.9%); international management and development (25.4%); and regional studies (China) (20.3%). These subdivisions are together 76.6% of our sample publications. Among them there are six journals that got a total local citation score—LCS based on author or journal criteria—over 13. These journals are: Journal of International Business
Studies (20); Applied Economics (18); China Economic Review (17); Journal of International Economics (17); World Development (14); and, Regional Studies (13) (see Table 1).
The top 20 publications representing 28.3% of our sample publications and among them we can find 15.86% of cross-citations, and 22.62% of all local citations. The Journal of International Business Studies (JIBS) is the most cited journal; other previous studies, about the same topic (Fetscherin et al., 2010), conclude also that JIBS is highly cited journal.
www.ccsenet.org/ibr International Business Research Vol. 6, No. 12; 2013
23
Table 6. Ranking the influential journals—TLCS (total local citation score) and TLCS/t
Rank Journal TLCS TLCS/t
1 China Economic Review 17 2.29
2 Applied Economics 18 2.10
3 Journal of International Business Studies 20 2.05
4 Journal of International Economics 17 1.13
5 China & World Economy 7 1.11
6 Applied Geography 1 1.00
7 Regional Studies 13 0.98
8 World Development 14 0.78
9 Journal of Development Studies 8 0.59
10 Foreign Affairs 5 0.56
11 Eurasian Geography and Economics 2 0.46
12 Journal of World Trade 2 0.40
13 Annals of Regional Science 4 0.33
14 China Agricultural Economic Review 1 0.33
15 Contemporary Economic Policy 4 0.33
16 Journal of Business Economics and Management 1 0.33
17 Journal of Comparative Economics 2 0.33
18 Economics of Planning 4 0.27
19 Economics of Transition 3 0.25
20 Management International Review 1 0.25
3.3 Historiographic Research Papers’ Citation Mapping
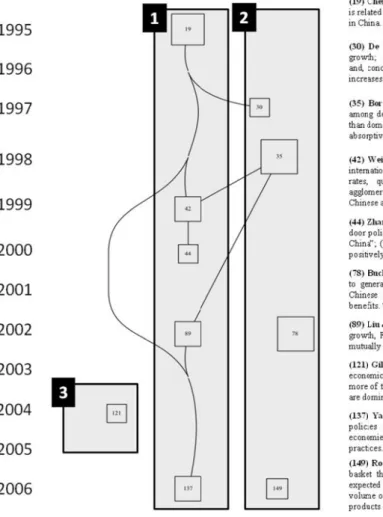
Histographic bibliometric citation mapping was used in order to understand better the links between research papers published (see Figure 3); the vertical axis represents the year and the number of published papers in that year (in parentheses). Only research papers with a LCS higher or equal to 5 were considered. Each map node displays a research node; it can be seen as a concentration of information, or ‘hub’ (Garfield et al., 2003; Fetscherin et al., 2010). The node size is relative to the number of received local citations and larger squares illustrate more cited publications. Arrows from one node to another denote a citation relationship between papers and research papers without an arrow pointing towards them are not cited by any other paper of the sample (only 10 research paper with a LCS higher or equal to 5). There are three nodes without connectivity in our picture: Buckley et al., 2002; Gilboy, 2004; and Rodrik, 2006 (see Figure 3).
www.ccsen Source: ISI, W Two main research p reforms an in PR Chin Zhang and R&D man exports—a relation am Yao (2006 adoption o economic order to be A second s of FDI—m direct link been publi companies performan additional Neverthele direct rela capability performan Buckley, C net.org/ibr Web of Knowledg n streams were paper publishe nd FDI attracti na. Chen, Cha d Song (2000) npower were f and manufactu mong FDI, exp 6) has conclude of business be reforms, econo e added to fore stream is also mainly from H k between the r ished focusing s in the globa nce, and how contribution, ess, Borenztein ation among
of the host nce, is related w
Clegg and Wan
Figure 3. Cita
ge (2012).
e found as res d by Chen et ion, and is give ang and Zhang
have related i found as avail uring province ports and econ ed, as a learnin est practices w omic policies t eign technolog shown as resu ICs—in order research paper g how MNEs fr al economy. D increases the relating FDI n et al. (1998) FDI impact— country. It m with the contex ng (2002) have Internationa ation mapping sults by applyi al. (1995) is en to FDI an i g (1995) contri inward FDI w lable resource es performance nomic develop ng process, th would be usef toward FDI att gy and internati ult, where it is
to contribute t s, from Chen’s from HICs has De Mello (199
value of FDI with a more ) contribution —and effectiv means, the imp
xt, and SEZs in e made a diffe
al Business Res
g 1980–2010; L
ing the bibliom developed a p mportant role ibution was im
ith provinces w es characteristi
e—is also mad pment, showin hat those PR C ful for other t traction and FD ional market a developed, ov to a more valu s et al. (1995) made an impo 97) has focuse I-related produ impact on eco is also import veness in eco mpact of FDI n PR China ha erence between earch LCS > or equa metric method path where is in the increasi mportant when where lower w ics (or feature de, and Liu et ng a mutual re China policies t transitional eco
DI export-driv access knowled
ver the time ra ue-added expor contribution a ortant contribu ed how FDI i uction. Borenz onomic growth tant in anothe onomic growth in the econo ave performed n FDI which h al than 5 d. A first strea made a link ing of total ass
authors as We wages (labor), es). A linkage t al. (2002) fin einforcing posi toward export onomies. This ven, resources dge (owned by ange 1980–201 rt basket. Even another set of r ution in order t impacts on do ztein et al. (1 h than the do er dimension: i h impact—wi mic growth, an important r had origin in H Vol. 6, No. 12; am where from between econ sets (capital go Wei et al. (1999 infrastructures between FDI nds a bi-direct itive impact. L promotion an s first stream
that were soug y FIEs)—Figur 10, the contrib n if we don’t f research paper to involve dom omestic comp 998) has give mestic investm it has been ma ith the absor and in the ex role. HICs or in ove 2013 m the omic oods) ) and s and I and tional Later, d the links ght in re 3a. ution find a rs has mestic anies en an ment. ade a rptive xport rseas
www.ccsen Chinese te more techn leveraging that the Ch This differ HICs have knowledge reforms w labor) whi Additional published HICs. Rein And foreig Source: ISI, W (1) Economic (2) Inward FD (3) Foreign c 4. Discuss Yao (2006 last 30 yea important of agglom the current net.org/ibr erritories (Hon nological spill g technological hinese export b rence is a resu e performed an e and high-tec were made, and ich were added lly, even if th in the Foreign nforcing this i gn companies, Web of Knowledg c reforms toward DI led to an increa companies domina sion: Lessons L 6) has conclude ars PR China h inward FDI st meration econom t world export ng Kong, Taiw overs than ove l and other kno basket is more ult—a final res
n important rol ch products an d HICs which d to their capita his paper is n n Affairs an art issue, Gilboy ( in high-tech in
Figure 3a. Cit
ge (2012)—A Clus an inward FDI att asing value of the ate high-tech indus
Learned from ed how Chines has been facing tock is the resu
mies (e.g., SEZ ranking leade Internationa an and Macao erseas Chinese owledge capab sophisticated ult—of an eco le, leveraging nd technologie
are the main n al and knowled not aligned in ticle where me (2004) states: “ ndustries are m tation mapping ster Analysis. traction and world
exports basket stries and a lion’s
m China se case can be g a huge incre ult of a strategy Zs) and the FD ership. al Business Res 25
o). These autho e investors, add bilities of dom
than it would onomic policy domestic com es. These inves
non-Chinese F dge resources— n the previous ention how Ch “high-tech com mainly from H g 1980–2010; d exports leadershi part of Chinese in e a learning ca ase of inward y where econo DI-spillovers m earch
ors have found ding more valu estic companie be expected fo toward an exp mpanies, contrib stment flows w FDI investors, —Figure 3a. s stream—Fig inese high-tec mpanies are do ICs. LCS > or equa ip ndustrial exports
se for other tra FDI and expo omic openness management w d that MNEs fr ue to FDI relat es. Rodrik (20 or a country w port-driven FD buting with int were possible have faced lo gures 3 and 3 h exports are m ominated by fo al than 5 ansitional econ rts. A commer to foreign inv were key-factor Vol. 6, No. 12;
from HICs gen ted production 06) concludes with its income
DI attraction, w ternational ma because econ ocal resources 3a—Gilboy (2 made by FIEs oreign compan nomies. Durin rcial surplus an
estors, the bui rs in order to r 2013 nerate n, and later level. where arkets omic (e.g., 2004) from nies”. g the nd an lding reach
www.ccsenet.org/ibr International Business Research Vol. 6, No. 12; 2013
Based on the bibliometric method, and on the literature review, it was possible to find how this phenomenon has been studied, and how researchers have published in the most influential journals, and which have been cited by several authors in a cumulative process of adding knowledge about this topic.
Since 1978, PR China has been implementing economic reforms; those reforms were crucial to activate endogenous resources. A disclosure of local resources which have been used by foreign investors, in order to produce goods in extended value chains (global value chains—Buckley & Casson, 2002; 2011; Humphrey, Schmidt, 2002; 2004). But those reforms were based on a policy choice, where ‘one country, two systems’ was the main reference.
Firstly, because PR China has developed agglomeration economies; even if some political issues can be raised regarding this option, besides that it was a policy which has given to foreign investors a location where their ownership advantages would be better exploited. SEZs were locations where labor abundance has been joined with knowledge and other resources. It has been important also the reforms made on legislation about taxes and joint-ventures. Those reforms and the previous mentioned agglomeration economies were important when global trade policy was moving toward a more liberal approach; the ending of the Uruguay Round, and all the efforts made during the last decades have developed a context where vertical FDI—and other sort of quasi-hierarchy approaches (Humphrey & Schmitz, 2003; 2004)—is being used as a tool to improve value chain efficiency. PR China, even if as it was stated by Wei et al. (1999) this approach has led to an uneven development between coastal provinces and non-coastal provinces. Nevertheless, Wei et al. (1999) contribution goes beyond this statement, and is important to highlight how this author underlines the importance of infrastructures, more R&D human resources and a closer link with overseas Chinese community. Those issues were critical to attract more inward FDI; and this policy was also critical in order to create a better involvement of local companies in international trade (mainly exports).
These SEZs were locations where it was possible to develop more efficient backward linkages, promoting an efficient context where FDI would find a better emplacement for its success. A location which was competitive in order to attract FDI, and at same time which was developing local companies competitiveness, with absorptive capabilities; a set of local companies which was able to get and transform the knowledge transferred by MNEs from HICs in new products and services that are competing not locally but in global markets.
A differentiation must be made among foreign investors: two groups have emerged, one where we can find overseas Chinese investors, and another, where are mainly investors from HICs. Buckley et al. (2002) has given an important contribution, as we have mentioned before, when differentiates the spillover effects from inward FDI which had as source HICs: this group of investors not only has brought market access to PR China exports, but also has generated technological spillovers, increasing the production-value content (Buckley et al., 2007) This bundle of capital and knowledge is a key factor when, as it was concluded by Rodrik (2006), PR China exports basket was more value-added than it would be expected; and when we relate inward FDI sources, goods exported and PR China export-markets, we can find HICs as source, more value-added products, where are predominat manufacturing goods, and USA and EU as most important clients (among other HICs)—see Figure 4.
Since 1978 steps were taken in order to capture FDI focused on exports, as a lever of economic growth. HICs as source of FDI, looking for resources in order to improve the value chain efficiency, and at same time HICs as most important export markets. Even if the ‘closed-loop’ FDI – or round-tripping FDI – as played an important role as FDI source, HICs have been actors which led PR China to the world export ranking leadership.
www.ccsen 5. Conclus Our purpo to increase focused on PR China important which pla concluded From the on-going p HICs have by Gilb knowledge The histor and reform reform in resources overseas C This step reinforcing Finally, if investors, internation manufactu Further ste cases; for to be our n Brazil, dur net.org/ibr Figure 4. Le sion
ose was the un e exports from n inward FDI a inward FDI s export market ayed a knowle d how relevant method three process, a huge e invested in m boy (2004) e-intensive—h rical perspectiv ms made durin order to redu (mainly labor Chinese territor was crucial in g, generating e the export ba but also be nal/global per uring goods—f eps can be take
instance, with next research o ring the last th
essons learned derstanding of m PR China to attraction and h sources are ma ts are United S edge transfer it was in order main determi e number of re manufacturing , foreigners high-tech—com ve gives us an ng the last 30 uce taxes, prom
r resources) b ries. n order to init economic grow
sket has a valu ecause the ve rspective. Sym from PR China en in this field other BRICs. object, applyin ree decades, h Internationa from PR Chin f which were t HICs. Using t how it has imp ainly overseas States and EU role was high r to improve th inants were id eforms, which industries, wh s from H mpanies in PR n insight about years in order mote FIEs and became ‘avail iate a process wth (and emplo ue content hig ertical approa mmetric flow a to HICs. d. The lessons Brazil is the s ng the same ind has been the sam
al Business Res 27 na—30 years b the determinan the bibliometri pacted on PR C s Chinese inve (28 member-s hlighted by B he value of Ch dentified: PR h had as object hich are the ma
HICs are R China (and at
t the policy ch r to develop a d joint-venture able’ and ope where inward oyment)—Liu gher than it is ach, where t ws: FDI from learned from t second BRICs ductive metho me, with the s
earch
building a worl
nts would lead ic method in a China exports. estors and inve
states). The im uckley et al. hinese exports.
China has im tive the attracti ain Chinese exp
the main t same time exp hoices made in
agglomeration es, have creat en to be used d FDI export-et al. (2002). expected (Rod the value cha m HICs to PR the PR China which receive dology, trying ame features th ld exports lead d to attract inw an historical pe estors from H mportance of H (2002), and o mplemented sin ion of inward port sectors; a owners porting compa n order to achi economies (S ted a context d by investors -driven and ex drik, 2006), is ain is extend R China and case can be co es more inward g to understand
han the Chines
Vol. 6, No. 12;
dership
ward FDI and, erspective we HICs; and, the HICs as FDI so other authors nce 1978, and FDI export-dr and, as it was s of the anies). ieve the leader SEZs), a legisl where endoge s—from HICs xports are mut s related with H ded, assuming d exports—m ompared with d FDI, and is g d if the evolutio se case. 2013 later, have most ource have d is a riven; stated most rship; ation enous s and ually HICs g an mainly other going on of
www.ccsenet.org/ibr International Business Research Vol. 6, No. 12; 2013
References
Borensztein, E., Gregório, J., & Lee, J. W. (1998). How does foreign direct investment affect economic growth?
Journal of International Economics, 45(1), 115–135. http://dx.doi.org/10.1016/S0022-1996(97)00033-0
Borgman, C. L., & Furner, J. (2002). Scholarly Communication and Bibliometrics. In I. B. Cronin (Ed.), Annual
Review of Information Science and Technology (Vol. 36, pp. 2–72).
http://dx.doi.org/10.1002/aris.1440360102
Buckley, P., & Casson, M. (1976). The Future of the Multinational Enterprise. Basingstoke and London: Macmillan.
Buckley, P., & Casson, M. (2011). Marketing and the multinational: extending internalization theory. Journal of
the Academy of Marketing Science, 39, 492–508. http://dx.doi.org/10.1007/s11747-010-0243-0
Buckley, P., Clegg, J., & Wang, C. (2002). The impact of inward FDI on the performance of Chinese manufacturing firms. Journal of International Business Studies, 33(4), 637–655.
http://dx.doi.org/10.1057/palgrave.jibs.8491037
Buckley, P., Clegg, J., & Wang, C. (2007). Is the relationship between inward FDI and spillover effects linear?—An empirical examination of the case of China. Journal of International Business Studies, 38(3), 447–459. http://dx.doi.org/10.1057/palgrave.jibs.8400274
Chen, C., Chang, L., & Zhang, Y. M. (1995). The role of foreign Direct Investment in China post-1978
Economic Development. World Development, 23(4), 691–703.
http://dx.doi.org/10.1016/0305-750X(94)00143-M
Chen, L., Zhou, Z., & Wan, G. (2000). Why is U.S. direct investment in China so small? Contemporary
Economic Policy, 18(1), 95–106. http://dx.doi.org /10.1111/j.1465-7287.2000.tb00008.x
Cheng, L., & Kwan, Y. (2000). What are the determinants of the location of foreign direct investment? The Chinese experience. Journal of International Economics, 51, 379–400. http://dx.doi.org/10.1016/S0022-1996(99)00032-X
Chiu, L. (2008). China’s Response to the Global Financial Crisis. Retrieved from http://chineseculture.about.com/od/thechinesegovernment/a/Chinaeconomy.htm
De Mello, L. (1997). FDI in developing countries and growth, a selective survey. Journal of Development
Studies, 34(1), 1–34. http://dx.doi.org /10.1080/00220389708422501
Dées, S. (1998). FDI in China, determinants and effects. Economics of Planning, 31(2–3), 175–194. http://dx.doi.org/10.1023/A:1003576930461
Dilip, K. (2007). Foreign Direct Investment in China: It’s Impact on the Neighboring Asian Economies. Asian
Business & Management, 6, 285–301. http://dx.doi.org/10.1057/palgrave.abm.9200225
Dunning, J. (2003). The role of foreign direct investment in upgrading China’s competitiveness. Journal of
International Business and Economy, 4(1), 1–13.
EIU-Economic Intelligence Unit. (2012). Country Data. Retrieved from http://country.eiu.com/China
Fetscherin, M., Voss H., & Gugler, P. (2010). 30 Years of FDI in China, an interdisciplinary literature review.
International Business Review, 19(3), 235–246. http://dx.doi.org/10.1016/j.ibusrev.2009.12.002
Fujita, M., & Hu, D. (2001). Regional disparity in China 1985–1994, The effects of globalization and economic liberalization. Annals of Regional Science, 35(1), 3–37. http://dx.doi.org /10.1007/s001680000020
Garfield, E., Pudovkin, A., & Istomin, V. (2003). Why do we need algorithmic historiography? Journal of the
American Society for Information Science and Technology, 54(5), 400–412.
http://dx.doi.org/10.1002/asi.10226
Gilboy, G. (2004). The myth behind China’s miracle. Foreign Affairs, 83(4), 33–48. http://dx.doi.org/10.2307/20034045
Huang, Y. (2003). Selling China: Foreign Direct Investment during the Reform Era. Cambridge.
Humphrey, J., & Schmitz, H. (2002). How Does Insertion in Global Value Chains Affect Upgrading in Industrial Clusters? Regional Studies, 36(9), 1017–1027. http://dx.doi.org/10.4337/9781843769743.00020
Humphrey, J., & Schmitz, H. (2004). Chain governance and upgrading: taking stock. In Schmitz, H. (Ed.), Local
www.ccsenet.org/ibr International Business Research Vol. 6, No. 12; 2013
29 Elgar. http://dx.doi.org/ 10.1093/jnlecg/lbh066
ITC-International Trade Center. (2012). Country Data—China. Retrieved from http://www.intracen.org
Kim, J., & McMillan, S. (2008). Evaluation of internet advertising research—A bibliometric analysis of citations from key sources. Journal of Advertising, 37(1), 99–112. http://dx.doi.org/ 10.2753/JOA0091-3367370108 Krugman, P. (1994). The Myth of East Asia’s Miracle. Foreign Affairs, 62–78.
http://dx.doi.org/10.2307/20046929
Lardy, N. (1996). The Role of Foreign Trade and Investment in China’s Economic Transformation. In A. Walder (Ed.), China’s Transitional Economy. Oxford: Oxford University Press.
Liu, X., Burridge, P., & Sinclair, P. (2002). Relationships between economic growth, FDI and trade, evidence from China. Applied Economics, 34(11), 1433–1440. http://dx.doi.org/10.1080/00036840110100835 Markusen, J. (1995). The boundaries of multinational enterprises and the theory of international trade. The
Journal of Economic Perspectives, 9(2), 169–189. http://dx.doi.org/ 10.1257/jep.9.2.169
Morrison, W. (2009). China and the Global Financial Crisis: Implications for the United States. Congressional
Research Service. Washington DC.
Naughton, B., & Lardy, N. (1996). China’s Emergence and Prospects as a Trading Nation. Brookings Papers
Economic Activity, 1996(2), 273–344. http://dx.doi.org/10.2307/2534623
OECD. (2000). Main Determinants and Impacts of Foreign Direct Investment on China’s Economy. OECD
Working Papers on International Investment, 2000(4). OECD Publishing.
http://dx.doi.org/10.1787/321677880185
Overholt, W. (2010). China in the global financial crisis: rising influence, rising challenges. The Washington
Quarterly, 33(1), 21–34. http://dx.doi.org/10.1080/01636600903418652
Quer, D., Claver, E., & Rienda, L. (2007). Business and management in China: a review of empirical research in leading international journals. Asian Pacific Journal of Management, 24, 359–384.
http://dx.doi.org/10.1007/s10490-007-9040-9
Rodrik, D. (2006). What’s so special about China’s exports? China & World Economy, 14(5), 1–19. http://dx.doi.org/10.1111/j.1749-124X.2006.00038.x
Sun, Q., Tong, W., & Yu, Q. (2002). Determinants of foreign direct investment across China. Journal of
International Money and Finance, 21(1), 79–113. http://dx.doi.org/10.1016/S0261-5606(01)00032-8
Tuan, C., & Fung-Yee Ng, L. (2002). FDI in China and the Regional Development: From Institutional Reform to agglomeration Economics Perspectives. Proceeding of 1st International Conference on National State and
Economic Policy: Conflict and Cooperation. Japan.
Tuan, C., & Fung-Yee Ng, L. (2002a). FDI Facilitated by Agglomeration Economies: Evidence from Manufacturing and Services Joint Ventures. Journal of Asian Economies, 13(6), 749–765. http://dx.doi.org/10.1016/S1049-0078(02)00183-5
Tuan, C., & Fung-Yee Ng, L. (2006). FDI Inflows and Growth of Private Business in China. Journal of
Entrepreneurship Research, 9(1), 101–132.
UNCTAD. (2012). UNCTAD FDI Statistics—Investment Country Profiles. United Nations. Retrieved from http://www.unctad.org
Van Raan. (2003). The use of bibliometric analysis in research performance assessment and monitoring of interdisciplinary scientific developments. Technikfolgenabschätzung, 12(1), 20–29.
Wei, S. (1995). Attracting foreign direct investment: Has China reached its potential? China Economic Review,
6(2), 187–199. http://dx.doi.org/10.1016/1043-951X(95)90003-9
Wei, Y., Liu, X., Parker, D., & Vaidya, K. (1999). The regional distribution of FDI in China. Regional Studies,
33(9), 857–867. http://dx.doi.org/10.1080/00343409950075498
Whalley, J., & Xin, X. (2006). China’s FDI and non-FDI economies and the sustainability of future high Chinese
growth. NBER Working Paper. http://dx.doi.org/10.3386/w12249
Whalley, J., & Xin, X. (2010). China’s FDI and non-FDI economies and the sustainability of future high Chinese growth. China Economic Review, 21(1), 123–135. http://dx.doi.org/10.1016/j.chieco.2009.11.004
www.ccsenet.org/ibr International Business Research Vol. 6, No. 12; 2013
Yao, S. (2006). On economic growth, FDI and exports in China. Applied Economics, 38(3), 339–351. http://dx.doi.org/10.1080/00036840500368730
Zhang, K. (2005). How Does FDI Affect a Host Country’s Export Performance? The case of China. International
Conference of WTO, China, and the Asian Economies, 3, 25–26.
Zhang, K., & Song, S. (2000). Promotion exports the role of inward FDI in China. China Economic Review,
11(4), 385–396. http://dx.doi.org/10.1016/S1043-951X(01)00033-5
Zhang, Q., & Flemingham, B. (2001). The relationship between inward FDI and China’s provincial export trade.
China Economic Review, 12(1), 82–99. http://dx.doi.org/10.1016/S1043-951X(01)00044-X
Notes
Note 1. World Bank (2012): a high-income country is defined as country with a GNI per capita of US$ 12,480 or more (range defined considering 2011).
Note 2. Hong-Kong was a Chinese territory under British Administration. The Handover was in 1997. Note 3. Macao was a Chinese territory under Portuguese Administration. The Handover was in 1999. Copyrights
Copyright for this article is retained by the author(s), with first publication rights granted to the journal.
This is an open-access article distributed under the terms and conditions of the Creative Commons Attribution license (http://creativecommons.org/licenses/by/3.0/).