Cities and social equity: inequality, territory and urban form: detailed report
208
0
0
Texto
(2)
(3) cities and social equity Detailed Report. Urban Age Programme The London School of Economics and Political Science Houghton Street London WC2A 2AE United Kingdom T +44 (0)20 7955 7706 [email protected] www.urban-age.net Alfred Herrhausen Society Deutsche Bank Unter den Linden 13/15 10117 Berlin Germany T +49 (0)30 3407 4201 [email protected] www.alfred-herrhausen-gesellschaft.de. left A diverse mix of Paulistanos crowd the bustling commercial area surrounding 25 de Março Avenue. Among the nearly 19 million residents in the Metropolitan Region are the largest Lebanese population outside of Lebanon, the biggest Japanese community outside of Japan, and the third largest Italian city outside of Italy after Buenos Aires and New York City. Tuca Vieira cover Morumbi and Paraisópolis in São Paulo create extreme promixity between rich and poor. Nelson Kon. Urban Age is a worldwide investigation into the future of cities. Organised by the Cities Programme at the London School of Economics and Political Science and the Alfred Herrhausen Society, the International Forum of Deutsche Bank..
(4) LSE Research Team Philipp Rode Ricky Burdett Richard Brown Frederico Ramos Kay Kitazawa Antoine Paccoud Natznet Tesfay. São Paulo Lead Investigators Paula Miraglia Eduardo Marques Ciro Biderman Nadia Somekh Carlos Leite de Souza. Supported by Miranda Iossifidis Christos Konstantinou Richard Simpson Santiago Escobar Advisers Tony Travers Andy Altman Enrique Peñalosa Anthony Williams José Castillo Sophie Body-Gendrot. First published 2009. ISBN 978-0-85328-418-5. acknowledgements Cities and Social Equity is a report by the Urban Age Programme at the London School of Economics and Political Science (LSE). Urban Age is a joint initiative of LSE and Deutsche Bank’s Alfred Herrhausen Society investigating the future of cities. The research for this report was prepared from November 2007 to February 2009 and represents the annual Urban Age research focus 2008, part of the Urban Age South America investigation.. Urban Age would like to thank the key stakeholders and experts that contributed their ideas and time to the workshops that were an integral part of this research study (see list on page A-1). Urban Age is further grateful for the continuous support of the South America partners, the State of São Paulo, the Municipality of São Paulo, the University of São Paulo and Getulio Vargas Foundation. The summary report and a complete listing of data sources is available at www.urban-age.net.. This report is intended as a basis for discussion. While every effort has been made to ensure the accuracy of the material in this report, the authors and/ or the Urban Age Programme will not be liable for any loss or damage incurred through the use of this report. Copyright of images is held by the photographer/creator, as credited alongside the image. We have been unable, in some cases, to trace or contact the copyright holder. If notified, the LSE will rectify any errors or omissions at the earliest opportunity. All rights reserved. No part of this publication may be reproduced, stored in a retrieval system, or transmitted, in any form or by any means, without the prior permission in writing of the London School of Economics and Political Science, or under existing licence from the LSE. Published by the Urban Age Programme, London School of Economics and Political Science, Houghton Street, London, WC2A 2AE..
(5) table of contents 1 introduction . 1-2. 1.1 1.2 1.3 . 1-3 1-3 1-4. São Paulo, South America and the Urban Age South America and inequality São Paulo: South American metropolis . 2 cities compared . 2-2. 2.1 2.2 . Urban South America South American cities compared . 2-4 2-5. 3 inequality, territory & urban form . 3-2. 3.1 3.2 3.3 3.4 3.5 . 3-4 3-5 3-14 3-47 3-49. Introduction Impacts of inequality South American city comparison Conclusion Methodological annex . 4 urban age city survey . 4-2. 4.1 4.2 4.3 4.4 4.5 4.6 4.7 . 4-4 4-5 4-6 4-8 4-11. Introduction Survey methodology and sample Inhabitants and characteristics of the SPMR Views of the city Satisfaction with urban infrastructure, quality of environment and public services Government evaluation Transport and mobility . 4-16 4-21. 5 safe spaces, safe city . 5-2. 5.1 5.2 5.3 5.4 5.5 . 5-4 5-4 5-7 5-14 5-31. Introduction The city of São Paulo - living conditions and violence Four districts compared Homicides at city and district levels, 2000 to 2007 Final considerations. 6 mobility, integration and accessibility. 6-2. 6.1 6.2 6.3 6.4 6.5 . Introduction Existing situation Finding the future: transport plans for the SPMR Implementing a new paradigm in transport policy Final notes: where are we going? Annex - managing car use in cities. 6-4 6-5 6-15 6-24 6-35 6-37. 7 . steering regeneration in cities. 6-2. 7.1 7.2 7.3 . São Paulo: “glocal” city, metropolis in mutation 7-4 The social construction of the urban project 7-8 A possible model for São Paulo 7-11 Annex 7.1 - Diagonal Sul urban operation 7-15 intervention stratgy model 7-21 Annex 7.2 - partnerships and politics: urban development partnerships in the UK. 8 . implications for policy. 8-2. list of workshops and working groups . a-1. bibliography . a-2. . data sources . a-4. . glossary. a-6. urban age team. a-7.
(6) 1-1 CITIES AND SOCIAL EQUITY.
(7) INTRODUCTION 1-2. 1 introduction. left In Rocinha, the largest favela in Brazil located on the hillside of Rio de Janeiro, there is an active tradition of providing for one’s own urbanity according to informal and organic interventions. Dante Busquets.
(8) 1-3 CITIES AND SOCIAL EQUITY. 1.1 São Paulo, South America and the urban age São Paulo, South America’s pre-eminent metropolis, is a city of the 20th Century. 100 years ago, its population was less than 300,000; today the municipality has a population of 10 million, with 18 million living in the wider São Paulo Metropolitan Area. São Paulo is a true global city, with a diverse population, a thriving commercial centre and a cultural vitality encompassing music, film, architecture and visual arts. The Urban Age is an international programme of research projects and conferences investigating the future of cities. The programme, a joint initiative of the London School of Economics and Political Science, and Deutsche Bank’s Alfred Herrhausen Society, takes an explicitly interdisciplinary approach to consider the future of cities, and aims to develop and foster dialogue between academics, politicians, policy makers and those responsible for managing and shaping our cities from day to day. Beginning in New York in 2005, and travelling to Shanghai, London, Johannesburg, Mexico City, Berlin and Mumbai, the Urban Age has explored – through international and interdisciplinary conferences, through data analysis and through interviews with leading urban experts and city managers – some of the world’s most important, diverse and dynamic cities. In 2008, the Urban Age focused on South America and on assessing the impact of inequality in an urban context. To stimulate debate among politicians and academics, the Urban Age research team undertook comparative research, data collection in five cities – São Paulo, Rio de Janeiro, Bogotá, Buenos Aires and Lima – but focused most closely on São Paulo, where the research projects that make up this report were commissioned, and where their findings were discussed at the Urban Age South America conference in São Paulo in December 2008.. 1.2 South America and Inequality Like other South American cities, São Paulo is a city of stark contrasts, a city where cultural vitality and economic growth sit alongside intense poverty and high crime rates. It is a city where the image of helicopters hovering over favelas has become an internationally familiar – even clichéd – signifier of polarisation. São Paulo may exhibit inequality on a greater scale than other South American cities, but the problems can be seen throughout the continent. Economic growth has enhanced living standards across the continent; Brazil, Argentina, Peru and Colombia are now all in the top 50 per cent of countries, according to the Human Development Index,1 and Brazil is now grouped with Russia, India and China (the “BRIC” economies) as a rising economic powerhouse. But the fruits of economic growth have not been equally distributed, and Latin America and the Caribbean also exhibit some of the highest levels of inequality in the world: the top five per cent of the region’s population receives 25 per cent of national income, as opposed to South East Asia, where they receive 16 per cent and developed countries where they receive 13 per cent.2 The ‘Gini co-efficient’, which measures the extent of inequality in wealth distribution, puts Brazil, Argentina, Peru and Colombia in the 20 per cent most unequal societies.3 Cities are dynamic environments, and such places are likely to exhibit inequality, especially as their economies develop and attract migrants from rural areas. But not all developing countries or developing world cities exhibit the acute levels of inequality that many South American cities and states do: among other Urban Age cities, only Johannesburg exhibits higher levels of inequality. Such pervasive inequality can have malign impacts, especially when it is concentrated spatially – when a city is divided between the fortified gated developments and the heavilypatrolled shopping malls enjoyed by the rich, and the sprawling informal settlements, lacking even basic infrastructure, occupied by the poor. The UN’s Habitat Programme, in a 2008/09 report on the world’s cities,4 sets out the scale and potential impacts of this polarisation: inequality can promote social unrest (thereby diverting funds from social programmes to security services), as well as undermining civil society and damaging economic prosperity by reducing incentives for participation in the formal economy.. Data downloaded from http:// hdr.undp.org/en/mediacentre/news/ title,15493,en.html 1 . State of the World’s Cities 2008/2009 – Harmonious Cities, United Nations Human Settlements Programme 2008 2 . Data downloaded from http:// hdrstats.undp.org/indicators/147. html 3 . 4 State of the World’s Cities 2008/2009 – Harmonious Cities, United Nations Human Settlements Programme 2008.
(9) INTRODUCTION 1-4. 1.3 São Paulo: South American Metropolis. 5 The stop of the city that could not stop, Andre Urani presentation to Urban Age Workshop, April 2008. below As in many other world cities, in São Paulo one will find modern buildings, services and goods, hightech commercial and entertainment centres, and modern hospitals and health services. Tuca Vieira. São Paulo was established in the 16th Century as a Jesuit mission, and its first period of intense growth was as a coffee exporter, in the late 19th and early 20th centuries. This vital role as a trading city, occupying space alongside two major rivers, between fertile agricultural land and Santos, South America’s largest port, also attracted the first waves of immigrants, laying the foundations for the diversity that would soon become one of São Paulo’s defining features. São Paulo’s second surge of growth came with industrialisation, and became most intense between 1950 and 1980, when the city’s GDP increased tenfold and its population quintupled. During the financial crises of the 1980s and 1990s, continuing population growth led to a 20 per cent fall in GDP per head, and to dramatic rises in unemployment (which has begun to fall again since 2000).5 At the same time, São Paulo’s economy has begun to de-industrialise, and to shift its balance to the services sector. Today, the city is responsible for around 20 per cent of Brazil’s GDP. São Paulo’s economic geography has changed too. The city’s central business district has gradually moved to the south west over the past century, from the old central district around Praça da Sé, to Avenida Paulista and the Jardim Paulista district, to the new high-value business and residential developments alongside the River Pinheiros. This has left the central district relatively depopulated, especially in the evenings, with the attendant problems faced by ‘hollowing. out’ cities across the world – relatively high levels of crime and self-reinforcing fear of crime. As the centre has shifted, informal favelas have grown up, both in pockets of occupied land near the city centre (like Paraisópolis, which is located alongside Morumbi, one of São Paulo’s wealthiest neighbourhoods), and around the periphery of São Paulo, where they also exist alongside huge social housing projects like Cidade Tiradentes. In many cases, these peripheral favelas are in environmentally sensitive locations (e.g., on the banks of the southern reservoirs that are crucial to São Paulo’s water supply), thereby creating enforcement dilemmas for politicians and policy makers. These extremes are not, of course, the whole story, but São Paulo does in places exhibit intense polarisation between informal settlements and single-tenure social housing developments on the one hand, and pockets of wealth – gated, fortified and patrolled – on the other. Given the scale of the city – São Paulo Metropolitan Area extends over nearly 8,000 square kilometres – and the traffic congestion that clogs the city’s streets and makes daily journeys from the outskirts to the centre lengthy if not impossible, these different São Paulos can seem very remote from each other. In recent years, many of São Paulo’s problems have been laid bare through the Cidade Limpia (“clean city”) policy, which mandated removal of the visual pollution of billboards and neon signs from the city’s buildings. But, as Mayor Gilberto Kassab explained at the Urban Age South America conference, the programme has also strengthened civic pride: “citizens have discovered their own city. They have recovered their self esteem and the fact that they are proud living here.”.
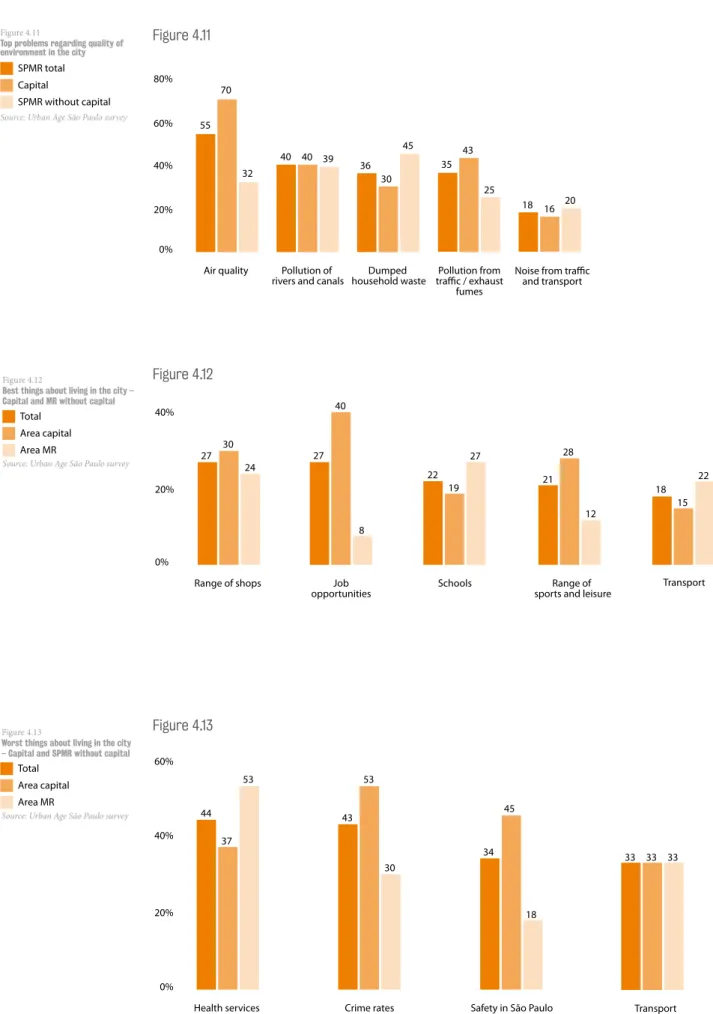
(10) 1-5 CITIES AND SOCIAL EQUITY. Understanding urban inequality – the research projects Poverty and inequality are persistent problems for South America, but civic leaders in South America are also at the forefront of seeking solutions. In doing so, many draw a distinction between conditions of material inequality, that is to say inequality of income and private wealth, and social inequality, which lies in unequal access to the rights, opportunities and benefits that can be realised from civic life and public amenities – from public transport, health and education to public space for recreation. While most modern politicians reject the extensive redistribution of wealth that would be needed to address material inequality over short timescales (which would in any case be reserved to national governments), civic leaders can and are taking the opportunity to redress social inequality by providing the social infrastructure that previous regimes had neglected. In a modern city like São Paulo, inequality has an impact on every aspect of urban life. Spatial polarisation means that different sections of society have dramatically different experiences of the city. Crime is concentrated in poorer districts, new developments promote isolation rather than integration, and poor transport links re-enforce isolation from economic, cultural and social opportunities that city life can afford. To understand the patterns of inequality in São Paulo and other South American cities, to analyse its impacts on different groups and spheres of urban life, and to consider how public policy instruments could make a difference, Urban Age initiated the five research projects presented in this report. Three of these projects were commissioned to São Paulo-based research teams. Two one-week seminars, one in São Paulo in April 2008 and one in London in August 2008 facilitated the development of all research strands and ensured collaboration across the all subjects. Chapter 2, Cities Compared, draws together the research undertaken by the Urban Age research team in the five South American cities, and presents comparisons with other Urban Age cities in Asia, Africa, Europe and North America where appropriate. The cities were assessed in terms of their administrative geography, their population density contours and urban form, their transport systems and movement patterns, and their workforce and economy.. Chapter 3, Inequality, Territory and Urban Form, provides an overview of the different aspects and ways of interpreting inequality, then presents a ground-breaking spatial analysis of patterns of inequality within the five South American cities. The Urban Age research team used educational attainment data collected by census tract as a proxy for socio-economic status. Mapping these data on GIS systems, the team undertook a series of analyses looking at key indices including dissimilarity, diversity, isolation and exposure. This was followed by a closer investigation at the neighbourhood scale, assessing the relationship between patterns of exclusion and building typologies of cities. Chapter 4, Urban Age City Survey, is based on 1,000 face-to-face interviews undertaken by Ipsos MORI for the São Paulo metropolitan region in June 2008. The survey addressed residents’ views on the best and worst things about living in São Paulo, satisfaction with public services and infrastructure, views on civic government, experience of and responses to violence, experience of transport and views on transport policy. These views were compared both with the views of experts and opinion-formers interviewed by the Urban Age team, and with the findings of a similar survey undertaken annually in London. The survey found significant similarities in views on the attractions of living in a world city: the range of shops and job opportunities were cited as the cities’ most attractive features on both sides of the Atlantic. But there were differences too: for Paulistanos, health services and transport services are major concerns, while Londoners focus on traffic and the cost of living. In both cities, crime is a major issue, with similar proportions of the population expressing concern, despite a considerable difference in crime levels – for example, the homicide rate in London is less than one-tenth that in São Paulo. São Paulo’s expert opinion agreed that crime was an important issue, but, for most experts, crime was overshadowed as a challenge by transport and housing, with planning and downtown revitalisation also featuring as significant concerns. This perhaps reflects the extent to which traffic congestion has grown worse in recent years, thereby rising up the policy agenda (while crime rates have fallen). Despite high levels of fear of crime in London, interviewees’ actual experience is very different in São Paulo: more than 50 per cent of respondents.
(11) INTRODUCTION 1-6. in São Paulo had direct (personal or family) experience of robbery and 47 per cent knew someone who had been murdered. Despite the spatial concentration of crime within favelas, fear of crime was more closely related to education level, gender and personal experience than it was to residence (and therefore to actual risk). Most Paulistanos argued that a more visible police presence on the streets and tougher penalties for young offenders would be most effective in tackling crime, though many also argued that relatively low cost interventions like improved street lighting would also help. More than 80 per cent of those polled in São Paulo said that they would buy a car if they could afford one, and use it for daily journeys, though residents also identified expansion of rail and bus networks as more important policies than more road building, and 80 per cent also said that they would change their mind and use public transport if provision improved. There was limited support for measures such as congestion charging, though support rose when the potential positive impacts of such schemes were outlined and more generally, 72 per cent agreed with policies aiming to reduce car use and increase the share of public transport, walking and cycling. Chapter 5, Safe Spaces, Safe City: Modes of Living in São Paulo, looks in more detail at the spatial articulation of crime and personal safety in São Paulo, at the relationship between crime and social segregation, and at the different ways in which ‘safe spaces’ are created in different neighbourhoods. The São Paulo-based research team, led by Paula Miraglia and Eduardo Marques and comprising researchers from the United Nations’ Latin American Institute for the Prevention of Crime and the São Paulo’s Centre for Metropolitan Studies, undertook a comparative study of crime rates in five different neighbourhoods in São Paulo, ranging from the prosperous Jardim Paulista to Jardim Ângela, once notorious as the homicide capital of the world. All these areas had seen a dramatic fall in homicide rates since 2000, variously attributed to improvements in policing, reduced availability of firearms, the work of non-governmental organisations and churches, and the resolution of territorial disputes between rival gangs. The team then selected two of the neighbourhoods for in-depth study: centrally-located Jardim Paulista and Cidade Tiradentes (a social housing complex. 30 kilometres east of the city centre). Through interviews with local residents and observation of how local people used public space, the team identified the different strategies underpinning improvements in public safety, and their implications for creating a safe city as well as safe spaces. The research team found that Jardim Paulista had sought to reduce crime through defensive design and social interventions that intensified its homogeneity. Measures included widening pavements and re-phasing traffic lights to reduce through traffic and create a better pedestrian environment, building up defences around buildings, and removing from its streets those beggars and street vendors seen by local residents as threats to peace and safety. In an allegory used by a local residents association, neighbourhoods like Jardim Paulista could protect their residents by creating “true islands of peacefulness within an inflamed territory”. Cidade Tiradentes, on the other hand, had become more heterogeneous. The cessation of gang hostilities had been accompanied by a gradual transformation of the district from a mono-cultural social housing project lacking even basic shops, to a more mixed neighbourhood, with improved shopping and transport links, and the patterns of sociability and connection that make more cohesive and secure conditions. The presence of shops and services, improved street lighting and more active streets have made for safer places. In the words of one resident, “criminals don’t like movement”. While the tactics of physical and social exclusion of ‘undesirables’ from rich neighbourhoods creates localised ‘safe places’, Paula Miraglia and Eduardo Marques argue that such interventions are short-sighted, and do nothing to improve the overall security of the city. Indeed, when matched with heavy-handed policing, they can boost the sense of alienation and exclusion that can provide fertile ground for breeding criminal behaviour: “either the entire city is safe, or no one is.” Chapter 6, Mobility, Integration and Accessibility, reports on a research project led by Ciro Biderman, Professor at the Centre for the Study of Policy and Economics of the Public Sector at Fundacao Getulio Vargas. Reviewing the São Paulo Integrated Urban Transport Plan (PITU 2025) against the backdrop of the systemic problems in São Paulo’s transport provision, the.
(12) 1-7 CITIES AND SOCIAL EQUITY. team make their own proposals, based on a more fundamental reconsideration of whose interests transport policy is designed to serve, and illustrate these through a case study based on re-defining the urban function of the Elevado Costa e Silva, a 3.4km-long elevated express way in the centre of São Paulo. The team observed that, while car-based commuting had grown in São Paulo, it remained lower than in London and Berlin; the time was right to create a viable and extensive alternative to continuing car growth. Fiscal and physical constraints meant that this should be based on a bus rapid transit (BRT) system rather than metro rail. The team’s plan would increase the total length of bus corridors, commuter rail and metro rail by three times, to create a network longer than New York’s, at 1,100 km, and one that would complete critical orbital routes around the city, thereby enabling more diverse travel patterns. This would be achieved at a per kilometre cost one-tenth that of subways. The team estimate that their proposals would reduce cars’ share of passenger kilometres from 36 per cent in 2025 (the ‘do nothing’ scenario), to 24 per cent (or as low as 16 per cent if accompanied by congestion charging). Buses’ share would. rise from 32 to 35 or 43 per cent under the same scenarios. But the advantages of BRT over metro systems are not just about cost. Professor Biderman argues that BRT systems have a more profound impact on travel patterns, by taking away road space that was seen as the entitlement of private car users. Given the higher incidence of private car use among richer people and reliance on buses by poor people, this re-allocation would promote social justice and equity (especially when combined with the wider reach of the BRT-based system). To illustrate the social changes that could be achieved by rethinking the priority accorded to different road users, the team undertook an in-depth case study on the Minhocao (or ‘Elevado Costa e Silva’ to use its proper name), a 3.4km-long elevated express way in the centre of São Paulo. Reconfiguring the Minhocao, so that only buses, pedestrians and cyclists could use the privileged space along the expressway, with bus stops integrated with metro stations, could offer a way to create a better and more mixed urban environment in the local areas, if balanced with creative and consistent use of planning tools (to avoid wholesale displacement of poorer residents).. above A view of São Paulo before the Cidade Limpa (Clean City) project took its course. The success of the project is evidence that even small interventions can have strong impact on Paulistanos and their view of their city. Tuca Vieira.
(13) INTRODUCTION 1-8. Chapter 7, Steering Regeneration in Cities, researched by Nadia Somekh and Carlos Leite from the Mackenzie Presbyterian University, reviews the processes and practices used to regenerate urban areas in São Paulo and other developing world cities, the ideology that underpins them and the way in which they could be reconfigured to deliver benefits to a wider population and to promote social justice. Focusing in on a nine square kilometre area of the regeneration axis known as ‘Diagonal Sul’, the core team also worked with private sector partners to develop a new model for inclusive urban regeneration within São Paulo. The Chapter also includes an annex reviewing the evolution of public-private regeneration partnerships in the UK. In São Paulo, the team argues that, as in other developing cities, the challenge of attracting and channelling investment is exacerbated by the widespread availability of sites (including more profitable ‘greenfield sites’), and by patterns of displacement and gentrification that undermine any social benefits that such projects might realise. Competition for investment from greenfield sites means that the incentives or tax breaks that have to be offered to bring investment to a deteriorating inner city area have to be increased,. thereby increasing the cost to the public purse overall. São Paulo had, the team argue, “failed to deliver an effective and democratic urban vision”. Piecemeal interventions risked displacing and eroding existing social and urban fabric, rather than realising social benefits. Brazilian cities need “a more subtle and sophisticated approach, based on a collective effort and broad participation, which aims to promote local development and social inclusion”. This new approach would be based on a clear metropolitan plan, underpinned by extensive community and municipal participation, and public-private partnership. New delivery and funding mechanisms should include new local regeneration agencies, which could act as ‘honest brokers’, independent of either the public administration or private interests, promoting dialogue between these partners and civil society, and focused on securing project funding and delivering results. The strategic masterplan prepared for Diagonal Sul shows how these principles can be applied in practice. Chapter 8 identifies some of the implications of the Urban Age South America research programme and conference for policy and practice across the world..
(14)
(15) 2 cities Compared. below Beyond the city centre, the panoramic view from the Christ the Redeemer Statue takes in Sugarloaf Mountain, the beaches of Copacabana and Ipanema, as well as several of the city’s favelas. Dante Busquets.
(16) 2-3 CITIES AND SOCIAL EQUITY. CHAPTER 2 - CITIES COMPARED TABLE OF CONTENTS 2.1 . urban south america . 2-4. 2.2 . south american cities compared . 2-5. 2.2.1 2.2.2 2.2.3 2.2.4. Urban footprint and administrative geography Density and urban form Transport and mobility Working in the city . 2-5 2-7 2-9 2-11.
(17) CITIES COMPARED 2-4. 2.1 urban south america During the second half of the 20th Century, the combined population of the five Urban Age South American cities more than quadrupled, as their economies industrialised. Economic crises stalled economic growth in the 1980s, but migration continued, leading to high levels of unemployment and growing inequality. In the 1990s, as the policies of economic and political liberalisation were introduced to remedy structural flaws in many South American economies, the seeds of economic recovery were sown, but levels of inequality continued to rise. This pace of growth, combined with political and financial instability, has created dynamic but sprawling cities, with low levels of spatial planning and public investment, and extensive informal settlements in peripheral locations. Poor public transport accessibility has reinforced the isolation of many of these informal settlements, institutionalising patterns of inequality into cities’ urban fabric.. In responding to the problems posed by this legacy, however, a new generation of South American civic leaders have been at the forefront of urban innovation in recent years, creating new approaches to meeting the challenges of urban growth in times of fiscal constraint and starting from a baseline of limited scope for state intervention. In their approach to transport investment, for example, cities like Curitiba in Brazil and Bogotá in Colombia have eschewed the expensive and technologically complex option of seeking to ‘retrofit’ developed cities with underground railways, and have instead created a hybrid mode of bus-based rapid transit systems, which run on segregated roadways, thereby offering speed and ease-of-use similar to metro systems at a fraction of the cost.. below This world map shows the population growth per hour projected through 2015 in some of the fastest growing cities with more than one million people. Source: Urban Age. +1. LONDON. +0. BERLIN. +25. +13 NEW YORK. +22 CAIRO. +23 MEXICO CITY. +42 +50. MEDELLÍN +7 +15 BOGOTÁ +12 LIMA. DELHI. DHAKA. BEIJING. +32. +40 +38 +50 SHANGHAI KARACHI. +42 MUMBAI. +33. +25. KOLKATA. MANILA. LAGOS. BELO HORIZONTE +11 +14 RIO DE JANEIRO SÃO PAULO. +24. +9 BUENOS AIRES. +24. KINSHASA. JAKARTA. +29. LUANDA +5. JOHANNESBURG.
(18) 2-5 CITIES AND SOCIAL EQUITY. 2.2 south american cities compared Every hour, the five Urban Age South America cities grow by a total of around 74 people. This rate is slower than it was before 1980 in South America, and is slower than that experienced today in some Asian and African megacities – Mumbai alone adds 42 people per hour – but it is nonetheless significant in a continent that already has the highest levels of urbanisation in the world.. 2.2.1 Urban footprint and administrative geography Across the world, accelerating urbanisation has opened up a gap between administrative geography and the functional extent of cities, city boundaries and the places between municipal metro live and work. In the where citizens actually case of Shanghai, the urban boundary includes extensive areas of agricultural land, but more commonly the problem is one of urbanised areas falling within different administrations. In extreme cases, like Buenos Aires, less than 25 per cent of the population of the conurbation is actually under the administration of the municipal government.. Area (km2). This mismatch can have practical and political consequences. In Bogotá, for example, the city’s boundaries are seen as undermining social cohesion and the city’s tax base, as richer people migrate to suburbs within different municipalities, attracted by lower tax rates and – in some cases – more permissive planning regulations. Urban growth can also lead to under-representation of cities and their interests at the level of national governments: São Paulo accounts for 20 per cent of Brazil’s population, but only 13.5 per cent of National Assembly and four per cent of Senate seats. As Eduardo Rojas, Principal Urban Development Specialist at the Inter-American Bank told the conference, the gulf between administrative and functional geography can undermine the relationship between citizens and the state: “cities … right now have functionally fragmented metropolitan structures and lack a lot of the institutional arrangements needed to coordinate action.”. Population (2005). Administrative units Administrative geography. São Paulo Rio de Janeiro Buenos Aires. Bogotá Lima. city metro. city metro. city metro. city metro city metro. 1,525 7,944. 10,886,518 19,226,426. 31 subprefeituras 39 prefeituras. 1,261 5,724. 6,093,472 11,563302. 18 subprefeituras 20 prefeituras. 203 3,839. 3,018,102 12,198,207. 15 comunas 24 partidos. 1,775 3,732. 6,840,116 8,074,212. 20 localidades 18 municipios. 2,665 2,794. 6,924,547 7,765,115. 43 distritos 49 distritos. Source: Urban Age research.
(19) CITIES COMPARED 2-6. Urban footprint Built-up area Metropolitan region Administrative city. Source: Urban Age research. Praça da Sé. Christ the Redeemer Statue. São Paulo. rio de janeiro. Ciudad Universitaria. Plaza de Armas. Bogotá. buenos aires. El Obelisco. LIMA.
(20) 2-7 CITIES AND SOCIAL EQUITY. 2.2.2 Density and urban form Despite their rapid growth, many of the Urban Age South America cities nonetheless retain their characteristic urban character, the street patterns and replicating clock formations that form the DNA of urban expansion seen within these ‘figure ground’ diagrams. Bogotá, Lima and Buenos Aires have more European blocktype layouts, with clearly defined streets, while São Paulo’s prosperous Jardim Paulista district is characterised by relatively isolated high-rise blocks, set apart from the urban grid, and Rio de Janeiro by a mix of irregularly-shaped apartment blocks and favelas on higher ground behind Copacabana Beach. Among other Urban Age cities a similar diversity can be observed, from the New York City’s and Berlin’s highly regular block. formations, to the more open-textured patterns of Johannesburg and Shanghai, the grand 18th Century streets of London, and the highly compacted layouts of Mumbai. The urban densities found within the South American cities are much higher than many European cities, but lower than Mumbai or Shanghai. Measuring the densities of the central areas of each city, Bogotá has the highest density (reflecting its constraint by farmland on one side and mountains on the other), with Buenos Aires and Lima following behind, with relatively intensely populated centres, and São Paulo and Rio de Janeiro behind them. São Paulo in particular has relatively consistent density spread over a wide area, reflecting the prevalence of highrise apartment blocks over a large area of the city. Population Density [pers/km2] 100 by 100 km. 0 – 1,000 1,000 – 5,000 5,000 –10,000 10,000 –20,000 20,000 and over Source: Urban Age research. SÃO PAULO PEAK 29,380 pp/km2. Bogotá PEAK 59,870 pp/km2 Morphology Each square represents one km2 in one neighbourhood of each city. left: São Paulo, Jardins; right: Bogotá, Parque de Virrey Source: Urban Age research. SÃO PAULO JARDINS. Bogotá PARQUE DE VIRREY.
(21) CITIES COMPARED 2-8. metropolitan region Average densities of city and region [pers/km2] Source: Urban Age research. Population Density [pers/km2] 100 by 100 km. central area administrative (within 10km of city centre point). peak. São Paulo. 2,420. 7,139. 10,299. 29,380. Rio de Janeiro. 2,020. 4,832. 8,682. 29,450. Buenos Aires. 3,177. 14,867. 12,682. 49,340. Bogotá. 2,164. 3,854. 21,808. 59,870. Lima. 2,779. 2,598. 12,620. 31,342. Mexico City. 3,796. 5,877. 12,541. 48,300. New York. 783. 9,551. 15,361. 53,000. Mumbai. 4,090. 27,348. 34,269. 101,066. 520. 1,962. 2,270. 38,500. Johannesburg. 0 – 1,000 1,000 – 5,000 5,000 –10,000 10,000 –20,000 20,000 and over Source: Urban Age research. LONDON PEAK 17,200 pp/km2. MUMBAI PEAK 101,066 pp/km2. LONDON NOTTING HILL. MUMBAI BULESHWAR MARKET. Morphology Each square represents one km2 in one neighbourhood of each city. left: London, Notting Hill; right: Mumbai, Buleshwar Market Source: Urban Age research.
(22) above. 2.2.3 Transport and mobility The ways in which people travel in cities reflect economic circumstances, as well as individual choices based on the availability of different alternatives and cities’ spatial configuration. Therefore walking is widespread in Mumbai and Rio de Janeiro where many homes and workplaces are near each other, but is also commonplace in Johannesburg, where alternatives are limited for many citizens. Climate and topography can influence choices too: cycling is far less popular in cities like Mumbai and Rio de Janeiro than it is in more temperate Berlin, New York and Shanghai.. public transport. The Urban Age South America cities have shown rapid growth in car ownership in recent years, with São Paulo adding nearly one million cars to its streets in the last five years . With the exception of Buenos Aires, the South American cities have far less developed rail systems than many of the other Urban Age cities. Bus use is therefore the dominant mode of public transport: São Paulo and Rio de Janeiro both have around 30 per cent bus use, with similar levels of walking, while Lima, following its extreme experiment in deregulation, is dominated by minibus transport.. walking and cycling. private car. More than 50 per cent of the inhabitants of Bogotá were born somewhere else, attracted in part by the city’s international acclaim owing to a city-wide renaissance over the last decade. The TransMilenio bus system above has become the most prominent symbol of the city’s innovative capacity. Giovanna Silva. car ownership Transport Modal Split. São Paulo. 36.9%. 32.9%. 30.2%. 351. Rio de Janeiro. 36.6%. 37%. 14.9%. 256. Buenos Aires. 43%. 12.9%. 36%. 429. Bogotá. 57.2%. 17.3%. 14.7%. 73. Lima. 51.5%. 25.4%. 11.2%. 92. New York. 54.6%. 10%. 29.7%. 210. Source: Urban Age research.
(23) Transport Modal Split. Alternative transport 8.4%. non-motorised transport public transport private motorised transport. Walking 9%. Motorcycle 0.9%. Motorcycle 0.5%. Bicycle 3.9%. Walking 33.8%. Source: Urban Age research Car 14.9%. 39% Other 1.9% Taxi 0.7% Tram 1.5% Metro 1.8%. 13% Car 36%. 37%. 37% Bus 30%. 50% 24% Bicycle 3.2% Taxi 7.2%. Bus 33.3%. Train 7%. rio de janeiro. Walking 9% Bicycle 1%. Other 5.7%. Motorcycle 5.2%. Metro 6%. buenos aires. Electromobile 5.4%. Walking 29.2%. Car 11.3%. Car 29.7%. 10%. 22%. 35%. Taxi 5.2%. 55%. 54% 24%. Rail rapid transit 2.5%. Public transport 54.6%. new york city. Bus 16%. Bicycle 25.2%. shanghai.
(24) 2.2.4 Working in the city The Urban Age South American cities industrialised rapidly in the mid-20th Century, and their economies are now entering a new phase of economic change, as knowledge-based service functions grow alongside primary and secondary production. Lima and Bogotá remain relatively industrialised, though less so than Shanghai, while the sectoral profiles of São Paulo, Buenos Aires and Rio de Janeiro are more similar to London’s or Berlin’s, with commerce and service sectors dominant.. The shift towards new types of economic production has remodelled the economic geography of cities, creating new business districts – like Puerto Madero in Buenos Aires – to attract financial and business service investors. Economic change also has huge implications for public services within cities, placing a premium on education and potentially marginalising from the city’s economy those with lower skill levels – often those new arrivals who had migrated to the city during the earlier phase of industrialisation. In São Paulo, for example, the Urban Age Ipsos MORI survey indicated that only 13 per cent of the population have attended university.. GDP GDP as (BN US$ current) % of national. GDP/capita (US$ current). HDI. 9,927. 817. São Paulo. 108. 12%. Rio de Janeiro. 49. 6%. 8,018. 807. Buenos Aires. 43. 24%. 14,231. 879. Bogotá. 36. 25%. 5,296. 756. Lima. 37. 47%. 4,829. 792. above Villa San Salvador in Lima. Philipp Rode. Employment *As there are no figures for the municipality for LIma, the figures provided for Lima are that of the metropolitan region. Since the difference in territory between Lima municipality and the metropolitan region is negligible, the use of Lima’s metropolitan figures alongside the municipal figures for the other four South American cities is still valid for comparative purposes. Source: Urban Age research.
(25) CITIES COMPARED 2-12. Other 1.3%. Employement Employment by sector by Sector primary sector secondary sector tertiary sector. Other Agriculture 0.4% 0.3%. Manufacturing 17.4%. Manufacturing 17.8% Services 28.7%. Source: Urban Age research. 23%. Services 52.7%. Construction 5.3%. 18%. Construction 0.6% Electricity, gas, water and sanitary services 0.3%. 81%. 77%. Commerce 23.3%. Transport, storage and communication 10%. Commerce 41.9%. LIMA. Other 4.6%. mumbai. Agriculture 0.4% Mining and quarrying 0.2% Manufacturing 10.1% Construction 3% Electricity, gas, water and sanitary services 0.7%. 13%. Other 8.7%. Manufacturing 12.1% Construction 6% Electricity, gas, water services 0.7%. 18%. Services 27.8%. Services 40%. Agriculture 1.3% Mining and quarrying 0.7%. 80%. 86% Commerce 33.5%. Transport, storage and communication 7.5%. Commerce 37.1%. Transport, storage and communication 5.6%. johannesburg. buenos aires. Agriculture 0.4%. Agriculture 0.2% Manufacturing 11% Electricity, gas, water and sanitary services 1.6%. 11%. Services 40.7%. 16%. Commerce 16.9%. 89%. Manufacturing 11.3% Construction 4.6% Electricity, gas, water and sanitary services 0.9%. 84% Commerce 35.5%. Services and transport, storage, communication 70.3%. rio de janeiro. Transport, storage and communication 6.5%. berlin.
(26) 3-1 cities and social equity.
(27) inequality, territory & urban form 3-2. 3 inequality, territory & urban form. left The favela Paraisópolis, which sits cheek-by-jowl to a gated complexes of Morumbi, shows the extremes of wealth and deprivation in São Paulo. Armin Linke.
(28) 3-3 cities and social equity. CHAPTER 3 – INEQUALITY, TERRITORY & URBAN FORM TABLE OF CONTENTS 3.1 INTRODUCTION . 3-4. 3.2 INEQUALITY IN A GLOBAL CONTEXT . 3-5. 3.2.1 3.2.2 3.2.3 3.2.4 3.2.5 3.2.6. Impacts of inequality Dimensions of inequality Global distribution of income and wealth National distribution of income and wealth The role of cities Concluding remarks . 3-5 3-7 3-8 3-9 3-10 3-13. 3.3 . south american city comparison . 3-14. 3.3.1 3.3.2 3.3.3 3.3.4 3.3.5 3.3.6 3.3.7. Introduction Measuring social segregation Education Dissimilarity Diversity Isolation Exposure . 3-14 3-15 3-17 3-19 3-27 3-35 3-45. 3.4 . conclusion . 3-47. . methodological annex . 3-49. boxes Inequality between and within countries . 3-8.
(29) inequality, territory & urban form 3-4. 3.1 INTRODUCTION An imbalance between rich and poor is the oldest and most fatal ailment of all republics. Plutarch. Any city however small, is divided at least into two, one the city of the poor, the other of the rich; these are hostile to each other. Plato. 1 . Kuznets (1955). below Located on a steep hillside overlooking the city and beach, Rocinha in Rio de Janeiro is the largest favela in Brazil. Dante Busquets. By looking into one of the most unequal regions of the world, the Urban Age research focus on South American cities aimed to bring new evidence to the debate on inequality and its relation with cities at the beginning of 21st century. With more than 50% of the world’s population now living in cities, the rapid urbanisation process is reshaping humanity’s territorial configuration through the creation of mega-agglomerations. Most of these are in developing countries, characterised in many cases by high levels of inequality. The consequences that high levels of inequality can have in these densely populated places are far from being fully understood and must be studied in greater depth. Crudely, spatial proximity highlights extreme differences in living conditions and creates particular dynamics that do not exist at the global or at national scales. Over the past decades, the notion of inequality itself has again become a central reference in policy making and research and it is now deemed as important as the notions of economic growth and poverty. It is a very broad term that describes the differences that exist between individuals, groups and nations in terms of income, wealth,. and access to public and social services. First theorised by Kuznets in 1955 as an inevitable and short lived consequence of industrialisation and urbanisation,1 it is now acknowledged as crucial in its own right in determining the economic and social success of a given political unit, be it a city, a nation or the world itself. This stems from the ease with which inequality can weave itself into every aspect of society and corrupt the political, legal, social and economic systems if allowed to go beyond certain levels. In particular, the dramatic consequences of high levels of inequality in some parts of the global South have raised international awareness and has led to new approaches in public policy as well as a vast increase in academic literature. Building on this academic discourse, this chapter will first aim to present the general debates that surround the issue of inequality by focusing on the different ways in which it is captured and the different scales at which it is studied. In the following section, the particular role of cities with respect to inequality will be highlighted by looking at non-quantifiable ways in which it can affect urban life. In a second part, the individual trajectories of five South American cities (São Paulo, Rio de Janeiro, Buenos Aires, Bogotá and Lima) will be presented. A series of indices will be used to superimpose their socio-economic situation on their urban fabric in order to uncover the mechanisms through which architectural typologies can reflect and possibly influence inequality. The implications for future research and policy making that follow from these three chapters will be summarised in the final section.. I think it would be good to use either two images (rich/poor) in one city or an image that captures the contrast..
(30) 3-5 cities and social equity. 3.2 INEQUALITY IN A GLOBAL CONTEXT 3.2.1 Impacts of inequality High levels of inequality have vast negative economic, social and political consequences and can potentially destabilise societies through the creation of social and political fractures. This is especially true if high inequality coexists with endemic poverty. Indeed, it has been documented that high levels of inequality make poverty reduction much more difficult in developing countries. Ravallion (2005) focuses on the ways in which inequality can offset the potential poverty alleviation gains from growth, such as in the case of Brazil in the 1980s – the country saw sustained growth without any reduction in the proportion of its population living with less than a dollar a day.2 In more general terms, he highlights that “amongst growing economies, the median rate of decline in the ‘$1/day’ headcount index is 10% per year amongst countries that combined growth with falling inequality, while it is only one per cent per year for those countries for which growth came with rising inequality”.3 Similarly, Birdsall (1996) correlates Latin America’s slower growth relative to East Asia’s since the 1960’s to the historically higher income inequality that exists in the former.4 While her explanation focuses on different saving behaviours among the poor in both regions that are triggered by the level of inequality, other authors have focused. on the effects inequality can have on the political system. Alesina and Rodrik (1994), for example, argue that calls for redistribution that emerge in countries with high inequality will lead to political conflict which is likely to result in instability and reduced growth. At a societal level then, high levels of inequality can lead to an increase in the level of political tensions and social divisions that can threaten national security and economic development.5 A final way in which inequality is related to poverty is through the issue of corruption. You and Khagram (2004) show that corruption and inequality are intrinsically linked: “income inequality is likely to be a significant and no less important determinant of corruption than economic development” and “corruption is also likely to reproduce and accentuate existing inequalities”.6 They highlight that high levels of inequality and corruption lead to lower levels of investment, lower growth and lower support for redistributive policies – all of which contribute to perpetuating poverty. The same effects on poverty of inequality and corruption are brought to light by Gupta (1998) through their undermining of the “progressivity of the tax system, the level of effectiveness of social spending and the formation of human capital”,7 while Begovic (2006) focuses on the pernicious effects of inequality on the judicial system and how it affects the litigation success rate of the poor.8 High levels of inequality can also take a psychological toll and seriously affect quality. 2 . Ravallion (2005). 3 . Ibid.. 4 . Birdsall (1996), p.2. 5 . You and Khagram, p.30. 6 . Ibid, p.31. 7 . Gupta (1998), p.29. 8 . Begovic (2006). below São Paulo is among the most unequal mega cities worldwide. Tuca Vieira.
(31) inequality, territory & urban form 3-6. 9 . Luttmer (2004), p. 29. 10 . Wilkinson (2005), p. 62. 11 . Ibid, p.63. 12 . Milanovic, B. (2000), p.50. 13 . Borjas (1987), p.551. 14 . Stark (2005), p.4. Liebig and Sousa-Poza (2004), p.16 15 . of life. Luttmer (2004) shows that “individuals’ self-reported happiness is negatively affected by the earnings of others in their area”,9 highlighting the fact that people care not only about their absolute income levels but also about their relative position in the income distribution. Wilkinson warns us that material life conditions can have a deep psychological impact because they are “a source of stress, whether in the form of unhappiness, depression, insecurity, anger, or anxiety”.10 For him, there are three major psycho-social risk factors that depend on material conditions and that can have drastic consequences on an individual’s quality of life as well as on the general well-being of a society. These are: “the effects of high or low social status, being more socially isolated rather than embedded in strong friendship networks, and the influence of early emotional and social development”.11 He asserts that inequality is very strongly linked to these psycho-social risks, a fact which he believes explains why societies with higher inequality rates have higher homicide rates and lower life expectancies. Thus, he tells us that inequality should not be seen as solely affecting an individual’s material living conditions; the adverse psychological consequences of daily life with feelings of inferiority, exclusion and anxiety about the future must also be factored into any detailed inquiry which investigates the impacts of high levels of inequality.. Finally, the extreme inequalities in the distribution of income and wealth at the global and national level explain the immense lengths to which people are willing to go, through legal or illegal migration, to ameliorate their living conditions. Indeed, as Milanovic (2000) reminds us, “an American having the average income of the bottom US decile is better-off than 2/3 of world population”.12 The explanatory power of inequality with respect to migration was first studied by Borjas (1987), whose model showed that if earnings in the sending and receiving countries were positively correlated, the socio-economic profile of emigrants could be predicted by the relative levels of inequality in both countries: if the receiving country is more unequal than the sending country, migrants are more likely to be from within the upper tail of the sending country’s income distribution, while migrants are more likely to be from the lower tail of the sending country’s income distribution if the sending country is more unequal than the receiving country.13 Stark (2005) makes the even stronger argument that it is the inequality level in the country of origin and the severity of the feeling of relative deprivation, per se, that explains the migration of members of the lower tail of the income distribution to another country.14 This conclusion supports the assertion by Liebig and Sousa-Poza (2004) that, ceteris paribus, a higher level of inequality in the origin country will tend to foster emigration.15.
(32) 3-7 cities and social equity. 3.2.2 Dimensions of inequality Three main perspectives are adopted when trying to understand patterns of inequality in the world. The most widely studied aspect of inequality is the difference that exist in terms of the income individuals or households receive. This information is largely based on population and household censuses which ask people about their monthly incomes and allows for intraand inter-country comparisons. To facilitate such comparisons, the income distribution of a given geographical unit is expressed by a single indicator, the Gini index, which measures the extent by which a given income distribution departs from perfect equality. Varying from 0 (every individual receives an equal share of the total income) to a 100 (one individual receives all of the income), United Nations-HABITAT has established an international threshold indicating that a Gini higher than 40 can have drastic social, economic and political consequences (for more details see table on this page). While income only indicates the monthly stream of money a household receives to meet the demands of everyday life, looking at personal wealth, i.e. the assets possessed by a household, allows for insight into the capacity that a household has in addressing exceptional circumstances, be it a natural disaster, a family tragedy or an important investment decision. This issue is most crucial in the world’s poorest countries that lack social security systems and at the same time are subject to economic and political uncertainty. In most cases, they do not have facilities in place to allow poor people to borrow or insure on reasonable terms. An understanding of the evolution and distribution of. wealth holdings around the world thus allows for a more accurate picture of the extent and depth of life chance inequalities. The last form of inequality to be reviewed here is that of social inequality, which focuses on the ability of households to access public and social services, such as potable water, adequate housing, public transport and good quality education. Social inequality is directly linked to the existence and accessibility of these services and depends on the willingness and capacity of the public sector to make them available. Inequality in the access to public services is a problem most prominent in countries of the global South, where informal settlements proliferate with limited to non-existing public infrastructure. It is obvious that income inequality is exacerbated in such environments where the poor do not have access to proper waste disposal solutions or reliable electricity among other public goods and suffer the consequences of poor health. On the other hand, social services, such as unemployment benefits, family subsidies, free childcare, etc. can play a very important role in complementing income and in helping to level the playing field. Indeed, even if income inequality is very high, the social system can guarantee that all citizens, whatever their income, may benefit from the same level and quality of public services. This is further strongly linked to the notion of social mobility: where access to good quality childcare and public education is available to all and the advantages deriving from higher income and wealth on life chances are diminished.. Davies (2008), Milanovic (2005) and Butler (2007) 16 . 17 Gini coefficient definition: 0.6 or above: Extremely high levels of inequality, not only among individuals, but also among social groups (known as “horizontal inequality”). Wealth concentrated among certain groups at the exclusion of the majority. High risk of social unrest or civil conflict. 0.5 to 0.59: Relatively high levels of inequality, reflecting institutional and structural failures in income distribution. 0.4 to 0.49: Inequality approaching dangerously high levels. If no remedial actions are taken, could discourage investment and lead to sporadic protests and riots. Often denotes weak functioning of labour markets or inadequate investment in public services and lack of pro-poor social programmes. 0.40: International alert line Inequality threshold. 0.3 to 0.39: Moderate levels of inequality. Healthy economic expansion accompanied by political stability and civil society participation. However, could also mean that society is relatively homogenous – that all groups are generally rich or poor – and, therefore, disparities are not reflected in income or consumption levels. 0.25 to 0.29: Low levels of inequality. Egalitarian society often characterised by universal access to public goods and services, alongside political stability and social cohesion.. Gini coefficient 0.6 or above. Extremely high levels of inequality, not only among individuals, but also among social groups (known as “horizontal inequality”). Wealth concentrated among certain groups at the exclusion of the majority. High risk of social unrest or civil conflict.. 0.5 to 0.59. Relatively high levels of inequality, reflecting institutional and structural failures in income distribution.. 0.4 to 0.49. Inequality approaching dangerously high levels. If no remedial actions are taken, could discourage investment and lead to sporadic protests and riots. Often denotes weak functioning of labour markets or inadequate investment in public services and lack of pro-poor social programmes.. 0.40 International alert line. Inequality threshold.. 0.3 to 0.39. Moderate levels of inequality. Healthy economic expansion accompanied by political stability and civil society participation. However, could also mean that society is relatively homogenous – that all groups are generally rich or poor – and, therefore, disparities are not reflected in income or consumption levels.. 0.25 to 0.29. Low levels of inequality. Egalitarian society often characterised by universal access to public goods and services, alongside political stability and social cohesion.. Interpreting the Gini coefficent17 Source: UN-HABITAT Monitoring and Research Division, 2008..
(33) The three main measures of inequality16 Source: Davies (2008), Milanovic (2005) and Butler (2007). Income Inequality. Milanovic, B. (2005), p.108. 19 . ibid.. 20 . Milanovic, B. (2000), p.50. 21 . Davies (2008), p. 417. 22 . Ibid.. Social Inequality. • Differences in the incomes of individuals or households. • Differences in personal assets and wealth of individuals or households. • Differences in access to public and social services. • Measurement: monthly income. • Measurement: total value of assets. • Measurements: qualitative. 3.2.3 Global distribution of income and wealth. 18 . inequality, territory & urban form 3-8. Wealth Inequality. Research on the global distribution of income has emerged in conjunction with studying the effects of globalisation and became possible only following the growing availability of household surveys, wealth and estate tax records and investment income data for a significant proportion of nations. With respect to income inequality, Milanovic (2005) analyses household survey data from 91 countries for 1988, 1993 and 1998 to calculate the world Gini index by purchasing power parity (PPP). He concludes that the world income distribution became less equal over that decade, with the world Gini increasing from 62 in 1988 to 65 in 1993 and then back to 64 in 1998.18 Throughout, levels have been far above UN-Habitat’s threshold, indicating a highly problematic world income distribution (at least when applying the same standards for national levels to the global level). In 1998, the world income Gini index in current dollars reached almost 80.19 Milanovic (2000) shockingly illustrates the 1993 level of inequality: “the richest one percent of people in the world receive as. much as the bottom 57 percent, or in other words, less than 50 million richest people receive as much as 2.7 billion poor”.20 With regards to wealth inequality, Davies et al. (2008) have been able to demonstrate that the world distribution of wealth is much more concentrated than the world distribution of income, with the share of the richest 10% of the world’s population at 85% of the total wealth for the year 2000, and a Gini index at current prices that reaches the extreme level of 89.2.21 This concentration has a very strong regional basis: for the same year, “about 34 per cent of the world’s wealth was held in the USA and Canada (…), 30 per cent in Europe, and 24 per cent in the rich Asia-Pacific group of countries. Africa, Central and South America, China, India, and other Asia-Pacific countries shared the remaining 12 per cent”.22 In population terms then, 24% of the world population held 88% of the total wealth in the year 2000.. Box 3.1. inequality between and within countries A 2001 World Bank study by Milanovic and Yitzhaki investigated the Gini Index at global and continental level for the year 1993. It decomposed the index into two components: inequality between and within countries. From a global perspective, income is distributed more unequally across the world’s population than in the most unequal countries. Looking at continents, Asia and Latin America together with Africa emerge as the most unequal regions of the globe. Nevertheless, there is a significant difference between these regions: in Asia, inequality is due to the differences between countries while in Latin America, more than 90% of the continental Gini coefficient is related to the grotesque levels of inequality observed within its countries. Continent Decomposing world income distribution Source: Milanovic, B; Yitchzachi, S. World Bank, 2001.. Gini coefficient. Between countries. Within countries. Africa. 53.1. 20.3. 32.8. Asia. 61.5. 44.5. 17. Eastern Europe/ Former Soviet Union. 46.5. 18. 28.5. Latin America and Carribean. 55.5. 4.1. 51.4. Western Europe, North America and Oceania. 32.5. 6.9. 25.6. WORLD. 65.9. 49.8. 16.1.
(34) 3-9 cities and social equity. 3.2.4 National distribution of income and wealth Moving on to national levels of inequality, certain parts of the world exhibit much higher levels of income inequality than others. In particular, countries in Sub-Saharan Africa and Central and South America share the highest levels of inequality while those in Europe, South Asia and Japan are much less unequal. The range of inequality experiences is staggering: UNDP data for 2005 shows that the country with the lowest Gini index was Denmark with 24.7 whilst the one with the highest was Namibia, with 74.3.23 Such differences in distribution of income warrant further investigation, particularly in terms of the share of total income held by the poorest and richest quintiles in each country. In Namibia, the 20% poorest receive little more than one percent of total national income while the richest 20% get close to 80% of it.24 For Denmark, on the other hand, these percentages are 8.3 % and 35.8% respectively.25 While the lowest inequality is found in the Scandinavian countries and the Latin American region boasts the highest consistent inequality, there is no direct relationship between a country’s wealth and its Gini index: Botswana is ten times richer in GDP PPP per capita terms than Haiti, but both countries have equivalent Gini indices and the US and Norway have the same GDP PPP per capita but Norway’s Gini index is 15 points lower. This general pattern is presented in the world map of income inequality below and in graph 3.1 on the opposite page which illustrates the relationship between income inequality (measured by Gini index) and GDP by purchasing. power parity (PPP) per capita (in international dollars) at the national level for all countries worldwide. With a few exceptions such as the US, Singapore and Hong Kong, countries with a Gini Index of above the UN alert level of 40 are middle to low income countries with a GDP per capita of below 10,000 US$. Within the middle-income range, these are predominantly Latin American countries with extremes such as Brazil, Colombia and Bolivia, while the lower income countries with high inequality are almost exclusively African, most prominently Sierra Leone, the Central African Republic and Lesotho. Acceptable Gini levels, i.e. under the UN threshold, can be found in countries of all income ranges and across all global regions though more pronounced low inequality is featured mainly within European and OECD countries. Denmark, Japan and Sweden are among the least unequal countries with a Gini below 25. Asian and Middle-Eastern countries combine middle income levels with relatively low inequality mostly below the UN alert line. A look at individual countries and the spread of income quintiles further illustrates the obvious. The more unequal the country as a whole, the wider the spread of the average income for each quintile. Colombia, South Africa, Brazil, Peru and Argentina are among those countries where the highest quintile reaches the average GDP of OECD Countries while the lowest quintile often remains within levels of countries in SubSaharan Africa. The lowest quintile in Colombia equals that of Madagascar. The poorest 20% in Colombia, Brazil and Peru are even poorer than the poorest 20% in India. Within their regional context, the UK, the US and Turkey display great. UNDP Human Development Report 2007/2008, http://hdr.undp. org/en/statistics/data/ 23 . World Bank, Development Indicators 2007, http://siteresources. worldbank.org/DATASTATISTICS/ Resources/table2_7.pdf 24 . 25 . Ibid.. below World map of inequality. n/a 24.7 - 30.9 30.9 - 35 35 - 40 40 - 45 45 - 50 50 - 55 55 - 60 60 - 74 Source: UNDP HDR 2007/2008. N A.
(35) 30 Asia and Middle-East. Germany. Acceptable Levels. Eastern and South-Eastern Europe. Gini Index vs. GDP per capita and income distribution by quintiles for the Urban Age countries inequality, territory & urban form OECD Countries. 20 1,000. 1,500. 2,500. 5,000. 10,000. 20,000. 30,000. 3-10. 50,000 70,000 90,000. GDP PPP per capita [in international $]. Legend:. Gini index, GDP PPP per capita and income distribution by quintiles for a selection of countries poorest 20%. richest 20%. 20%. 20%. 20%. national average. GINI Index. Graph 3.1. 70. Latin America and Caribbean. 60. Colombia South Africa. Source: Urban Age research based on UNDP HDR 2007/2008 and World Bank datasets. Brazil. GINI at Harmful Levels. Peru. Africa. Argentina. 50 China Mexico Turkey. USA. 40. UN Alert. India UK France. 30 Asia and Middle-East. Germany. GINI at Acceptable Levels. Eastern and South-Eastern Europe OECD Countries. 20 1,000. 1,500. 2,500. 5,000. 10,000. 20,000. 30,000. 50,000 70,000 90,000. GDP PPP per capita [in international $]. discrepancies between quintiles. The lowest quintile in the UK comes close to the average Legend: GDP of Mexico. Within countries, wealth is also much more richest unequally poorest distributed than income. Among the countries for 20%which 20% data 20%is available, 20% 20% Davies reports that the least unequal are Japan (54.7) national average and China (55) while the most unequal are Switzerland (80.3), the USA (80.1) and Brazil (78.4).26 The distribution of wealth thus adds another level of complexity to the issue of inequality and highlights how the situation of poor countries with a very unequal income distribution can be worsened when the poorest segment of the population does not possess assets that would allow for a certain degree of selfinsurance. Consequently, the lack of formal land titles, restricted access to borrowing and financial instruments and the lack of social safety nets can exacerbate income inequalities by not allowing the poor to ameliorate their economic conditions.. 3.2.5 The role of cities. World Bank, Development Indicators 2007, http://siteresources. worldbank.org/DATASTATISTICS/ Resources/table2_7.pdf 26 . There is a notable absence of Gini indices for cities in the developed world. 27 . There is no study of personal wealth inequalities within cities. 28 . So far, patterns of inequality were discussed at the global and national level. However, a better understanding of inequality as experienced by individuals on a daily basis requires analysis on a smaller geographical level. Cities are particularly important to allow for a better understanding of the local dynamics at play. This is due to the unique features of cities as densely populated territories with a diversity of. functions and because most city authorities deal with the regulation of their territory through the management of housing programs, infrastructure and public and social services. The decision to put infrastructure or services in a particular area of the city has a significant impact on the living conditions of a certain group of people. While one might propose that under certain conditions urban territory, city form and infrastructure can act as ‘equalisers’, all too often the exact opposite occurs and the built environment of cities can reinforce income inequality. Compared to global and national levels, regional and local level data on inequality is difficult to obtain for both, income inequality27 and for wealth.28 This absence of data comes at a time when the issue of urban inequalities is becoming particularly important due to the key role of cities as part of the global economy. Indeed, cities concentrate huge amounts of wealth, in a way completely disproportionate to their population. In 2005, the 30 most economically powerful cities in the world produced the same GDP PPP as four times the African continent or two times the South American continent. In quantitative terms, this means that 261 million people, or 4.3% of the world population concentrated 15% of the world GDP PPP. As such, the inequality present inside cities must be understood alongside the tremendous wealth that these places produce. The wealth is concentrated in a small number of places.
Imagem


+7


Documentos relacionados
Public Works to form the General Department of Geodetic, Topographic, Hydrographic. and Geological
"A OIT manteve a terminologia 'trabalho forçado' até uns 10 anos, quando incorporou também a categoria de escravidão, entendendo esta como a nossa própria Constituição depois
The following variables are considered endogenous: unemployment rate, growth rate of total factor productivity, inflation rate, terms of trade, hours per worker, growth rate
Críticas têm sido feitas ao lucro contábil: O conceito de lucro contábil ainda não se encontra claramente formulado; Não há base teórica permanente para o cálculo e
Este artigo faz parte de um projeto mais amplo denominado Práticas de disponibilização da produção científica da Universidade Federal da Bahia (UFBA):
be a positive association between access to public spaces and physical activity; (2) the association would be more marked with increased quality of public spaces; and (3) there
The quantification of pieces by the presence of bubbles, was performed after unmolding and the number of pieces with the presence of Little Lateral Microbubble (LLMI),
Através desta pesquisa, podem-se conhecer as dúvidas que os familiares de crianças com necessidades especiais de saúde com demanda de cuidado tecnológico no domicílio
