Braz. J. of Develop.,Curitiba, v. 6, n. 10, p.76897-76912,oct. 2020. ISSN 2525-8761
Drying Characteristics and Heavy Metal Levels in Three Marine Fishes
Commercialized in Brazil
Características de secagem e teor de metais pesados em três espécies de peixes
marinhos comercializados no Brasil
DOI:10.34117/bjdv6n10-206
Recebimento dos originais: 08/09/2020 Aceitação para publicação: 09/10/2020
Joane Grassi de Oliveira University of Caxias do Sul (UCS)
Francisco Getúlio Vargas, 1130, ZIP Code 95070-560, Caxias do Sul, Brazil E-mail: jgoliveira2@ucs.br
Matheus Poletto
Postgraduate Program in Engineering of Processes and Technologies (PGEPROTEC) University of Caxias do Sul (UCS), Francisco Getúlio Vargas, 1130, ZIP Code 95070-560, Caxias
do Sul, Brazil E-mail: mpolett1@ucs.br
Braz. J. of Develop.,Curitiba, v. 6, n. 10, p.76897-76912,oct. 2020. ISSN 2525-8761 ABSTRACT
Fish is an important food in human diet. Drying processes are used to preserve its quality while the determination of inorganic contaminants in fish is helpful to maintain human health. In this study, the effect of drying conditions on moisture ratio and effective diffusivity of Prionace glauca (PRG),
Squatina guggenheim (SQG) and Theragra chalcogramma (THC) was examined. Five thin layer
drying models were fitted to drying data. In addition, the concentration of As, Ni, Cr and Hg in the fish samples were also determined by means of Inductively Coupled Plasma Optic Emission Spectrometry (ICP-OES). The results reveal that THC presented both the highest effective moisture diffusivity and moisture evolution with drying time. The Page model showed the best fitting of experimental data. All samples presented levels of Cr and Hg higher than the permitted by Brazilian legislation. High levels of As were found to SQG and PRG. This study indicated the need to establish monitoring programs in Brazil to prevent the intake of fish meat with high levels of toxic metals. Keywords: dry, diffusion coefficient, fish, metal contamination, modeling.
RESUMO
O peixe é um alimento importante na dieta humana. Processos de secagem são usados para preservar a qualidade do peixe, enquanto a determinação dos contaminantes inorgânicos é útil para manter a saúde humana. Neste trabalho, o efeito das condições de secagem na razão de umidade e no coeficiente de difusividade de Prionace glauca (PRG), Squatina guggenheim (SQG) e Theragra
chalcogramma (THC) foi examinado. Cinco modelos matemáticos foram testados para ajustar os
dados de secagem obtidos. A concentração de As, Ni, Cr e Hg nas amostras de peixe também foram determinadas por meio de Espectrometria de Emissão Óptica por Plasma Acoplado Indutivamente (ICP-OES). Os resultados mostraram que a amostra de THC apresentou os maiores valores de umidade e difusividade com a evolução do tempo de secagem. O modelo de Page foi aquele que melhor representou os dados experimentais. Todas as amostras apresentaram teores de Cr e Hg acima do permitido pela legislação brasileira. Elevados teores de As foram encontrados para SQG e PRG. Este estudo indicou a necessidade de estabelecer programas de monitoramente no Brasil que previnam a ingestão de carne de peixe com elevados teores de metais tóxicos.
Braz. J. of Develop.,Curitiba, v. 6, n. 10, p.76897-76912,oct. 2020. ISSN 2525-8761 1 INTRODUCTION
The accelerated industrialization and urbanization of several cities around the world has been causing contamination of air, soil and water by heavy metals, such as nickel, lead, cadmium, chromium and mercury, due to human activities [1-2]. The heavy metals are considered highly hazardous to human health and its intake may cause chronic poisoning [1, 3-4].
In the last years, there is a general concern about the risks associated to the food contamination by heavy metals and how they may rapidly able to spread out at different levels in the food chain [1,5]. Naseri et al. (2015) report that plants growing in a soil contaminated with toxic elements can accumulate these elements in plant tissue and cause contamination of the food obtained from this plant [6]. Mataveli et al. (2016) verified that a type of rice commercialized in Brazil presented higher levels of arsenic [1]. Ooi et al. (2015) observed that marine organisms exposed to heavy metals may accumulate the metals in their tissues at various degrees [7]. The foods contaminated with heavy metals constitute a problem due to the potential bioaccumulation and biomagnification in biosystems through contamined soil and water [1,8]. The toxic metals when intake are slowly eliminated from the human body and usually accumulate in tissues, such as muscles and liver, and can cause several diseases [7]. Fish is an important source of high quality protein required in human diet [9-10]. The fish consumption has been increased around the world in the last years. According to Food and Agricultural Organization (FAO) (2018) the human fish consumption in 2011 was 130 million tonnes and in 2016 the human consumption reached 151 million tonnes, an increased superior to 15% in world [11]. The fish production in Brazil was 1286 million tonnes in 2016, the third major production in South America [11].
Fresh fish is a very perishable food product and has a very short shelf life [10]. When fresh fish was not consumed is necessary preserve its properties to avoid bacterial and mould growth [12-13]. Drying is an important technique adopted to conserve perishable food, such as fresh fish [14]. The most commonly drying processes normally involve sun, oven and microwave drying [9-10, 14]. High concentration of toxic elements was found in fish and seafood in several studies around the world. Endo et al. (2009) observed the contamination of mercury in spiny dogfhises (Squalus
acanthias) caught off the coast of Japan [15]. Karunanidhi et al. (2017) verified higher concentration
of zinc, lead, copper and cadmium in marine fishes collected in South India [16]. Vignatti et al. (2018) reported levels of chromium higher than that permitted by the Brazilian legislation on blue shark (Prionace glauca) caught in the southeast-south coast of Brazil [17].
In this context, this work was studied the drying characteristics, as well as the concentration of arsenic, nickel, chromium and mercury in marine fishes commercialized in Brazil using
Braz. J. of Develop.,Curitiba, v. 6, n. 10, p.76897-76912,oct. 2020. ISSN 2525-8761
Inductively Coupled Plasma Optic Emission Spectrometry (ICP-OES). The toxic metals levels presented in Prionace glauca, Holacanthus ciliares and Theragra chalcogramma fishes were investigated whether they are in accordance with levels permitted by the Brazilian legislation, aiming at public health promotion.
2 MATERIALS AND METHODS 2.1 MATERIALS
Fish samples of Prionace glauca (PRG), Squatina guggenheim (SQG) and Theragra
chalcogramma (THC) were obtained from a fish market in Caxias do Sul, Brazil. The selected
samples were cleaned and the fish muscles were used in this study. The excess of water was removed by blotting with absorbent paper. The original quality of the each fish were preserved by stored the samples at -4°C in a refrigerator prior to the tests.
2.2 DRYING EQUIPMENT AND EXPERIMENTAL SETUP
Three slices of each fish sample were cut with dimensions of 2cm x 3cm x 0.5cm to be used in drying experiments. The initial moisture content of each sample was determined using a convection oven at 105 ± 2°C. The drying was carried out in a Gibertini Eurotherm thermobalance with 350W power, using approximately 5g of sample. The temperature used was 60°C. The sample mass was determined at 5 min intervals, directly by the thermobalance front display, until a constant mass. The thermobalance has ventilation holes on the top as well as in both sides.
2.3 MODELLING OF DRYING PROCESS
To evaluate the drying characteristics of fishes studied the moisture ratio (MR) values were determined from the moisture content data (kg water/ kg dry fish) at time t from Equation 1:
𝑀𝑅 = 𝑀𝑡−𝑀𝑒
𝑀𝑜−𝑀𝑒
where Mt, M0 and Me are moisture content at any time of drying (kg water/ kg dry matter),
initial moisture content (kg water/ kg dry matter) and equilibrium moisture content (kg water/ kg dry matter), respectively. The Me was neglected since its values are relatively small compared to
Mt and Mo [18-19].
The drying data obtained were fitted to five different single-lawer drying models detailed in Table 1.
Braz. J. of Develop.,Curitiba, v. 6, n. 10, p.76897-76912,oct. 2020. ISSN 2525-8761
Table 1: Mathematical models applied to the drying curves
Model name Model equation
Newton [19] MR = exp(-kt)
Page [18]
Henderson and Pabis [14]
MR = exp(-ktn) MR = a exp(-kt) Midilli et al. (2002) [20] MR = a exp(-ktn) + bt
Parabolic [10] MR = at2 + bt + c
The nonlinear least-squares regression analysis was used to estimate model parameters using Origin 2018. The coefficient of determination (R2) is one the primary parameter used for selecting the best model to define the drying curves [10]. However, for better determine the quality of the fit, reduced chi-square (χ2) and root mean square error (RMSE) are also used. These both parameters were calculated as presented in Equation 2 and Equation 3, respectively:
𝑅𝑀𝑆𝐸 = [1 𝑁∑ ((𝑀𝑅𝑒𝑥𝑝,𝑖 − 𝑀𝑅𝑝𝑟𝑒,𝑖) 2 𝑁 𝑖=1 ] 1 2 𝜒2 =∑ ((𝑀𝑅𝑒𝑥𝑝,𝑖 − 𝑀𝑅𝑝𝑟𝑒,𝑖) 2 𝑁 𝑖=1 𝑁−𝑍
where MRexp,i is experimental moisture ratio, MRpre,i is predicted moisture ratio, N is the number of observations, Z is the number of constants. The model that best describe the drying characteristics was chosen as the one with the highest R2, followed by the least χ2 and RMSE values [19,21].
2.4 EFFECTIVE MOISTURE DIFFUSIVITY
Diffusivity is normally considered the main mechanism for transporting moisture from the inside to the sample surface to be evaporated [14]. The effective moisture diffusivity can be determined from the slope of the normalised plot of MR, ln(MR) versus time, when the drying time is abundant [10, 14], by means of Equation 4:
ln(𝑀𝑅) = ln (8 𝜋2) − ( 𝜋2 𝐷𝑒𝑓𝑓 4 𝐿2 ) 𝑡 (2) (3) (4)
Braz. J. of Develop.,Curitiba, v. 6, n. 10, p.76897-76912,oct. 2020. ISSN 2525-8761
where (Deff) is the effective moisture diffusivity (m2/s) and L is the half thickness of the sample
(m).
2.5 METAL CONTENT DETERMINATION
The arsenic, nickel, chromium and mercury content in muscles samples of the fishes studied was analysed using a ICP-OES equipment (ICAP 7000- Thermo Scientific). The samples were previously dried in a convection oven at 60°C until constant weight. After that, samples were grinded in a food processor. The samples were prepared according to EPA Method 3050-B and SMEWW Method 3120-B and analyzed in triplicate.
3 RESULTS AND DISCUSSION 3.1 DRYING CHARACTERISTICS
The THC showed the highest moisture content on a dry basis (503%), followed by PRG (478%) and SQG fish (314%). These results demonstrated that approximately 80% of the initial mass was eliminated after drying. Jain and Pathare (2007) previously reported that 80% of the mass of fresh fish is constituted of water [22].
The drying curve represents the evolution of moisture content as a function of time. The changes in MR with the drying time for all fishes evaluated are shown in Figure 1. The drying curve could be generally divided in three phases [14]. In phase 0 the sensible heat is transmitted toward the surface of the samples accompanied by the increases in its temperature [14]. This stage is observed in the firstly part of each fish drying, before the initial 25 min, presented in Figure 1. In this phase all samples show very similar behaviour. At this stage, the change from a transient regime to a permanent regime, in which the sample reaches the drying bed temperature occurs. The energy is used to increase the temperature of the sample by a sensible heat input, which results in the beginning of water evaporation [10,14]. The phase 1 corresponds to the steady drying phase. In this period, the free water is present in sample surface. So, the vapour pressure at sample surface is equal to the saturation vapour pressure and is also a function of temperature [10,14]. In addition, the drying rate is constant during this period, and only depends on the external condition, such as, temperature, air humidity and flow characteristics [10,12,14]. This phase can not be identified in Figure. 1.
Braz. J. of Develop.,Curitiba, v. 6, n. 10, p.76897-76912,oct. 2020. ISSN 2525-8761
Figure 1: Evolution of moisture ratio of the fishes versus drying time
The falling drying rate period, corresponding to the phase 2, is observed in the drying curves at 50-200min, approximately. In this stage, the energy is used to evaporate water from the sample, in both vapour and liquid state [14]. As consequence, the sample temperature increases and the drying rate decreases. This mechanism is governed by effective diffusion in materials, which depends on the temperature, pressure and moisture content of the sample [10,14]. The water is probably removed from the sample by a diffusion-controlled process. Thus, the constitution of each fish meat may influence in the mass and heat transfer, which may cause the decrease of drying rate. Lahsasni et al. (2004) reported that in this stage the drying is governed by the water diffusion in the solid [23], which is in agreement with the results of this work. After 200 min the moisture ratio is reduced, indicating that the drying process is near to reaching the equilibrium moisture content.
3.2 MODELLING OF DRYING CURVES
The best model for describing the thin-layer drying characteristics of fishes studied is selected according to the highest R2 value and the lowest χ2 and RMSE values. The statistical results for models tested are summarised in Table 2. The statistical parameter estimations showed that R2, χ2 and RMSE values ranged from 0.9836 to 0.9999, 0.00002 to 0.00142, and 0.00435 to 0.07110,
respectively. It is observed that all tested models presented R2 values near to the unit associated with lowest χ2 and RMSE values, which demonstrates the accuracy of the mathematical models tested in
Braz. J. of Develop.,Curitiba, v. 6, n. 10, p.76897-76912,oct. 2020. ISSN 2525-8761
Table 2: Results of statistical analysis on the modelling of moisture content versus drying time for the fishes studied.
Model name
Sample R2 χ2 RMSE Coefficients
a b c n k Newton SQG PRG THC 0.9926 0.9922 0.9836 0.00095 0.00108 0.00252 0.01805 0.02055 0.04781 --- --- --- --- --- --- --- --- --- --- --- --- 0.00933 0.01103 0.01295 Page SQG PRG THC 0.9990 0.9997 0.9999 0.00012 0.00004 0.00002 0.01061 0.00623 0.00435 --- --- --- --- --- --- --- --- --- 1.164 1.187 1.319 0.00432 0.00473 0.00325 Henderson and Pabis SQG PRG THC 0.9956 0.9961 0.9907 0.00056 0.00054 0.00142 0.07110 0.02201 0.03580 1.042 1.052 1.078 --- --- --- --- --- --- --- --- --- 0.00986 0.01178 0.01424 Midilli SQG PRG THC 0.9989 0.9996 0.9998 0.00014 0.00005 0.00003 0.01072 0.00615 0.03759 0.997 1.004 0.999 0 0 0 --- --- --- 1.171 1.179 1.309 0.00417 0.00493 0.00333 Parabolic SQG PRG THC 0.9978 0.9959 0.9954 0.00028 0.00057 0.00071 0.01563 0.02206 0.02454 0.000013 0.000017 0.000021 -0.00704 -0.00811 -0.00935 0.996 0.995 1.006 --- --- --- --- --- ---
From the all modes tested, the Page model seems to be the best model describing the drying characteristics the three marine fishes, as can be seen in the adjustment done in the experimental data showed in Figure 1, and also verified by the highest R2 value and lowest χ2 and RMSE values presented in Table 2. However, Midilli model also showed similarity with experimental data and cannot be discarded. Chavan et al. (2008) and Darvishi et al. (2013) also observed similar results [9,10]. Darvishi et al. (2013) evaluated the drying of sardines in microwaves and found that the Midilli model was the one that came closest to the experimental data, but the Page model was also efficient [10]. For Chavan et al. (2008) the Midilli model was the one that came closest to the experimental data during the drying of Rastrilliger kangurta in a solar dryer [9].
3.3 EFFECTIVE MOISTURE DIFFUSIVITY RESULTS
The values of effective moisture diffusivity are presented in Table 3. The Deff values ranged
from 3.24 x 10⁻¹⁰ to 8.83 x 10⁻¹⁰ m2/s. The values obtained in this work are in the general range of 10-11 to 10-9 m2/s commonly verified for food materials [24-25].
Braz. J. of Develop.,Curitiba, v. 6, n. 10, p.76897-76912,oct. 2020. ISSN 2525-8761
Table 3: Values of effective moisture diffusivity (Deff ) for fishes studied
Sample Deff (m2/s) R2
SQG 3.24 x 10⁻¹⁰ 0.958
PRG 3.36 x 10⁻¹⁰ 0.956
THC 8.83 x 10⁻¹⁰ 0.958
The THC shown the highest Deff value followed by PRG and SQG. This result corroborates
the moisture ratio presented in Figure 1. When samples were dried the activity of water molecules increase [25] since the energy is used to heat the sample, consequently the movement and collisions between water molecules increases, which result in higher moisture diffusivity.
3.4 HEAVY METAL CONCENTRATION IN FISH AND HUMAN HEALTH RISK
The mean concentration of cadmium, arsenic, nickel, chromium, mercury, copper and zinc obtained to SGQ, PRG and THC fish samples are presented in Table 4.
Table 4: Metal concentration (mg/kg) found in muscle samples from the samples fish analyzed.
Metals SQG PRG THC Cd n.d. n.d. n.d. As 1.10 ± 0.53 1.85± 1.06 n.d. Ni 1.80 ± 1.41 1.30 ± 0.01 0.80± 0.01 Cr 1.33± 0.15 1.30 ± 0.28 1.20 ± 0.26 Hg 2.07± 1.08 3.40± 0.87 1.23 ± 0.40 Cu 1.63± 0.55 1.33± 0.38 1.57 ± 0.40 Zn 31.93± 3.23 31.23± 0.72 24.00 ± 2.01 *n.d. = not detected
Cd accumulates in the human body and may cause several diseases, such as, skeletal damage, kidney dysfunction and reproductive deficiencies [26]. According to the Brazilian Legislation [27-28] the concentration of Cd allowed in sea fish is 0.3 mg/kg. FAO permits a maximum concentration of 0.5 mg/kg in fish [29]. All fish samples evaluated did not presented contamination by Cd.
Arsenic is highly toxic to humans. Long term exposure to arsenic can cause skin lesions, cardiovascular disease, diabetes and cancer [30]. The maximum concentration of As permitted by Brazilian Legislation [27-28] in fish is 1.0 mg/kg. The maximum As allowed concentration in fish according to FAO is 1.0 mg/kg [29]. SQG and PRG fishes presented As levels higher than legal limits, while for THC the presence of As was not detected.
Ni can cause dermatitis, cardiovascular disease and cancer depending on the dose and length of exposure. There is no limit of Ni for fish in Brazilian standards. World Health Organization
Braz. J. of Develop.,Curitiba, v. 6, n. 10, p.76897-76912,oct. 2020. ISSN 2525-8761
(WHO) recommended a daily intake of 0.1-0.3 mg Ni [31]. The Ni mean levels in fishes samples analyzed are in the range of 0.80-1.80 mg/kg.
Cr is an essential trace element in human diet. The intake of lower levels of Cr in human diet may cause diabetes mellitus and cardiovascular disease [26,32]. The recommend daily intake of chromium in human diet is 0.05-0.2 mg [33]. The Codex Alimentarius Comission of several countries, such as, Taiwan, the United States, Japan, Australia and New Zealand have no limit for Cr in aquatic food [32]. The maximum concentration of Cr permitted by Brazilian Legislation [27-28] is 0.10 mg/kg. All sea fishes evaluated presented higher levels of Cr, more than 10 times higher than those permitted by Brazilian Legislation, which suggest a potential risk in consumption the sea fish studied in this work.
Hg is considering by WHO as one of the top ten chemical or group of chemicals of major public health concern [34]. Mercury can cause several toxic effects to humans, even at low doses. Hg is also capable of bioaccumulation in fish, mainly in predatory and long live species, as Prionace
glauca [35]. Tenuta Filho and Nascimento (2007) reported that sharks can accumulate mercury at
high and toxic levels if its meat was intake by humans [36]. The Brazilian standard [27-28] permits a maximum concentration of 1.0 mg/kg of Hg only in predatory fishes and 0.5 mg/kg in all others fish species. The higher levels of Hg suggest a potential risk to human health with the intake of the fishes studied.
The intake of Cu and Zn are essential to maintain human health. However, higher intake of copper can cause liver and kidney damage [32]. Zinc deficiency may result in inhibition of growth, loss of appetite and immunological problems [26,32]. The maximum permitted limits for Cu and Zn by FAO (1983) are both 30 mg/kg. The Brazilian Legislation [27-28] permits a maximum concentration of 30 mg/kg of Cu and 50 mg/kg for Zn in food. All fish samples presented levels of Cu and Zn within the allowed limit of Brazilian standards.
3.5 HUMAN HEALTH RISK VIA FISH CONSUMPTION
Fishes can bioaccumulated heavy metals and the intake of them may cause several problems to human health. The human health risk with fish consumption was evaluated based on provisional tolerable weekly intake (PTWI), acceptable daily intake (ADI), oral reference dose (RfD) that were previously defined by US EPA (2011) [37] and JECFA (2003) [38]. ADI was calculated from PTWI. The estimated daily intake (EDI) represented the concentration level of heavy metal entering in human body daily via fish consumption and is adopted to predict consumer health safety [39]. The EDI can be obtained by means of Eq. 5:
Braz. J. of Develop.,Curitiba, v. 6, n. 10, p.76897-76912,oct. 2020. ISSN 2525-8761 EDI = 𝑀𝑐 ×𝐼𝑅
𝐵𝑤
where Mc is the metal concentration (mg/kg), IR represents the ingestion rate (mg/kg), the
Brazilian individual fish consumption rate 24.65 g/person/day is used in this work [40], Bw is body
weight, 70 kg was adopted in this study.
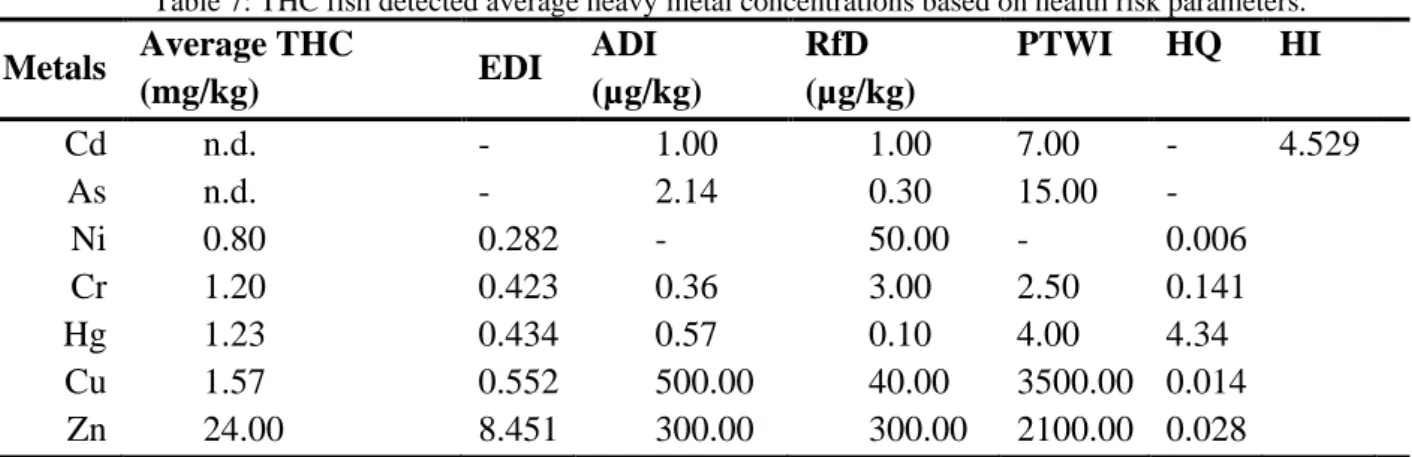
The hazard quotient (HQ) was obtained by dividing the EDI value by the established RfD to evaluate the health risk from the fish consumption. A vale of HQ ≤ 1 indicates no obvious risk. The hazard index (HI) is also calculated based on the sum of all HQ values based on the assumption of fish consumption can result in several heavy metals intake and could increase the risks to human health. The obtained results are presented in Table 5 for SQG, Table 6 for PRG and Table 7 for THC.
Table 5: SQG fish detected average heavy metal concentrations based on health risk parameters. Metals Average SQG (mg/kg) EDI (µg/kg) ADI (µg/kg) RfD (µg/kg) PTWI HQ HI Cd n.d. - 1.00 1.00 7.00 - 8.801 As 1.10 0.387 2.14 0.30 15.00 1.29 Ni 1.80 0.634 - 50.00 - 0.013 Cr 1.33 0.470 0.36 3.00 2.50 0.157 Hg 2.07 0.729 0.57 0.10 4.00 7.29 Cu 1.63 0.575 500.00 40.00 3500.00 0.014 Zn 31.93 11.245 300.00 300.00 2100.00 0.037 *n.d. = not detected
Table 6: PRG fish detected average heavy metal concentrations based on health risk parameters. Metals Average PRG (mg/kg) EDI (µg/kg) ADI (µg/kg) RfD (µg/kg) PTWI HQ HI Cd n.d. - 1.00 1.00 7.00 - 14.351 As 1.85 0.651 2.14 0.30 15.00 2.17 Ni 1.30 0.458 - 50.00 - 0.009 Cr 1.30 0.458 0.36 3.00 2.50 0.153 Hg 3.40 1.197 0.57 0.10 4.00 11.97 Cu 1.33 0.470 500.00 40.00 3500.00 0.012 Zn 31.23 10.999 300.00 300.00 2100.00 0.037 *n.d. = not detected (5)
Braz. J. of Develop.,Curitiba, v. 6, n. 10, p.76897-76912,oct. 2020. ISSN 2525-8761
Table 7: THC fish detected average heavy metal concentrations based on health risk parameters. Metals Average THC (mg/kg) EDI ADI (µg/kg) RfD (µg/kg) PTWI HQ HI Cd n.d. - 1.00 1.00 7.00 - 4.529 As n.d. - 2.14 0.30 15.00 - Ni 0.80 0.282 - 50.00 - 0.006 Cr 1.20 0.423 0.36 3.00 2.50 0.141 Hg 1.23 0.434 0.57 0.10 4.00 4.34 Cu 1.57 0.552 500.00 40.00 3500.00 0.014 Zn 24.00 8.451 300.00 300.00 2100.00 0.028 *n.d. = not detected
The HQ of As are higher than unity for SQG and PRG fish species, while the HQ of HG is higher than unity for all fishes evaluated. Both results demonstrated that are risk to human health with the consumption of the all threes fish samples analyzed in this work. The HI results also showed the same behaviour and demonstrated that a mutual effect of the heavy metals may occurs and could affect the human health when the intake of a contaminated fish.
4 CONCLUSION
The drying characteristics and concentration of As, Ni, Cr and Hg of three marine fishes were investigated. The drying curve reveals only the presence of falling drying rate period. The Page model seems to be the best mathematical model for describes the drying process. The effective moisture diffusivity varying from 3.24 x 10⁻¹⁰ to 8.83 x 10⁻¹⁰ m2/s. The data from metal concentration in fishes analysed indicate that the consumption of these fishes can represent a risk to Brazilian population. The anthropogenic activities can cause contamination of soil, air and water and as a consequence generates higher levels of hazardous contaminates in seawater, which can result in the contamination of all trophic chain. Therefore, it is necessary to establish better control programs to avoid the distribution of seafood with high levels of toxic metals. A more intense inspection of fish meat must be done by Brazilian government to promoted Public Health.
ACKNOWLEDGMENTS
Braz. J. of Develop.,Curitiba, v. 6, n. 10, p.76897-76912,oct. 2020. ISSN 2525-8761 REFERENCES
1. Mataveli, L.R.V.;Bruzzo, M.L.; de Arauz, L.J.; Carvalho, M.F.H.; Arakaki, E.E.K.; Matsuzaki, R.; Tiglea, P. Total arsenic, cadmium, and lead determination in Brazilian rice samples using ICP-MS. J. Anal. Methods Chem. 2016, 2016: 1-9. https://doi.org/10.1155/2016/3968786 2. Endo, T.; Kimura, O.; Ogasawara, H.; Koga, N.; Kato, Y.; Haraguchi, K. Mercury, cadmium,
zinc and copper concentrations and stable isotoperatios of carbon and nitrogen in tiger sharks (Galeocerdo cuvier) culledoff Ishigaki Island, Japan. Ecol. Indic. 2015, 55: 86–93 https://doi.org/10.1016/j.ecolind.2015.03.008
3. Kosanić, M.; Ranković, B.; Rančić, A.; Satnojković, T. Evaluation of metal contents and bioactivity of two edible mushrooms Agaricus campestris and Boletus edulis. Emir. J. Food
Agric. 2017, 29: 98-103. https://doi.org/10.9755/ejfa.2016-06-656
4. Reksten, A.M.; Victor, A.M.J.C.; Neves, E.B.N.; Christiansen, S.M.; Ahern, M.; Uzomah, A.; Lundebye, A-K.; Kolding, J.; Kjellevold, M. Nutrient and chemical contaminant levels in five marine fish species from Angola – The EAF-Nansen Progamme. Foods 2020, 9:629. https://doi.org/10.3390/foods9050629
5. Santos, A.C.; Barbosa, S.; Pessoa, M.F.; Leal, N.; Reboredo, F.; Lidon, F.; Almeida J. Speciation, mobility and adsorption effects of various metals in sediments in an agricultural area surrounding an uranium ore deposit (Nisa, Portugal). Emir. J. Food Agric. 2018, 30: 503-514. https://doi.org/10.9755/ejfa.2018.v30.i6.1722
6. Naseri, M.; Vazirzadeh, A.; Kazemi, R.; Zaheri, F. Concentration of some heavy metals in rice types available in Shiraz market and human health risk assessment. Food Chem. 2015, 175: 243-248. https://doi.org/10.1016/j.foodchem.2014.11.109
7. Ooi, M.S.M.; Townsend, K.A.; Bennett, M.B.; Richardson, A.J.; Fernando, D.; Villa, C.A.; Gaus, C. Levels of arsenic, cadmium, lead and mercury in the branchial plate and muscle tissue of moduli rays. Mar. Pollut. Bull. 2015, 94: 251-259. https://doi.org/10.1016/j.marpolbul.2015.02.005
8. Escobar-Sánchez, O.; Gálvan-Magaña, F.; Rosíles-Martínez, R.R. Biomagnification of mercury and selenium in blue shark Prionace glauca from the Pacif Ocean off Mexico. Biol. Trace Elem.
Res. 2011, 144: 550-559. https://doi.org/10.1007/s12011-011-9040-y
9. Chavan, B.R.; Yakupitiyage, A.; Kumar, S. Mathematical modelling of drying characteristics of Indian mackerel (Rastrilliger kangurta) in solar-biomass hybrid cabinet dryer. Drying
Technol. 2008, 26: 1552-1562. https://doi.org/10.1080/07373930802466872
10. Darvishi, H.; Azadbakht, M.; Rezaeiasl, A.; Farhang, A. Drying characteristics of sardine fish dried with microwave heating. J. Saudi Soc. Agric. Sci. 2013, 12: 121-127. https://doi.org/10.1016/j.jssas.2012.09.002
11. FAO. The State of World Fisheries and Aquaculture 2018 - Meeting the sustainable development goals. 2018. Rome.
Braz. J. of Develop.,Curitiba, v. 6, n. 10, p.76897-76912,oct. 2020. ISSN 2525-8761
12. Alibas, I.; Köksal, N. Convective, vacuum and microwave drying kinetics of mallow leaves and comparison of color and ascorbic acid values of three drying methods. Food Sci. Technol. 2014, 34: 358-364. https://doi.org/10.1590/S0101-20612014005000033
13. Ozcan-Sinir, G.; Ozkan-Karabacak, A.; Tamer, C.E.; Copur, O.U. The effect of hot air, vacuum and microwave drying on drying characteristics, rehydration capacity, color, total phenolic content and antioxidant capacity of Kumquat (Citrus japonica). Food Sci. Technol. 2019, 39: 475-484. https://doi.org/10.1590/fst.34417
14. Kouhila, M.; Moussaoui, H.; Lamsyehe, H.; Tagnamas, Z.; Bahammou, Y.; Idlimam, A.; Lamharrar, A. Drying characteristics and kinetics solar drying of Mediterranean mussel (Mytilus galloprovincilis) type under forced convection. Renewable Energy 2020, 147: 833-844. https://doi.org/10.1016/j.renene.2019.09.055
15. Endo, T.; Hisamichi, Y.; Kimura, O.; Kotaki, Y.; Kato, Y.; Ohta, C.; Koga, N.; Haraguchi, K. Contamination levels of mercury in the muscle of female and male spniy dogfhises (Squalus
acanthias) caught off the coast of Japan. Chemosphere 2009, 77: 1333-1337.
https://doi.org/10.1016/j.chemosphere.2009.09.041
16. Karunanidhi, K.; Rajendran, R.; Pandurangan, D.; Arumugam, G. First report on distribution of heavy metals and proximate analysis in marine edible puffer fishes collected from Gulf of Mannar Marine Biosphere Reserve, South India. Toxicol. Rep. 2017, 4: 319–327. https://doi.org/10.1016/j.toxrep.2017.06.004
17. Vignatti, G.; Schneider, V.E.; Poletto, M. Biological assessment and metals concentration in blue shark (Prionace glauca) caught in the southeast-south coast of Brazil. Sci. Cum Ind. 2018, 6: 7-11. http://dx.doi.org/10.18226/23185279.v6iss3p7
18. Mewa, E.A.; Okoth, M.W.; Kunyanga, C.N.; Rugiri, M.N. Experimental evaluation of beef drying kinetics in a solar tunnel dryer. Renewable Energy 2019, 139: 235-241. https://doi.org/10.1016/j.renene.2019.02.067
19. Yilmaz, M.S.; Sakiyan, O.; Mazi, I.B.; Mazi, B.G. Phenolic content and some physical properties of dried broccoli as affected by drying method. Food Sci. Technol. Int. 2019, 25: 76-88. https://doi.org/10.1177%2F1082013218797527
20. Midilli, A.; Kucuk, H.; Yapar, Z. A new model for single-layer drying. Drying Technol. 2002, 20: 1503-1513. https://doi.org/10.1081/DRT-120005864
21. Sarimeseli A. Microwave drying characteristics of coriander (Coriandrum sativum L.) leaves.
Energy Convers. Manage. 2011, 52: 1449–1453.
https://doi.org/10.1016/j.enconman.2010.10.007
22. Jain, D.; Pathare, P.B. Study the drying kinetics of open sun drying of fish. J. Food Eng. 2007, 78:1315-1319. https://doi.org/10.1016/j.jfoodeng.2005.12.044
23. Lahsasni, S.; Kouhila, M.; Mahrouz, M.; Jaouhari, J.T. Drying kinetics of prickly pear fruit (Opuntia ficus indica). J. Food Eng. 2004, 61:173-179. https://doi.org/10.1016/S0260-8774(03)00084-0
Braz. J. of Develop.,Curitiba, v. 6, n. 10, p.76897-76912,oct. 2020. ISSN 2525-8761
24. Doymaz I. Sun drying of figs: an experimental study. J. Food Eng. 2005, 71:403-407. https://doi.org/10.1016/j.jfoodeng.2004.11.003
25. Duarte M.E.M.; Mata, M.E.R.M.C.; Araújo, R.D.A.; André, A.M.M.C.N.; Melo, R.B.F.; Sousa, R.V.; Nunes, R.S. Effective diffusiveness coefficient and mathematical modelling of the drying of eggplant. Braz. J. of Develop. 2020, 6: 54117-54124. https://doi.org/10.34117/bjdv6n7-891
26. Gu, Y-G.; Lin, Q.; Yu, Z-L.; Wang, X-N.; Ke, C-L.; Ning, J-J. Speciation and risk of heavy metals in sediments and human health implications of heavy metals in edible nekton in Beibu Gulf, China: A case study of Qinzhou Bay. Mar. Pollut. Bull. 2015, 101: 852-859. https://doi.org/10.1016/j.marpolbul.2015.11.019
27. Brazil. Resolução - RDC n. 42 de 29 August 2013. Dispõe sobre o regulamento técnico MERCOSUL sobre limites máximos de contaminantes inorgânicos em alimentos. Diário Oficial da União, Brasília, n. 168, p. 33, 30 August 2013.
28. Brazil. Decreto n. 55871 de 26 March 1965. Modifica o Decreto nº 50.040, 24 January 1961, referente a normas reguladoras do emprego de aditivos para alimentos, alterado pelo Decreto nº 691, de 13 March 1962. Diário Oficial da União, Poder Executivo, Brasília, 09 April 1965. 29. FAO. Compilation of legal limits for hazardous substances in fish and fishery products. In:
FAO Fishery Circular N° 764. Food and Agricultural Organization of the United Nations, Rome, 1983, 5-10.
30. World Health Organization (WHO) – Arsenic. Available online: https://www.who.int/news-
room/fact-sheets/detail/arsenic#:~:text=Long%2Dterm%20exposure%20to%20arsenic,increased%20dea ths%20in%20young%20adults. (accessed on 30 08 2020).
31. WHO. Quality directive of potable water. 2nd ed. WHO, 1994, p.197.
32. Gu, Y-G.; Lin, Q.; Wang, X-N.; Du, F-Y.; Yu, Z-L.; Huang, H-H. Heavy metal concentration in wild fishes captured from the South China Sea and associated health risks. Mar. Pollut. Bull. 2015, 96: 508-512. https://doi.org/10.1016/j.marpolbul.2015.04.022
33. RDA. Recommended Dietary Allowance, tenth ed. National Academic Press, 1989, Washington, DC.
34. WHO – Mercury and health. Available online: https://www.who.int/news-room/fact-sheets/detail/mercury-and-health (accessed on 30 08 2020).
35. Rajeshkumar, S.; Li, X. Bioaccumulation of heavy metals in fish species from the Meiliang Bay, Taihu Lake, China. Toxicol. Rep. 2018, 5: 288–295. https://doi.org/10.1016/j.toxrep.2018.01.007
36. Tenuta-Filho, A.; Nascimento, E.S. Review: mercury in shark. Occurrences and possibility or removal. Braz. J. Food Technol. 2007, 10: 78-85.
Braz. J. of Develop.,Curitiba, v. 6, n. 10, p.76897-76912,oct. 2020. ISSN 2525-8761
37. US EPA (United States Environmental Protection Agency). Risk-based concentration table. Region 3, Philadelphia. PA. 2011.
38. JECFA (Joint Food and Agriculture Organization/World Health Organization Expert Committee on Food Additives). In: Summary and conclusions of the 61st Meeting of the Join FAO/WHO Expert Committee on Food Additives, 2003.
39. Zerizghi, T.; Yang, Y.; Wang, W.; Zhou, Y.; Zhang, J.; Yi, Y. Ecological risk assessment of heavy metal concentrations in sediments and fish of a shallow lake: a case study of Baiyangdian Lake, North China. Environ. Monit. Assess. 2020, 192: 154. https://doi.org/10.1007/s10661-020-8078-8
40. FAO – Fishery and Aquaculture Country Profiles – The Federative Republic of Brazil. Available online: http://www.fao.org/fishery/facp/bra/en#CountrySector-Statistics (accessed on 30 08 2020).