E S T U D O S I I
Cidadania, Instituições e Património
Economia e Desenvolvimento Regional
Finanças e Contabilidade
Gestão e Apoio à Decisão
Modelos Aplicados à Economia e à Gestão
Faculdade de Economia da Universidade do Algarve
F
COMISSÃO EDITORIAL António Covas
Carlos Cândido Duarte Trigueiros Efigénio da Luz Rebelo João Albino da Silva João Guerreiro
Paulo M.M. Rodrigues Rui Nunes
_______________________________________________________________________ FICHA TÉCNICA
Faculdade de Economia da Universidade do Algarve Campus de Gambelas, 8005-139 Faro
Tel. 289817571 Fax. 289815937 E-mail: [email protected]
Website: www.ualg.pt/feua Título
Estudos II - Faculdade de Economia da Universidade do Algarve Autor
Vários Editor
Faculdade de Economia da Universidade do Algarve Morada: Campus de Gambelas
Localidade: FARO Código Postal: 8005-139 Capa e Design Gráfico Susy A. Rodrigues
Compilação, Revisão de Formatação e Paginação Lídia Rodrigues
Fotolitos e Impressão Grafica Comercial – Loulé ISBN 972-99397-1-3 Data: 26-08-2005 Depósito Legal 218279/04 Tiragem 250 exemplares Data Novembro 2005
RESERVADOS TODOS OS DIREITOS REPRODUÇÃO PROIBIDA
Tourism and sustainable development: Algarve (Loulé) case
study
Maria de Fátima M. Laginha Louro
Faculdade de Economia, Universidade do Algarve
João Albino Silva
Faculdade de Economia, Universidade do Algarve
Resumo
A partir do conceito de Desenvolvimento Sustentável, o objectivo deste estudo é o de tentar operacionalizá-lo, tendo como objecto de estudo o concelho de Loulé, um dos mais representativos do turismo da região do Algarve.
Neste conceito está implícito o desafio de criar as condições para ir ao encontro das necessidades e aspirações das pessoas envolvidas, no presente e no futuro.
Na realidade, desde o despertar da consciência dos decisores até à criação de oportunidades de política para o Desenvolvimento Sustentável há um grande fosso que é preciso avaliar para se poder posteriormente reduzir e eventualmente transpor.
A linha mestra deste estudo é o desenvolvimento que se apresenta como um conceito global e pluridisciplinar e por esse facto considera-se que a abordagem mais correcta será a abordagem sistémica que, considerando o turismo como um instrumento do desenvolvimento, permita identificar vários cenários de desenvolvimento para a realidade em estudo.
Atendendo à complexidade e amplitude de questões que engloba o conceito de D.S., com particular ênfase para o sistema de valores a ele subjacente, procura seguir-se uma metodologia que englobe quer os aspectos qualitativos quer os aspectos quantitativos do D.S. e que permita operacionalizar o conceito a uma escala local.
A metodologia proposta neste trabalho, baseada na dinâmica de sistemas, tem a grande vantagem de poder ser aplicada de uma forma transparente e interactiva, com possibilidade de actualização constante de dados por forma a melhorar a compreensão do comportamento do sistema em estudo, não esquecendo no entanto as partes que o constituem.
Palavras-chave: Desenvolvimento Sustentável; Desenvolvimento Turístico
Sustentável; Abordagem Sistémica; Modelização; Dinâmica de Sistemas; Escala Local de Operacionalização.
Abstract
The main purpose of this study is to make Sustainable Development (S.D.) become operative. The target chosen is Loulé municipality in Algarve.
The guideline of this research is the development, as a global and multidisciplinary concept. Therefore, considering the literature, it is thought that the most correct approach will be the systemic one.
In this way tourism is considered to be a development tool that allows the identification of various scenarios for the reality under analysis.
Considering the complexity and variety of questions arising from the S.D. concept with particular emphasis on its intrinsic value system, we try to look for a methodology that can include both, the qualitative and quantitative aspects of S.D. and permit the concept to become effective at a local scale.
The proposed methodology based on dynamic of systems has the possible advantage to be applied in a clear and interactive way with the possibility of updating data or other elements in order to improve the understanding of the system under analysis and its main parts.
Keywords: Sustainable Development; Sustainable Tourism Development; Systemic
Approach; Modelling; Dynamic System Model; Local Scale.
1. Introduction
The concept of Sustainable Development (S.D.) has been largely accepted but also largely discussed in terms of difficulties and aspects that permit this concept to become effective.
Sustainable Development implies the challenge of creating the required conditions to meet the involved people´s needs and desires at present and in future. (WCED,1987).
Bearing in mind this challenge, the problem studied in this paper is:
From the decision maker´s awareness to the creation of political opportunities for S.D., there is a big gap that is necessary to be evaluated in order to reduce or, if possible, overcome in the near future.
Indeed, the research and political debate about S.D. is very recent (W.C.E.D.,1987). This means some consensus but also a clear lack of guidanceThrough this concept of S.D. it is intended to balance economic, social and environmental objectives and to consider anthropocentric and ecocentric aspects.
Tourism and sustainable development: Algarve (Loulé) case study
Some authors consider this concept extremely simple in its essence and extremely complex in practice.
(Blowers, 1992:25-28; Correia, 1992:5)
However, the complexity of the (S.D.) concept, being a strong restriction, can’t obstruct its application.
(Clark, Trejo and Allen, 1995:67,73)In terms of Regional Sustainable Development, some authors have been studying models with an effective focus (case study of Greek Islands or Mexico).
(Nijkamp and Bergh, 1991:11; Nijkamp and Giaoutzi, 1993:14-17; Kandelaars, 2000:708)
It is this research line that is followed with the study of a model that allows the S.D. concept to become effective at a local scale (Loulé Council). This is one of the most representative tourism municipalities in the Algarve region.
What is then the relation between Sustainable Tourism Development (S.T.D.) and Sustainable Development (S.D.) ?
The state of the art about this issue seems to lead to a relative consensus about the need to integrate S.T.D. in the S.D. strategy.
(Hunter, 1995:160; Butler, 1999:49; Sharpley, 2000:3,9; Silva and Perna, 2002:2-4)
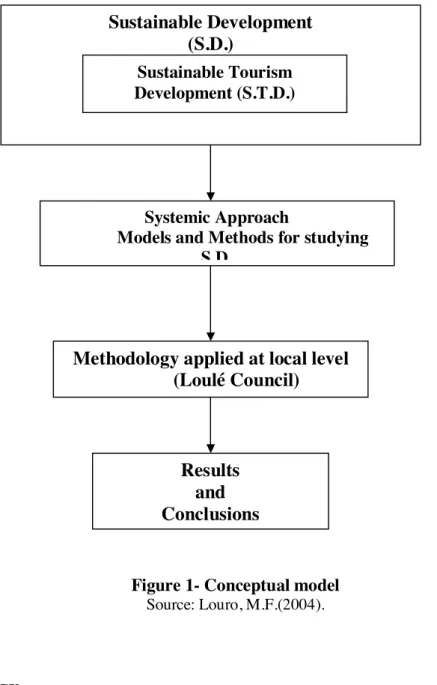
The conceptual model considered in this paper follows this integration as well as a systemic approach based on dynamic of systems and multidisciplinary approach.
Therefore, based on the literature, this paper adds to the discussion through this systemic approach and its specific focus upon Loulé council (local scale).
Figure 1- Conceptual model
Source: Louro, M.F.(2004).
2. Methodology
“The main benefit of the models for the study of Sustainable Development is the contribution for a better observation of dynamic attributes of environmental and economic systems.”
(Bergh, 1991:15-16)
“Differences in Model approaches must not be seen as inconsistent but as a complement because it’s impossible to consider just one model structure.”
(Bergh and Hofkes, 1998:7-11)
In this study it is intended to follow these and other authors suggestions and use scientific tools in order to allow the S.D. concept to become effective at local scale.
Sustainable Development (S.D.)
Sustainable Tourism Development (S.T.D.) Systemic Approach
Models and Methods for studying S.D.
Methodology applied at local level (Loulé Council)
Results and Conclusions
Tourism and sustainable development: Algarve (Loulé) case study
(Forrester, 1961:23,44,49; Le Moigne, 1983:22,58,73; Nijkamp and Bergh, 1991:11; Nijkamp and Giaoutzi, 1993:15; Aracil and Gordillo 1997:19,20; Bergh and Hofkes, 1998:7-11; Graaf, Musters and Keurs, 1999:22,30,36)
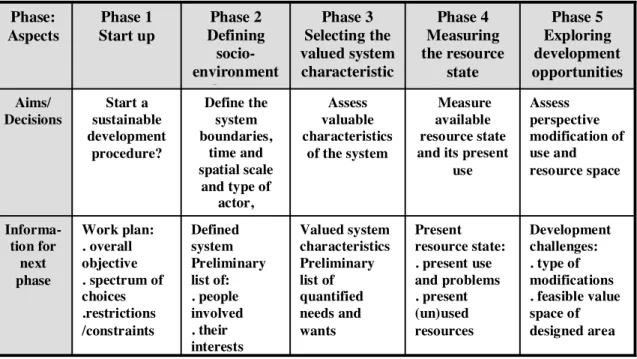
The adopted methodology is in part the one proposed by Graaf, Musters and Keurs (1999:112-125) who defend the connection among several concepts and methods in order to consider a new model for S.D.
This methodology considers five phases, which in short are:
Figure 2- Summary of the important aspects of the five phases of information-gathering. Development challenges: . type of modifications . feasible value space of designed area Present resource state: . present use and problems . present (un)used resources Valued system characteristics Preliminary list of quantified needs and wants Defined system Preliminary list of: . people involved . their interests Work plan: . overall objective . spectrum of choices .restrictions /constraints Informa- tion for next phase Assess perspective modification of use and resource space Measure available resource state and its present
use Assess valuable characteristics of the system Define the system boundaries, time and spatial scale and type of actor, activities and Start a sustainable development procedure? Aims/ Decisions Phase 5 Exploring development opportunities Phase 4 Measuring the resource state Phase 3 Selecting the valued system characteristic s Phase 2 Defining socio-environment al system Phase 1 Start up Phase: Aspects
Source: Graaf et al. (1999)
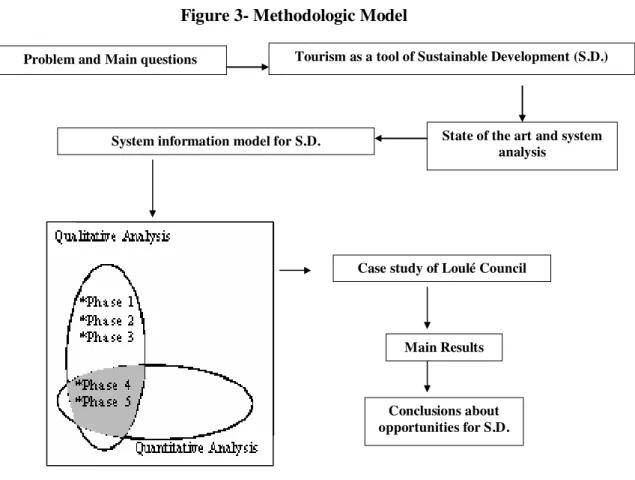
For studying the problem and main questions, tourism comes as a tool of Sustainable Development.It is considered a system approach in which S.D. model is included.
This one contains qualitative analysis (phases one to five) and quantitative analysis (phases four and five).With this system information model it is intended to create development opportunities for the reality under study.
Figure 3- Methodologic Model
System information model for S.D.
Case study of Loulé Council
Conclusions about opportunities for S.D.
Main Results
Problem and Main questions Tourism as a tool of Sustainable Development (S.D.)
State of the art and system analysis
Source: Louro,M.F.(2004)
In the scope of qualitative analysis the main actors in Loulé Council Development were identified for inquiry purpose.
(Representative of the Municipality and other Institutions, local Association, N.G.O´s...)
The inquiry guide was adopted from Guide for Local Planners - W.T.O.(1993) and for research finding the content analysis was considered.
Quantitative analysis included in phases four and five of the adopted methodology is based on dynamic of systems and is aimed at finding answers to:
A better understanding of the effects of tourism in Loulé Council. An explanation of the interaction among parts of the studied system.
The dynamic model gives a vision of the relation between structure and behaviour of the system under study.
The structure of the dynamic of systems model has three main levels,as shown in figure 4.
Tourism and sustainable development: Algarve (Loulé) case study
Figure 4- Dynamic of Systems Model
The diagram of systems (medium level) represents the interactions among five sectores considered in the model and indicates the dynamic organization principle of "story" case study (hypothesis)
These hypotheses are:
• A high growth of tourism in council will cause great damage upon environment.
• Beach quality depends on public efforts, being sea water quality represented in the model by blue flag effect.
• Population and tourists affect sea water quality and this one affects the number of tourists.
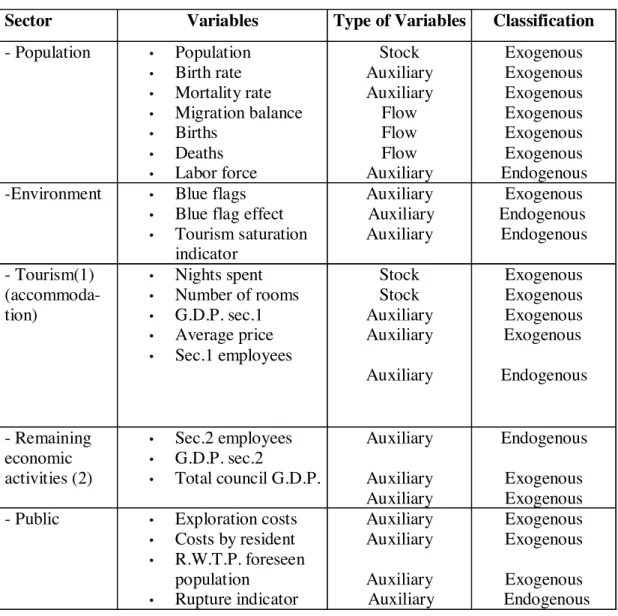
• Remaining Economic Activities sector receives the effects of touristic demand. Each sector contains the most representative variables (exogenous and endogenous) and the model simulates real system under study and helps to understand the relations between the structure and behaviour of this system.
Lower level of the model makes explicit mathematical relations among variables considered in each sector (Appendix) and is corresponding to the diagram of systems (medium level).
There are three types of variables considered in the model: stock;flow and auxiliary.(figure 5)
Difference equations refer to the stock variables and include their "in and out flows" as represented in the diagram of systems (figure 6).
Figure 5- Types of variables
Sector Variables Type of Variables Classification
- Population • Population • Birth rate • Mortality rate • Migration balance • Births • Deaths • Labor force Stock Auxiliary Auxiliary Flow Flow Flow Auxiliary Exogenous Exogenous Exogenous Exogenous Exogenous Exogenous Endogenous
-Environment • Blue flags
• Blue flag effect • Tourism saturation indicator Auxiliary Auxiliary Auxiliary Exogenous Endogenous Endogenous - Tourism(1) (accommoda-tion) • Nights spent • Number of rooms • G.D.P. sec.1 • Average price • Sec.1 employees Stock Stock Auxiliary Auxiliary Auxiliary Exogenous Exogenous Exogenous Exogenous Endogenous - Remaining economic activities (2) • Sec.2 employees • G.D.P. sec.2 • Total council G.D.P. Auxiliary Auxiliary Auxiliary Endogenous Exogenous Exogenous
- Public • Exploration costs
• Costs by resident • R.W.T.P. foreseen population • Rupture indicator Auxiliary Auxiliary Auxiliary Auxiliary Exogenous Exogenous Exogenous Endogenous Source: Louro,M.F.(2004)
Source: Louro, M. F. (2004) Figure 6: Diagram of systems
Diagram of Systems
Population Births ~ Birth rate Deaths ~ Mortality rate ~ Migration balance ~Sector 1 Employed percentage GDP sec1
Number of beaches with blue flag
~
Blue flags
Blue flag effect
Exploration costs ~ Costs by resident Labor force Number of rooms Nights spent New rooms Rooms out d in d out Receipts ~ Average price ~ Working rate Sector 2 GDP Sec1 Employees ~ Sector 2 Employed percentage Tourism saturation
indicator Total council GDP
Rupture indicator Sector 2 Employees ~ Algarve GDP Project population d r Population Sector Environment Sector
Tourism Sector (1) - (accommodation)
Public Sector
For the scenario analysis (upper level of the dynamic of systems model- figure 4) the exogenous variable - number of rooms - was considered as a notable one.
The political variable considered in the model is the investment of the Municipality in the bulding and reinforcement of Residual Water Treatment.
The assumptions are:
• In peak season, the present population is 2,2 x resident population.
• Consideration of a rupture indicator of Residual Water Treatment Plants
(R.W.T.P.).
seasonality increased population Rupture indicator (R.I) = ---
Foreseen population
This indicator has implications in the blue flag effect: If R.I < 0,8 the blue flag effect =1 If R.I ≥ 0,8 the blue flag effect =0
• Consideration of a tourism saturation indicator (People/km2) (T.S.I.).
PSV + Resident Population
T.S.I= --- Area
PSV= Peak season visitors. Scenario hypotheses are:
Hypothesis one - Trend scenario
If the annual growth rate of the number of rooms variable is about 1,6%,the political variable will have a ligth increase and the rupture indicator (R.W.T.P.) will be near its edge.
Hypothesis two - High growth scenario
If the annual growth rate of the number of rooms variable is about 5%, the political variable will intensively grow and the rupture indicator(R.W.T.P.) will overcome its critical entrance.
Hypothesis three - Levelled - off scenario
If the annual growth rate of the number of rooms variable is about 1%, the political variable will assume minor value and the rupture indicator (R.W.T.P.) will not have critical value.
These scenarios were tested through the simulation algorithm (using Stella package) and the main results obtained are summarized in the next section- quantitative analysis.
_________________________Tourism and sustainable development: Algarve (Loulé) case study
3. Main results
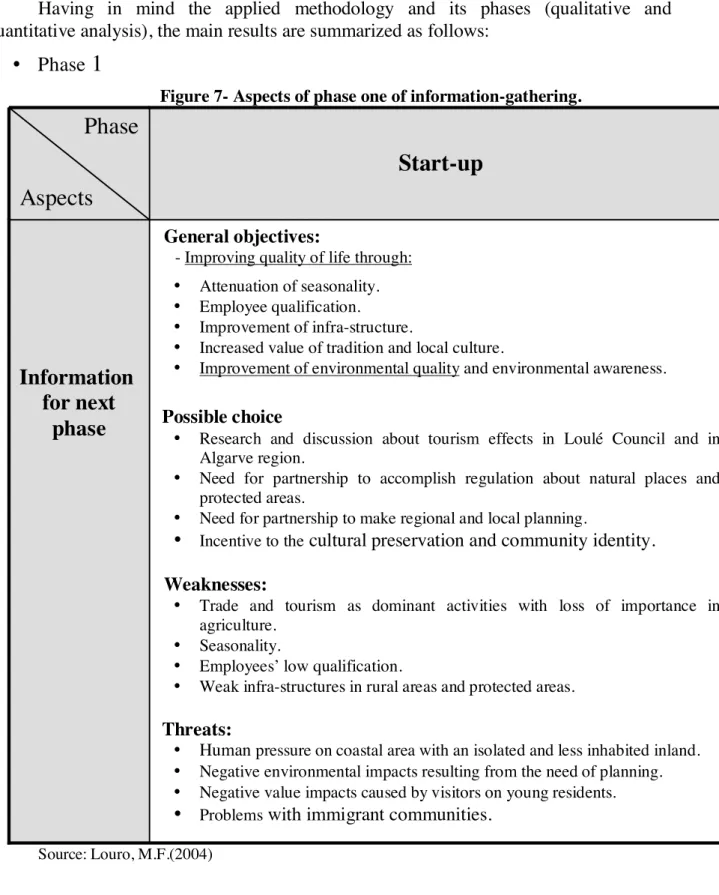
Having in mind the applied methodology and its phases (qualitative and quantitative analysis), the main results are summarized as follows:
• Phase
1
Figure 7- Aspects of phase one of information-gathering.
Source: Louro, M.F.(2004)
General objectives:
- Improving quality of life through: • Attenuation of seasonality. • Employee qualification.
• Improvement of infra-structure.
• Increased value of tradition and local culture.
• Improvement of environmental quality and environmental awareness.
Possible choice
• Research and discussion about tourism effects in Loulé Council and in Algarve region.
• Need for partnership to accomplish regulation about natural places and protected areas.
• Need for partnership to make regional and local planning.
• Incentive to the cultural preservation and community identity.
Weaknesses:
• Trade and tourism as dominant activities with loss of importance in agriculture.
• Seasonality.
• Employees’ low qualification.
• Weak infra-structures in rural areas and protected areas.
Threats:
• Human pressure on coastal area with an isolated and less inhabited inland. • Negative environmental impacts resulting from the need of planning. • Negative value impacts caused by visitors on young residents.
• Problems with immigrant communities.
Information
for next
phase
Start-up
Phase
Aspects
• Phase 2
Figure 8 - Phase two of information-gathering
Source: Louro,M.F.(2004)
Characteristics
• In natural definition of Loulé council areas, the hill and neighbouring area represent 50% and the coastline represents 12%. The "barrocal" represents the remainder.
• Loulé council is representative in demographic terms (1st in resident population in the Algarve region - 2001 census) but with a low inland population density. • Tourism growth contributes to the settlement of new population for working
and living.
• Tourism and commerce are dominant economic activities and agriculture has been decreasing along the time.
Problems
• Tourism growth has been causing economic and social unbalances among natural areas of the council.
• Inland population is getting older and the youngest people choose the coastline to live and work.
• Sazonality in tourism activity.
• Low qualification of working population.
• Infra-strutures are not conceived according to the population needs or to the environmental capacity.
• Health and safety conditions don´t meet the population needs
Potentialities
• Beyond "sun and sea" tourism product, Loulé council has other potentialities:
Classified natural places ("Rocha da Pena"; "Fonte Benémola" and "Ria Formosa").
Sports and cultural activities. Cultural and Historic heritage. Gastronomy and handicraft.
Information
for next
phase
Defining socio-environmental system
Phase
Aspects
_________________________Tourism and sustainable development: Algarve (Loulé) case study
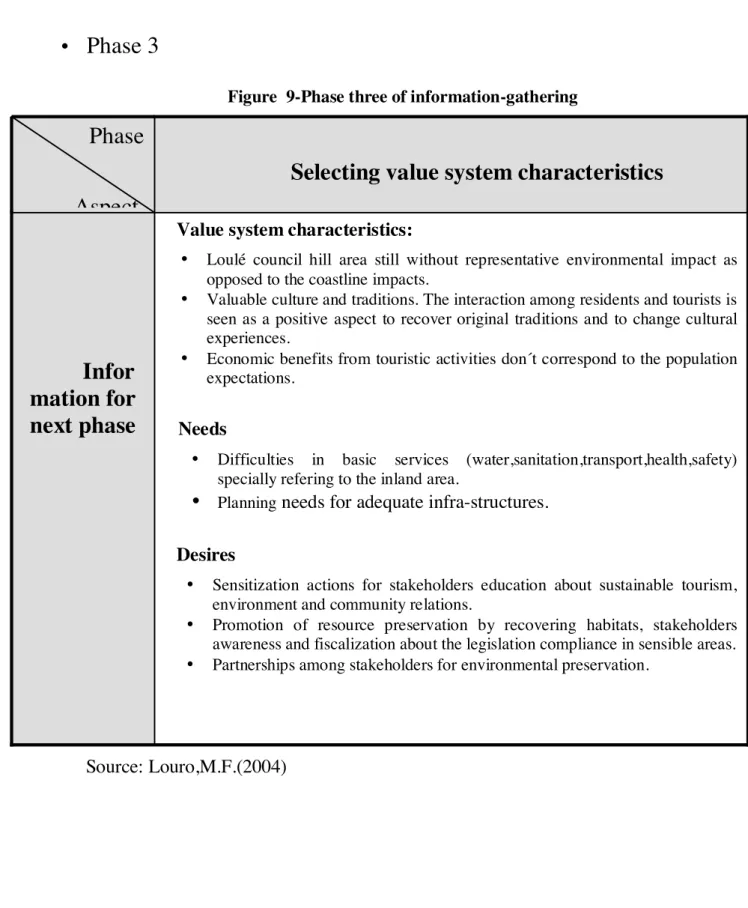
•
Phase 3
Figure 9-Phase three of information-gathering
Source: Louro,M.F.(2004)
Value system characteristics:
• Loulé council hill area still without representative environmental impact as opposed to the coastline impacts.
• Valuable culture and traditions. The interaction among residents and tourists is seen as a positive aspect to recover original traditions and to change cultural experiences.
• Economic benefits from touristic activities don´t correspond to the population expectations.
Needs
• Difficulties in basic services (water,sanitation,transport,health,safety) specially refering to the inland area.
• Planning needs for adequate infra-structures.
Desires
• Sensitization actions for stakeholders education about sustainable tourism, environment and community relations.
• Promotion of resource preservation by recovering habitats, stakeholders awareness and fiscalization about the legislation compliance in sensible areas. • Partnerships among stakeholders for environmental preservation.
Infor
mation for
next phase
Selecting value system characteristics
Phase
Aspect
•
Phase 4
Measuring the resource state
Concerning the quantitive analysis (phase 4), its objective is to determine the resource state and present use.
The obtained results confirm the hypotheses as in the high growth scenario the rupture indicator will overcome its critical edge in 2006. Also, in this scenario, tourism saturation indicator reveals high values, which means congestion.
This has environmental consequences represented in the model by the blue flag effect (non obtained - logical value zero).
Population and tourists quality of life will be affected.
Trend scenario is a feasible scenario assuming the compatibility among considered environmental variables and economic variables related with economic Loulé council growth.
Levelled-off scenario reveals a desirable scenario in the assumptions of the model considering environmental preservation and people well-being.
However this is the least dynamic in economic terms.
The scenario results from dynamic model are represented in the following figures (10 to 15).
_________________________Tourism and sustainable development: Algarve (Loulé) case study
Figure 10- Number of rooms - scenario results for Loulé council
Number of Rooms 4.000 4.500 5.000 5.500 6.000 6.500 7.000 7.500
Levelled off scenario High growth scenario Trend scenario Source: Louro,M.F.(2004) 1 9 8 7 1 9 8 8 1 9 8 9 1 9 9 0 1 9 9 1 1 9 9 2 1 9 9 3 1 9 9 4 1 9 9 7 1 9 9 8 1 9 9 5 1 9 9 6 1 9 9 9 2 0 0 0 2 0 0 1 2 0 0 2 2 0 0 3 2 0 0 4 2 0 0 5 2 0 0 6 2 0 0 7
Figure 11- Residual water treatmeant costs- scenario results for Loulé council
Residual Water Treatment Plants(R.W.T.P.) Costs (€) 100.000 300.000 500.000 700.000 900.000 1.100.000
Levelled off scenario High growth scenario Trend scenario Source: Louro,M.F.(2004) 19 87 19 88 19 89 19 90 19 91 19 92 19 93 19 94 19 97 19 98 19 95 19 96 19 99 20 00 20 01 20 02 20 03 20 04 20 05 20 06 20 07
_________________________Tourism and sustainable development: Algarve (Loulé) case study
Figure 12- Rupture indicator percentage -scenario results for Loulé council
Rupture indicator (%) 0 10 20 30 40 50 60 70 80 90 100
Levelled off scenario High growth scenario Trend scenario Source: Louro,M.F.(2004) 19 87 19 88 19 89 19 90 19 91 19 92 19 93 19 94 19 97 19 98 19 95 19 96 19 99 20 00 20 01 20 02 20 03 20 04 20 05 20 06 20 07
Figure 13- Blue flag effect logical values- scenario results for Loulé council
Blue flag effect
0 1
Levelled off scenario High growth scenario Trend scenario Source: Louro,M.F.(2004) 1 9 8 7 1 9 8 8 1 9 8 9 1 9 9 0 1 9 9 1 1 9 9 2 1 9 9 3 1 9 9 4 1 9 9 7 1 9 9 8 1 9 9 5 1 9 9 6 1 9 9 9 2 0 0 0 2 0 0 1 2 0 0 2 2 0 0 3 2 0 0 4 2 0 0 5 2 0 0 6 2 0 0 7
_________________________Tourism and sustainable development: Algarve (Loulé) case study
Figure 14- Population -scenario results for Loulé council
Population 15.000 25.000 35.000 45.000 55.000 65.000 75.000 85.000 1987 1988 1989 1990 1991 1992 1993 1994 1995 1996 1997 1998 1999 2000 2001 2002 2003 2004 2005 2006 2007
Levelled off scenario - Total Population High growth scenario - Total Population Trend scenario - Total Population
Figure 15- Tourism saturation indicator -scenario results for Loulé council
Tourism saturation indicator (People/km2) 200 250 300 350 400 450 500 . . . .
Levelled off scenario High growth scenario Trend scenario Source: Louro,M.F.(2004) 19 87 19 88 19 89 19 90 19 91 19 92 19 93 19 94 19 97 19 98 19 95 19 96 19 99 20 00 20 01 20 02 20 03 20 04 20 05 20 06 20 07
_________________________Tourism and sustainable development: Algarve (Loulé) case study
•
Phase 5
Figure 16- Phase five of information-gathering
Exploring development opportunities
Development challenges
- Sensible space:
• Need for sustainable, controlled and balanced use of still available natural resources. • Need for studying the regeneration capacity of the resource, case by case, as
environmental cost of negligent management of the resources will not be available for future generations.
• Overuse of public infra-structures forced by seasonality provokes maintenance problems.
• Need for reinforced investment to compensate this overuse. • Need for an integrated urban and tourist planning.
• Need for partnership to obtain quality and sustainable projects
-
Type of changes:• Inland still has great potential for a sustainable model.
• Tourist products that can be developed are related with nature and traditions.
• These products must be developed with residents` involvement and attention to the environment.
• Cooperation between public and private sector is crucial to the partnership for Sustainable Development.
• Stakeholders’ general worry about an effective coordination of that cooperation between sectors.
• Stakeholders’ general worry about the absence of the essential development model. • Great emphasis on the University role in all this process.
4. Conclusions
Considering the studied problem above, the main conclusions are:
- Some sensitivity by stakeholders to the issues of Sustainable Development but also some lack of knowledge about its problems
- Need for coordinated action by all stakeholders to reach S.D..
- Need for new mechanisms that assure a decision-making process for S.D..
- Possible application of a methodology which contains qualitative and quantitative aspects of S.D..
This methodology could be a support to the decision-making process because:
- Facilitates a systemic and interdisciplinary vision of the studied reality. - Makes possible the discussion and partnership among stakeholders. - Makes possible different scenarios for the reality under study.
- Facilitates an interactive application with the possibility to include new data or new elements.
Some limitations of this study were:
- Need for an interdisciplinary team for a better application of the proposed methodology.
- Lack of data, that implies reformulation of some sectors of the model namely in the environment sector.
- Scarce knowledge about new relations considered among some variables of the model.
- Information difficulties related with questionnary answers. We seek to demonstrate in this study that:
• The type of information, management and participation of the main actors are fundamental aspects to the creation of opportunities for Sustainable Development.
• The Development needs partnerships in order to obtain more sustainable projects.
• The tourism may be a tool of S.D. if it is totally included in the objectives of S.D..
• The involvement and responsibility of all stakeholders mean a gain for everyone and solidarity to the future generations.
_________________________Tourism and sustainable development: Algarve (Loulé) case study
References
Aracil, J.; Gordillo, F. (1997) Dinâmica de Sistemas, Alianza Editorial.
Bergh, J.; Hofkes, M. (Editors) (1998) – Theory and Implementation of Economic Models for
Sustainable Development – Kluwer Academic Publishers
Bergh, J. (1991) Dynamic Models for Sustainable Development, Amsterdam, Thesis Publishers.
Blowers, A. (1992) Sustainable Urban Development: the political prospects, in Sustainable Development and Urban Forum European Research in Regional Science – E.R.R.S.- M. J. Breheny Editor.
Butler, R. (1999) Tourism, natural resources and remote areas, A.P.D.R. – XII Summer Institute of the European Regional Science Association (Julho)
Clark, N.; Trejo, P.; Allen, P. (1995) Evolutionary Dynamics and Sustainable Development: A
Systems approach, Edward Edgar Publishing.
Correia M. (1992)- Homo-Sapiens: Uma Espécie em Extinção, II forum ecologista, Lisboa (30-31 Maio).
D.G.T. Preços médios por dormida Algarve, 1987-2001. Forrester, J. (1961) Industrial Dynamics, Pegasus.
Graaf, H.; Musters, C.; Keurs W. (1999) Regional Opportunities for Sustainable Development
– Theory, Methods and Applications, Kluwer Academic Publishers.
INE, Anuários Estatísticos da região do Algarve 1994-1999;2000.
Hunter, C. (1995) On the Need to Re-Conceptualise Sustainable Tourism Journal of
Sustainable Tourism, vol. 3, nº 3.
Kandelaars, P. (2000) Tourism in the Yucatan Peninsula, Mexico: Modelling its Interactions
with the Population and the Environment, XII Summer Institute of the European Regional
Science Association.
Le Moigne, J. (1983) La theórie du système général, PUF.
Lopes, A. (1984) Desenvolvimento Regional - Problemática, Teoria e Modelos, Fundação Calouste Gulbenkian.
Louro ,M.F. (2004) Turismo e Desenvolvimento Sustentável: Uma Aplicação à Escala Local.
O Caso do Concelho de Loulé, Tese de Doutoramento, Faculdade de Economia,
Universidade do Algarve.
Nijkamp, P.; Bergh J. (1991) Operationalizing Sustainable Development Dynamic Ecological Economic Models, Ecological Economics, 4. Amsterdam.
Nijkamp, P.; Giaoutzi, M. (1993) Decision Support Models for Regional Sustainable
Development, England, Avebury.
Sharpley, R. (2000) Tourism and Sustainable Development: Exploring the Theoretical Divide,
Journal of Sustainable Tourism, vol.8, nº1,
Silva, J.; Perna F. (2002) Turismo e Desenvolvimento Auto-sustentado, Compêndio de Economia Regional, A.P.D.R.
Van den Belt, M.; Videira, N.; Antunes, P.; Santos, R.; Gamito, S. (2000) Modelação
Participada na Ria Formosa, Fundação do Mar e Fundação Luso-Americana para o Desenvolvimento.
Appendix
High growth scenario equations
Note: In this appendix are represented the mathematical relations among variables
considered in each sector of the model. Those relations are only referring to high growth scenario as an example of a greater effect upon environment (considered in the model through Rupture indicator, Tourism saturation indicator and blue flag effect).
- "Public sector"
exploration costs = Population * exploration costs by resident Rup_ind = 2.2*population/foreseen population
Foreseen population = 216780
Source: Author´s calculation based on Loulé Municipality´s data
Medium exploration costs : (€/inhabitant)
(1987, 7.17), (1988, 7.17), (1989, 7.17), (1990, 7.17), (1991, 7.17), (1992, 7.17), (1993, 7.17), (1994, 7.17), (1995, 7.17), (1996, 7.17), (1997, 7.90), (1998, 8.34), (1999, 9.75), (2000, 12.5), (2001, 13.4), (2002, 13.4), (2003, 13.4), (2004, 13.4), (2005, 13.4), (2006, 13.4), (2007, 13.4)
_________________________Tourism and sustainable development: Algarve (Loulé) case study
- "Tourism Sector" (1) - (accommodation)
Nights spent(t) = nights spent(t - dt) + (d__in - d__out) * dt Inicial number of nights spent (1987) = 1469553
Source: INE (National Statistics Office- yearly data as from 1994) IN:
d__in = nights spent*d_r
OUT:
d__out = 0
Number of rooms(t) = number of rooms(t - dt) + (new rooms - rooms_out) * dt
Inicial number of rooms (1987) = 4220
Source: INE (National Statistics Office- yearly data as from 1994).
IN:
New rooms = d__in/540.5
(540,5 relates night spent increase with bedrooms increase)
OUT:
rooms_out = 0.0*number of rooms
d_r=IF(TIME>=2000) THEN( 0.05) ELSE(0.0281) sec_1 employees = labor force*sec1_ employed percentage
G.D.P_sec1 =0.1205* total_council GDP receipts = average price*nights spent
sec1_ employed percentage: (1987, 0.07), (1988, 0.07), (1989, 0.07), (1990, 0.07), (1991, 0.07), (1992, 0.07), (1993, 0.07), (1994, 0.108), (1995, 0.105), (1996, 0.126), (1997, 0.145), (1998, 0.126), (1999, 0.163), (2000, 0.12), (2001, 0.12), (2002, 0.12), (2003, 0.12), (2004, 0.12), (2005, 0.12), (2006, 0.12), (2007, 0.12)
Source: INE (National Statistics Office-people at work in societies by territory)
Average price: (€/Nights spent) (1987, 21.6), (1988, 23.3), (1989, 22.1), (1990, 21.4), (1991, 19.1), (1992, 19.6), (1993, 18.8), (1994, 18.1), (1995, 17.6), (1996, 18.1), (1997, 18.1), (1998, 18.6), (1999, 18.4), (2000, 20.6), (2001, 23.5), (2002, 23.5), (2003, 23.5), (2004, 23.5), (2005, 23.5), (2006, 23.5), (2007, 23.5)
Source: Author´s calculation based on the spent night average price- Algarve INE/DGT (Tourism Board)
- "Environment Sector”
Blue flag effect = IF(Ind_rup>=0.8)THEN(0) ELSE(Ind_rup<0.8)=(1)
TurSatInd = (.416*nights spent/90+.3496*population)/100.96
Nr of beaches with blue flag = blue flag effect*blue flags Nr of blue flags:
(Note: Zero means non obtained blue flag).
(1987, 5.00), (1988, 5.00), (1989, 5.00), (1990, 5.00), (1991, 5.00), (1992, 0.00), (1993, 6.00), (1994, 6.00), (1995, 5.00), (1996, 5.00), (1997, 5.00), (1998, 5.00), (1999, 6.00), (2000, 6.00), (2001, 6.00), (2002, 6.00), (2003, 6.00), (2004, 6.00), (2005, 6.00), (2006, 6.00), (2007, 6.00)
_________________________Tourism and sustainable development: Algarve (Loulé) case study
- "Population Sector"
population(t) = population(t - dt) + (births + migration balance- deaths) * dt Inicial population (1987) = 45230
Source: INE (National Statistics Office- Resident population forecasts) IN:
births = birth rate*population Migration balance :
(1987, 546), (1988, 668), (1989, 547), (1990, 270), (1991, 129), (1992, 418), (1993, 337), (1994, 210), (1995, 457), (1996, 417), (1997, 451), (1998, 304), (1999, 8958), (2000, 1473), (2001, 3575), (2002, 3789), (2003, 4017), (2004, 4258), (2005, 4513), (2006, 4784), (2007, 0.00)
Source: Author´s calculation based on population and demographic indicators (INE).
OUT:
deaths = mortality rate*population labor force = population*working rate Working rate:
(Note: from 1987 to 1991 was assumed the value of 1991)
(1987, 0.408), (1988, 0.408), (1989, 0.408), (1990, 0.408), (1991, 0.408), (1992, 0.415), (1993, 0.423), (1994, 0.43), (1995, 0.438), (1996, 0.446), (1997, 0.454), (1998, 0.462), (1999, 0.471), (2000, 0.479), (2001, 0.488), (2002, 0.496), (2003, 0.505), (2004, 0.514), (2005, 0.524), (2006, 0.533), (2007, 0.543)
Source: INE –2001 Census, and author´s calculation for the other years Mortality rate :
(1987, 0.013), (1988, 0.013), (1989, 0.013), (1990, 0.014), (1991, 0.0148), (1992, 0.0139), (1993, 0.0139), (1994, 0.0129), (1995, 0.0145), (1996, 0.0136), (1997, 0.0136), (1998, 0.013), (1999, 0.013), (2000, 0.0127), (2001, 0.012), (2002, 0.012), (2003, 0.012), (2004, 0.012), (2005, 0.012), (2006, 0.012), (2007, 0.012)
Birth rate :
(1987, 0.012), (1988, 0.013), (1989, 0.014), (1990, 0.012), (1991, 0.013), (1992, 0.0133), (1993, 0.0127), (1994, 0.0112), (1995, 0.0108), (1996, 0.0118), (1997, 0.0119), (1998, 0.012), (1999, 0.0117), (2000, 0.0122), (2001, 0.0122), (2002, 0.012), (2003, 0.012), (2004, 0.012), (2005, 0.012), (2006, 0.012), (2007, 0.0122)
Source: INE – Demography and author´s calculation from 1987 to 1990.
- "Remaining economic activities sector"
sec_2 employees = labor force * sec_2 employed percentage sec_2 GDP = .8795*Total council GDP
Total council GDP = .132*GDPAlgarve Fiscal revenue = .036*GDP Total council GDP sec_2 employed percentage:
(1987, 0.93), (1988, 0.93), (1989, 0.93), (1990, 0.93), (1991, 0.93), (1992, 0.93), (1993, 0.93), (1994, 0.892), (1995, 0.895), (1996, 0.874), (1997, 0.855), (1998, 0.874), (1999, 0.837), (2000, 0.88), (2001, 0.88), (2002, 0.88), (2003, 0.88), (2004, 0.88), (2005, 0.88), (2006, 0.88), (2007, 0.88)
Source: INE (National Statistics Office- People at work in societies by territory/councils) GDP Algarve : ( Million € - GDP) (1987, 3213), (1988, 3213), (1989, 3213), (1990, 3213), (1991, 3276), (1992, 3410), (1993, 3161), (1994, 3090), (1995, 3152), (1996, 3105), (1997, 3238), (1998, 3607), (1999, 3974), (2000, 3974), (2001, 3974), (2002, 3974), (2003, 3974), (2004, 3974), (2005, 3974), (2006, 3974), (2007, 3974)
Source: Author´s calculation based on INE´s yearly information, Regional Accounts data.