N O N – D I S C L O S U R E N O T I C E
The work project ‘DEVELOPMENT OF A GLOBAL IT CHARGING MODEL FOR
BASF GROUP’ contains firm-specific information of BASF Business Services GmbH as
well as BASF SE. The use, publication and duplication – even in parts – without
permission is prohibited.
Moreover, the work project ‘DEVELOPMENT OF A GLOBAL IT CHARGING
A Work Project, presented as part of the requirements for the Award of a Masters Degree in Management from the NOVA – School of Business and Economics.
DEVELOPMENT OF A GLOBAL IT CHARGING MODEL FOR BASF GROUP
STEFAN KRAUS (1522)
A project carried out on the topic of Managerial Accounting & Advanced Managerial Accounting, under the supervision of Professor Leonor Ferreira.
ABSTRACT
With ‘GS Strategy 2025’ BASF Business Services GmbH was formed to centrally steer
all IT related topics of BASF group. Thus, a global charging system has to be designed,
which complies to international transfer price regulations and the strategy of BASF SE.
This work project develops a charging system with a following evaluation. The direct
charging system benefits from its cost transparency upsides but comes with a higher
administrative effort due to volume-based charging. In contrast, the indirect charging
system convinces because of easy handling, which is the result of the application of
suitable allocation keys. Regarding the complex group structure of BASF SE with more
than 300 legal entities in 80 countries, the lower administrative effort of the indirect
charging system outweighs the benefits of the direct charging model and should be used
GENERAL OVERVIEW
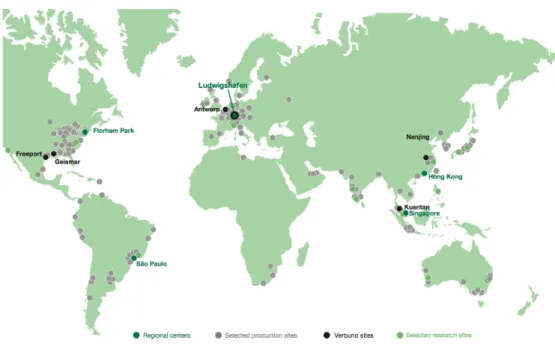
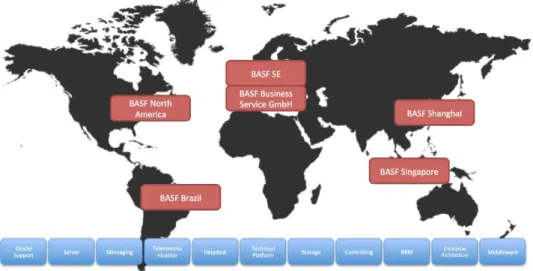
BASF SE (Badische Anelin und Soda Fabrik [Societas Europea]) is the biggest chemical
company in the world, measured by revenue (73.9 bn. EUR) and market capitalization
(66.9 bn. EUR), with core business in chemicals, performance products, functional
materials, agricultural solutions and oil & gas. BASF SE is organized in a group structure,
which steers more than 300 legal entities1 in 80 countries2 in all 6 continents (see figure 1)
with more than 100,000 employees around the world.
Figure 1: BASF SE Worldwide Sites3
During the last decade BASF SE has grown not only organically but also due to a number
acquisitions. For example in 2009, BASF SE bought the CIBA Holding AG4 (specialist
chemicals) and in 2010, Cognis5 (nutritional chemicals) was acquired. Today, BASF SE
continuous to grow and looks likely to maintain the position of market leader. In 2013, the
EBIT totalled 7,273 million €, which represents an increase by 7.9% in comparison to the
1 BASF SE, Annual Report 2013, Notes, p.163. 2
BASF SE, Annual Report 2013, Management Report, p. 19.
3
BASF SE, Annual Report 2013, Management Report, p. 19.
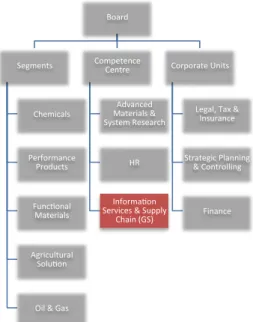
year 2012.6 BASF SE is structured in segments, competence centre and corporate units.
The segments are responsible for generating profits and steered as a profit centre. On the
other hand, the competence centre and corporate units are cost centre since they get a
budget assigned and are evaluated by their cost.7 The competence centre Information
Services & Supply Chain (see figure 2) is accountable for global shared service operations,
global business relationship management, global process and enterprise architecture. The
focus of this work project is in the area of global shared service operations, which is
responsible for network infrastructure, help desk, customer workplaces and collaboration
as well as all applications within the BASF group.8
Figure 2: BASF SE Organisational Chart 20.09.20149
PURPOSE OF THE PROJECT
The reason for the necessity to develop a global reporting and charging model for IT
(=Information Technology) costs within the BASF group, arose with the implementation
of GS Strategy 2025 ‘We create chemistry for a sustainable future’, which aims to enhance
the department ‘Information Service & Supply Chain’ (in the following mentioned as ‘GS’
[=Governance]) to be the best global business solution provider now and in the future.
6
BASF SE, Annual Report 2013, Introduction, p. 2.
7
cf. Jung, 2010 p. 284.
8 Internal source (BASF SE intranet).
9 Internal source (BASF SE intranet), own creation. Board
Segments
Chemicals
Performance Products
Func7onal Materials
Agricultural Solu7on
Oil & Gas
Competence Centre
Advanced Materials & System Research
HR
Informa7on Services & Supply
Chain (GS)
Corporate Units
Legal, Tax & Insurance
Strategic Planning & Controlling
Previously, the area Information Service was steered as the legal entity BASF IT Services
GmbH (‘Gesellschaft mit begrenzter Haftung’ [analog: limted company]), which acted as a
regional IT provider mainly in Europe for the BASF group. Given this, several subsidiaries
of BASF group could purchase IT services or IT hardware from BASF IT Services GmbH.
However, the different subsidiaries also had their own IT departments, which hired other
provider and/or used different IT hardware. For example, special purpose hardware like
laboratory - or research IT. This has been especially true in an acquired subsidiary like
Cognis or CIBA, which already had a complete IT infrastructure and mostly kept this
running after the acquisition. At the start of the year 2014, the new ‘GS Strategy 2025’ has
been implemented, which determines the strategy for ‘GS’ from now to 2025. With ‘GS
Strategy 2025’, the BASF IT Services GmbH merged with the department Supply Chain
and they formed a new legal entity named BASF Business Services GmbH (see figure 3).
Figure 3: Organizational Restructuring with GS Strategy 202510
In so doing, the scope of work has been expanded and BASF Business Services GmbH is
now accountable for all IT related topics for BASF group worldwide. This new
organization is aligned with the matrix structure of BASF group. Consequently, the former
independent IT departments are now functionally advised by BASF Business Services
GmbH but disciplinarily they are steered by their former legal entity. This means that
certain employees work functionally for BASF Business Services GmbH but
organizationally for one legal entity within BASF Group, e.g. BASF Corporation.
While the organizational transition was already realized with the founding of BASF
Business Services GmbH, the technical changes to provide the requirements for the
implementation of a global IT charging model will be performed at the end of year 2014.
With this planned transition there are still many hurdles to overcome. First of all, BASF
Business Services GmbH runs a different SAP system named BOSS, while the BASF
group as well as BASF SE runs a SAP system called COBALT. Although these systems
are basically compatible for daily business due to certain interfaces, they run different cost
accounting systems. Thus, the projects IBC (Implementation BOSS to COBALT) and
CARS (Cost Accounting and Reporting Service) have been set up, which aim to adapt the
commonly used SAP COBALT system of BASF group for the BASF Business Services
GmbH and the harmonization of their cost centre accounting systems to provide global
cost transparency and cost reporting for all entities within BASF group. The last
challenging task is the development of an appropriate service pricing and service charging
model between all legal entities. As mentioned before, not only is BASF Business Services
GmbH providing IT services to BASF SE, but also to other legal entities within BASF
group. Consequently, there are several service providing entities and many service
utilization entities, which have to be considered in the development of a charging system.
The building of a theoretical concept to realize global service charging in compliance with
international regulations to align international strategy with the group’s organizational
structure will be core of this project. However, with more than 300 legal entities in the
tax rules as well as international transfer pricing regulations, there are many hurdles to
overcome.11
This work project proceeds as follows: In section ‘Legal Framework’ the juridical
requirements for the charging system will be identified. Furthermore, in the section
‘Discussion of the Topic’ the BASF Business Services GmbH service pricing and service
charging opportunities will be applied on the legal framework and evaluated afterwards in
the ‘Conclusion’.
LEGAL FRAMEWORK
Due to the increasing globalization, companies need to conduct their businesses in
international markets. To access these markets, multinational enterprises form group
structures with several subsidiaries in different countries, which are steered by their parent
company. Given these constellations, the output of goods and services follow a certain
supply chain between legally independent subsidiaries across borders, but within a group
structure. This exchange of goods and services can be semi-finished goods or finished
goods as well as provision of services and they have to be evaluated by transfer prices. The
function of transfer prices is the coordination, the steering and determination of success in
a company, which is important as a basis for future decisions.12 However, the economic,
mathematical programming and accounting models provided by Myers/Collins 2011 see
the central function of transfer prices in maximizing total profits, which highlights
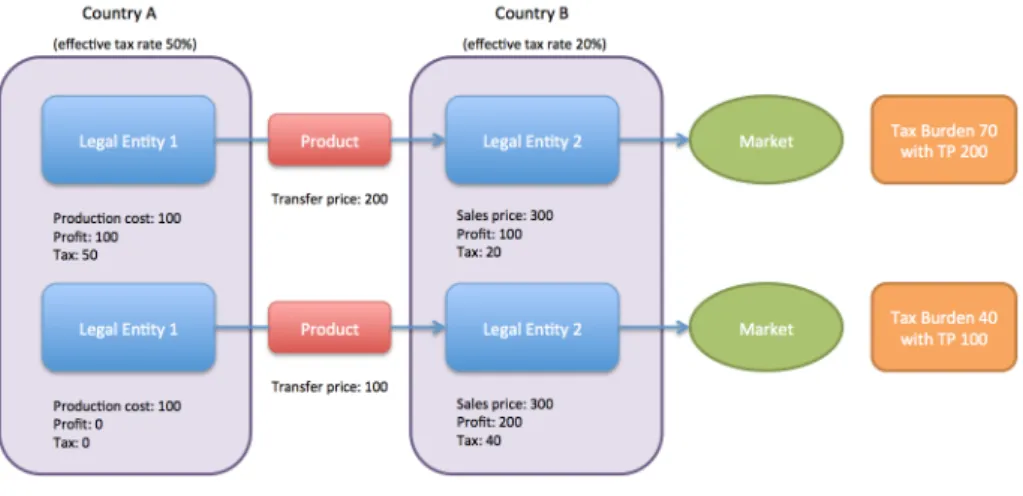
controversy in literature.13 Apart from that, transfer prices can also be used to move capital
and lower the overall taxation, if tax rates differ in the operating countries (see figure 4).
11
GS Strategy 2025, internal source (BASFSE intranet).
Figure 4: Transfer Price Model14
From 2003 to 2005, Amazon saved almost 2 billion US Dollar in tax with transferring
profits from USA to Europe due to complex tax structuring and differing tax rates15,16.
Therefore, globalization not only affected business towards an international operation but
also countries which cannot access profits for taxation reasons since companies can move
their earnings across borders.17 To avoid arbitrary behaviour, industrial nations have
committed themselves to an international standard for transfer prices determination at
arm’s length principle defined by the OECD (Organisation for Economic Co-operation and
Development).18 This standard requires subsidiaries to act as equal to each other as two
independent third party companies.19 Internal service providers in a group structure like
BASF Business Services GmbH, which offer services across borders have to comply with
the following principles to establish arm’s length principle in according to the OECD:
• Determination whether intra-group services have been rendered;
• Reasonable charging concept;
• Transfer price method.
These principles will be explained and applied to the BASF group in the following
paragraph.
14 Own creation. 15 cf. Handelsblatt. 16
cf. Reuters.
17
cf. Wehnert/Wellens, 2003 ch. A p. 1 et seq.
18 cf. Weiss/Blank, 2004 p. 30.
DISCUSSION OF THE TOPIC
Given the theoretical framework, the next task is to develop a suitable charging model,
which complies with the given regulations. To facilitate the complex world within BASF
group and to comply with the given framework of this work project, only five
organizational cost centres, four end-services and eleven production services have been
selected.
DETERMINATION WHETHER INTRA-GROUP SERVICES HAVE BEEN RENDERED
To determine if an intra-group service has been rendered when an activity is performed in
according to the arm’s length principle, the generated economic value is crucial. Only
activities with a recognizable value adding impact can be considered as rendered services
for the OECD. A possible investigation would be the question if a comparable enterprise in
a similar situation would have been paid for such service. In case the payment did not take
place, this intra-group service should not be considered under the arm’s length principle
and must not be charged.20
To investigate if an intra-group service was rendered in accordance with the arm’s length
principle, four services have been selected, namely, SAP, workplace, telecommunication
and messaging. These services are the core businesses of the department information
service of BASF Business Service GmbH and form a representative sample size21.SAP is
the ERP-System (Enterprise Resource Planning) for BASF group, which is used to steer
Finance , Controlling, Human Capital Management, Logistic. Secondly, workplace was
selected, which represents mainly user-centric hardware to conduct daily operations, e.g.
notebook, desktop, workstations and all necessary infrastructure and services behind like
20 cf. OECD-RL 2010, 7.6.
servers, licenses, network, onsite support etc. Telecommunication includes all services,
which belong to landline telephony, e.g. VoIP (Voice over IP) as well as the infrastructure
and licences. The last selected service is messaging, which consist of the email service
within BASF group and the required infrastructure to provide this service.
An indicator of a generated economic value would be if these services are offered by other
companies and customers are willing to pay for them. The BASF group uses SAP but also
Microsoft, BMW, Coca Cola, Burger King and many others multinational companies.22
However, the right to use this ERP-System is purchased with licences from SAP AG while
the service provided by BASF Business Services GmbH for the BASF Group is internal
SAP hosting. The same services are offered by ATOS, Freudenberg IT, Fujitsu/TDS, HP,
IBM, T-Systems, etc. to their customers23, which proves that SAP hosting is a service
available on the market and companies are willing to pay for it. Consequently, SAP hosting
could be regarded as a service rendered in accordance with the arm’s length principle.
Comparable services like workplace is also offered from the provider ComputaCenter with
the name ‘contemporary workplace’24 and companies like SAP AG, Henkel AG and the
German government25 belong to their customers. Therefore, the service workplace can also
be regarded as rendered in according to the arm’s length principle. The last two services
telecommunication and messaging are also provided by ATOS26 for their customers Air
France, KLM, EDF Energy,27 etc. In conclusion, all four selected services are provided by
other companies to the market and therefore it can be assumed that these services add
value to their customers, which is the requirement for the alignment with the definition of
rendered services in according to the OECD. On the other hand, an example for a service,
22 cf. Central Michigan University, 2014. 23 cf. IS Report, 2014.
24
cf. ComputaCenter (WP), 2014.
25
cf. ComputerCenter (Customers), 2014.
26 cf. ATOS SE, 2014.
which would not contribute to an economic value would be the right to use a brand name
‘BASF’ for another subsidiary within the group. Therefore, this service could not be
regarded as a service in accordance with the arm’s length principle and must not be
charged.28
TRANSFER PRICE METHOD
A transfer price method defines the process how a price for a certain product or service is
derived. In Germany, the following three transfer price methods are accepted. First of all,
the ‘Comparable Uncontrolled Price Method’ considers internal or external prices as an
argumentation for an appropriate transfer price. An internal price comparison would
consider comparable goods or services traded between a company and their supplier while
an external comparison would be the evaluation of external market prices between two
third party companies in order to get a comparable transfer price at arm’s length.29
Secondly, the ‘Resale Price Method’ considers the resale price of goods or services from
the selling subsidiary to the external market reduced by their margin as a reasonable
transfer price. The profit margin can be diverted from internal or external transactions
similar to the comparable price method.30 Finally, the ‘Cost Plus Method’ sums up all
production costs and charges an additional product related profit margin. Thus, production
costs plus profit margin represent an appropriate transfer price. In order to determine the
production costs, the subsidiary has to apply the same cost calculation for internal sales as
well as external sales. The profit margin mark up has to be reasonable in comparison to
internal or external transactions.31
28
cf. Renz/Wilmanns, 2013 p. 272.
29
cf. Vögele/Raab in Vögele et al., 2004 ch. D p. 203 et seqq.
Given this information, it is important to identify the most appropriate transfer price
method for BASF Business Services GmbH regarding the representative four selected
services. The ‘Comparable Uncontrolled Price Method’ considers internal or external price
information as necessary to apply this method. Furthermore, it is key that these goods or
services are definable to enable an appropriate comparison with the market.32 However,
BASF Business Services conducts business only between legal entities within the BASF
group and has no third party business. On the other hand, these four selected services are
provided from other suppliers in the market but they differ significantly in scope for every
customer. Due to particular customization for each customer in terms of hardware
manufacturer, hardware features, service included, etc., a precise comparison to the
services provided by BASF Business Services GmbH is hardly possible. In conclusion,
there is no possibility to gather the necessary price information neither internally nor
externally and thus the ‘Comparable Uncontrolled Price Method’ has to be rejected. The
‘Resale Price Method’ cannot be applied in the service area either, since the service cannot
be resold. This method is rather applied for companies, which trade tangible products.33
For IT companies in the service sector the ‘Cost Plus Method’ seems most appropriate due
to a lack of comparable prices as well as the impossibility to resale services.34 This method
is very common especially for North American companies according to the empirical study
conducted by Frese/Glaser 198035 and Ho/Lau 200236. In order to determine a reasonable
mark-up for BASF Business Service GmbH the empirical study of Renz/Wilmanns has
been considered, which illustrates a mark-up range from 2.5% until 12.8% in the
information technology industry.37,38 However, the central finance department of BASF
32
cf. Renz/Wilmanns, 2013 p. 280.
33 cf. idem. 34 cf. idem. 35
cf. Frese/Glaser, 1980 p. 109 et seq.
36
cf. Ho/Lau, 2002 p. 3.
group determines “5% additional profit charges over production costs for information
services to be appropriate”.39 In conclusion, the ‘Cost Plus Method’ with an additional 5%
mark-up will be selected for the development of an international charging model for BASF
group.
THE CHARGING SYSTEM
There are two different charging models, which claim to follow the arm’s length principle.
The following two examples shall illustrate the difference between direct and indirect
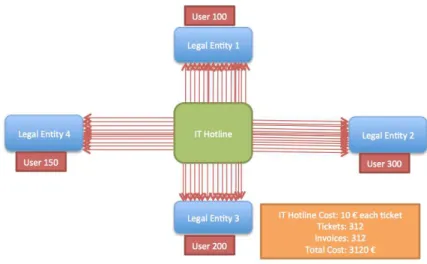
charging. The direct charging system considers only determinable quantities of services. In
so doing, every services rendered internally will be invoiced and charged separately (see
figure 5).
Figure 5: Direct Charging System40
In figure 5, IT hotline services are charged directly to four legal entities on a ticket basis41.
In so doing, every call, which causes the technician to create a ticket, 10 Euros will be
charged and invoiced. Consequently, the hotline has to open and invoice 312 tickets in this
example.
39 cf. BASF SE Inter Company Transfer Pricing Guidelines 2014, p. 13. 40
Own creation.
41
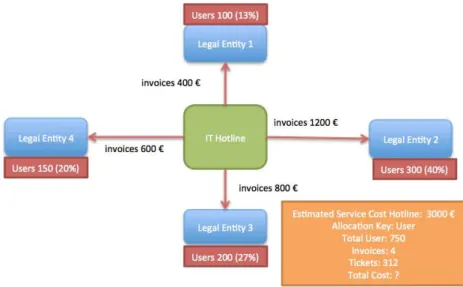
The indirect charging system allows room for estimations and focuses on a reasonable
determination for the cost basis and an appropriate definition of allocation keys. Widely
used allocation keys in the IT industry are for instance PCs quantities, user quantities,
email account quantities, etc.
Figure 6: Indirect Charging System42
In comparison to previous example, in figure 6 hotline services are charged indirectly. First
of all, the service cost has been calculated at 3000 and these costs are allocated in
according to the user quantity of each legal entity. Thus, only 1 invoice has to be created
for the charging of this service to each legal entity. However, if the rendered service
quantity differs from the calculated one, the cost allocation is inaccurate.
IT SERVICE PRICE CALCULATION WITHIN BASF GROUP
Before describing a direct and indirect charging system for BASF group, the price
calculation of the actual services has to be explained to create a profound understanding
(for the numerical example see appendix 1). As mentioned before, the representative
services SAP, workplace, telecommunication and messaging were selected to develop the
global charging system for BASF group. The previously determined ‘Cost Plus Transfer
Price Method’ requires a very detailed cost calculation to maintain cost transparency for
the mark-up of 5% at the end. First of all, on-going costs like hardware depreciation,
personnel cost, allocations, communication or third-party costs accrue on organizational
cost centres (see figure 7).
Figure 7: Service Calculation BASF Business Service GmbH43
The costs occurring on these cost centres are allocated to the production cost centres44 in
the next layer. This allocation is highly complex but essential since it has to be determined
how much service has been provided to which production cost centre. The allocation used
was provided by the service architects, which calculate the exact costs for every single
service. The production cost centres represent the basic IT services, which are necessary to
assemble a full service like SAP or messaging. Table 1 explains their functions.
Table 1: Production services and explanations45
43 Own creation (conceptual due to confidentiality reasons).
44 The terminology ‘production’ is confusing when talking about services, however these services have to be
produced and therefore this layer is called ‘production’.
It is important to mention that central function like controlling, BRM (=Business
Relationship Management) and enterprise architecture are also considered as a part of the
service production since their cost have to be allocated to the final service as well. Yet, not
all of these production services are allocated to all final services. For example, the service
SAP needs only server, technical platform, helpdesk, BRM, controlling and enterprise
architecture to be provided. Moreover, not all production services are provided 100% by
BASF Business Service GmbH due to the global scope of BASF group. For example, to
host a global SAP service it is necessary to have servers located in South America, Asia,
North America and Europe. However, BASF Business Services GmbH does not have
subsidiaries outside Europe and due to tax reasons it is not possible to locate an owned
server in other subsidiaries without funding a subsidiary in this country. Consequently,
several IT services are provided by other BASF group subsidiaries. The following figure
emphasizes the global structure of IT service provision and highlights the split between
functional and disciplinary activities. Employees could work disciplinarily with an
employment contract for BASF Shanghai but as soon as they maintain servers there, they
work functionally for BASF Business Services GmbH and their personnel cost have to be
considered in the cost calculation for IT services:
Figure 8: Global IT services production within BASF group46
Since other subsidiaries partially provide IT services they have to be reimbursed in
according to the scope of the provision or they have to invoice these services to the legal
entities. This is an essential hurdle to overcome in designing an appropriate charging
model. In the end, all production costs were allocated to the four selected services, which
represent the basis for the development of the direct and indirect charging model within
BASF group.
OPTION A: DIRECT CHARGING WITHIN BASF GROUP
The following charging models consider 16 legal entities whereas one represents the BASF
Business Service GmbH (mentioned as ‘BBS’) and the further legal entities are named
with letters B-P. Moreover, the models start with the service production, continue with the
service utilization and end with the invoicing process.
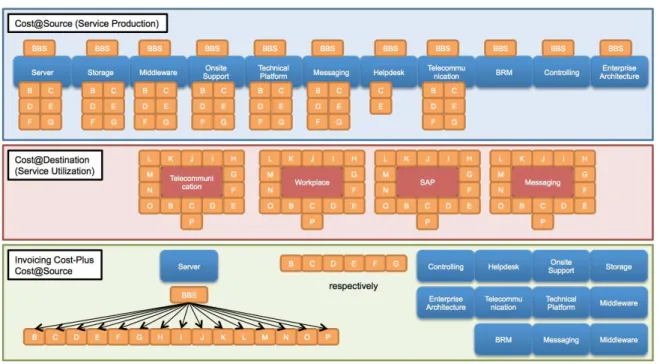
The direct charging model (see appendix 2 for the numerical example) shows in the blue
layer (see figure 9), which legal entities contribute to the global service production in a
cost@source view. It is noticeable that only seven out of 16 legal entities produce services
and the central function services BRM, controlling and enterprise architecture are actually
only provided by BBS. The red layer presents which legal entity utilizes the provided
services in according to the cost@destination view. It is important to see that all legal
entities utilize the four services SAP, Workplace, Telecommunication and Messaging.
Consequently, some legal entities only utilize, and some legal entities provide and utilize
services, which has to be considered in the invoicing process. Moreover, the direct
charging model considers volume based allocations like SAP systems47, PC quantities,
minutes per call, mailbox quantities, which enhance a very precise invoicing. The green
layer describes the invoice flow and is based on the cost@source view in the blue layer.
47
Each producing legal entity invoices their productions costs to the utilizing subsidiary in
according of the degree of utilization. However, there is no invoicing to themselves even
though some legal entities have also utilized their own produced services. Therefore, the
producing subsidiaries have to add a mark up for their captive use, which is covered by the
invoiced legal entities. In conclusion, each of the seven producing legal entities invoice
their costs@source for each of the 11 production services to the 15 utilizing companies for
4 end-services and add a mark-up of 5% to comply with the before determined ‘Cost Plus
Transfer Price Method’ at arm’s length principle. Unfortunately, this model creates a vast
administrative effort since 3,360 invoices (for numerical explanation see excel file) in total
have to be created and tracked respectively, but it assures a high degree of cost
transparency.
Figure 9: Direct Charging Model48
OPTION B: INDIRECT CHARGING WITHIN BASF GROUP
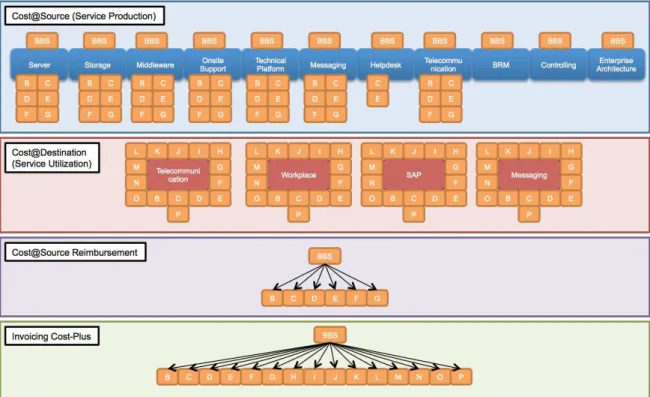
The indirect charging model (see appendix 3 for the numerical example) takes the same
basis but has conceptual differences. First of all, the service production at cost@source
view is identical with the direct charging model since the same legal entities provide the
same production services. Furthermore, the red layer (see figure 10) does not differ in
comparison to the direct charging model because the same legal entities utilize the same
services but the allocations keys are different. The costs are allocated in according to the
user quantities to determine the costs@destination for each user in each legal entity. This
procedure is less accurate but easier to handle for big companies. The first difference
occurs in the purple layer where BBS is now reimbursing all production costs@source to
the service producing entities. In so doing, BBS includes the entire production
costs@source in their own company. Thus, BBS can invoice the entire amount of
costs@destination to all 15 legal entities since they can act as if only BBS would have
produced the services. BBS also adds the captive use to their charges since they do not
invoice to themselves and the previously defined 5% cost-plus mark-up. In conclusion, this
model has a lower administrative effort since only 15 invoices have to be created and
tracked within the whole BASF group but has a poorer cost transparency due to vast
aggregations.
Figure 10: Indirect Charging Model49
CONCLUSION
The direct charging model benefits from its volume-based allocation. Consequently, this
method is very accurate since all legal entities only get charged for the utilized services.
Moreover, this volume-based allocation cannot fluctuate like the allocation keys ‘user
quantities’, which represent another upside for this charging model. However, this leads
also to its biggest downside. Due to the very precise cost calculation, a huge administrative
effort is necessary to determine the cost for each legal entity. For instance, every service
has to be invoiced to each legal entity and the payment has to be tracked and booked. Thus,
only in the provided example with four services, 11 production services and 16 legal
entities, 3,360 invoice have to be created. Furthermore, the cost accounting has to be
homogenous in every legal entity participating in the global charging model to assure that
cost@source equals cost@destination. Given that, the global steering is also very difficult
to conduct, which makes efficiency measures, cost control and external benchmarks very
difficult since each legal entity is responsible only for their costs. The captive use model
applied with direct charging leads to the fact that not-producing legal entities subsidize
producing legal entities, which represents a disadvantage regarding cost transparency. Yet,
it is prohibited to invoice self-produced services to the self-producing legal entity and
therefore the captive use model is unavoidable.50
In contrast, the indirect charging model disappoints with its inaccurate and fluctuating
allocation key ‘users’, which supports cross-subsidizing between legal entities if actual
user quantities differ from previously measured user quantities. This leads to a lower cost
transparency in comparison with the direct charging model. Moreover, all costs are
centralized at BASF Business Services GmbH and therefore all legal entities subsidize
their captive use. Thus, this is also an argument for a lower cost transparency. However,
50
this problem exists also with the direct charging model due to legal conditions. On the
other hand with indirect charging only 15 invoices have to be created amongst all legal
entities, which depicts a lean and user-friendly process. Furthermore, BASF Business
Services GmbH could centrally steer the costs, benchmark them and establish efficiency
enhancements if necessary due to the aggregation of all costs@source in BASF Business
Services GmbH.
Table 2: Pros and Cons of Direct and Indirect Charging Models
With ‘GS Strategy 2025’ BASF Business Services GmbH has to align their charging to the
complex matrix structure within BASF group. For the first time, costs@source are
subdivided in different companies, which has to be considered in the charging method.
Moreover, it is essential that the charging system is manageable although the structure is
highly sophisticated. Therefore, only the indirect charging model can be applied to achieve
these requirements. The fact that the steering is centralized as well as the significantly
lower amount of invoices outweigh the cost transparency upsides of the direct charging
model. Even the OCED acknowledges that direct charging in a group structure with
separate invoicing for each service is hardly applicable.51,52 The developed indirect
charging model represents best practices with the legal framework to ensure maximum cost
51 cf. OECD-RL 2010, 7.22 & 7.23.
transparency with lowest administrative effort and therefore should be used by the BASF
group.53
The obstacles in the near future are the implementation of the indirect charging model for
all IT services and for all legal entities within BASF group. Thus, all services have to be
priced in consideration of their local contribution. Another challenge for the realisation of a
group-wide charging model is the dynamic business strategy of BASF SE with upcoming
mergers and acquisitions. Consequently, there is a need of a standardized process to
implement newly purchased companies in the developed global IT charging system.
“The indirect charging model enables BASF Business Service GmbH to centralize all IT
costs within BASF group in one legal entity. This is the basis for an establishment of
globally aligned service prices and the requirement of a global service portfolio. However,
the application of this model for each provided service is a vast task for 2015.”
Winfried Schweigert, manager of the controlling department of BASF Business Services GmbH
REFERENCES
ATOS SE. http://de.atos.net/de-de/home/unsere-leistung.html, visited 14.11.2014.
BASF SE. 2009. Annual Report, visited 28.12.2014, http://report.basf.com/2009/.
BASF SE. 2010. Annual Report, visited 28.12.2014, http://report.basf.com/2010/.
BASF SE. 2013. Annual Report, visited 28.12.2014, http://report.basf.com/2013/.
BASF SE. 2014. Inter Company Transfer Pricing Guidelines.
Central Michigan University. College of Business Administration, visited 14.11.2014,
https://www.cmich.edu/colleges/cba/academic_programs/institutes/sapua/Pages/Companies-Using-SAP.aspx.
ComputaCenter (WP). visited 14.11.2014, http://www.computacenter.de/zeitgemaesser-arbeitsplatz.
ComputaCenter (Customers). visited 14.11.2014, http://www.computacenter.de/referenzen.
Computer Weekly. visited 14.11.2014, http://www.computerweekly.com/guides/Supplier-profile-Atos#guideCategory4.
Frese, Erich; Glaser, Horst. 1980. Verrechnungspreise in Spartenorganisationen. DBW – Die Betriebswirtschaft. p. 109-123.
Günkel, Manfred. 1996. Die Prüfung der steuerlichen Verrechnungspreise durch den Abschlussprüfer. WPg – Die Wirtschaftsprüfung. p. 839 – 857.
Handelsblatt. visited 15.10.2014,
http://www.handelsblatt.com/unternehmen/handel-dienstleister/ableger-in-luxemburg-teile-des-betriebsvermoegens-verschoben/7492820-3.html.
Ho, Daniel; Lau, Peter. 2002. A Comparative Emperical Study of International Transfer Pricing Practices of US Multinationals with their Affiliates in the PRC and the UK, BRC Working Papers.
Horvàth, Pèter. 2011. Controlling. München: Franz Vahlen Verlag.
IAS. International Accounting Standards, visited 28.12.2014, http://www.ifrs.org.
IS Report. Information platform for Business Solutions, visited 14.11.2014,
http://www.isreport.de/allgemein/sap-hosting-t-systems-atos-und-hp-erzielen-bestnoten/. Jung, Hans. 2010. Allgemeine Betriebswirtschaftslehre. München: Oldenbourg.
Myers, Joan; Collins, Mary. 2011. A Historical Review of Transfer Pricing Theories: Adressing Goal Congruence within the Organization.
OECD. Articles of the model convention with respect to taxes on income and on capital, visited 28.12.2014,
http://www.oecd.org/tax/treaties/1914467.pdf.
Renz, Martin; Wilmanns; Jobst. 2013. Internationale Verrechnungspreise. Weinheim: Wiley.
Reuters. visited 15.10.2014, http://www.reuters.com/article/2014/10/07/us-eu-amazon-com-tax-idUSKCN0HW0PP20141007.
Rugman, Alan; Brewer, Thomas. 2009. The Oxford Handbook of International Business: Eden, Lorraine. Taxes, Transfer Pricing, and Multinational Enterprises, Oxford University, p. 591-619.
Scherz, Erhard. 1998. Verrechnungspreise für unternehmensinterne Dienstleistungen. Wiesbaden: Deutscher Universitätsverlag.
Vögele, Alexander; Borstell, Thomas; Engler, Gerhard. 2004. Handbuch der Verrechnungspreise. München: Beck.
Wehnert, Oliver; Wellens, Ludger. 2003. Ernst & Young: Verrechnungspreise. Bonn: Stollfuß.
APPENDIX