Characterization of Brazilian soybean cultivars using microsatellite markers
Regina Helena Geribello Priolli
1, Celso Teixeira Mendes-Junior
1, Neylson Eustáquio Arantes
2and Eucleia Primo Betioli Contel
11
Departamento de Genética, Faculdade de Medicina de Ribeirão Preto, Universidade de São Paulo,
Ribeirão Preto, SP, Brazil.
2
Empresa Brasileira de Pesquisa Agropecuária, Centro Nacional de Pesquisa de Soja, Uberaba, MG,
Brazil.
Abstract
Microsatellite markers or SSR (Simple Sequence Repeats) have proved to be an excellent tool for cultivar identification, pedigree analysis and the evaluation of genetic distance among organisms. Soybean cultivars have been characterized mainly by morphological and biochemical traits. However, these traits have not been sufficient to characterize the large number of cultivars eligible to receive protection under the Brazilian Cultivar Protection Act. In order to define new soybean cultivar markers, the alleles of twelve SSR loci of 186 Brazilian soybean cultivars were studied by estimating the variation in their size range and their respective frequencies. On average, 5.3 alleles per locus were detected, with a mean genetic diversity of 0.64 ± 0.12. These loci were used to distinguish morphologically similar groups, presenting a mean similarity coefficient of 0.46; their use allowed to determine 184 profiles for the 186 cultivars. A dendrogram based on the SSR loci profiles showed good agreement with the cultivar pedigree information.
Key words: Glycine max(L.) Merrill, simple sequence repeat, microsatellites, molecular markers, soybean elite cultivars.
Received: April 3, 2002; accepted: June 17, 2002.
Introduction
Soybean,Glycine max(L.) Merrill, a legume native from China, is currently one of the most important crops worldwide. Brazil is the second largest producer, with a cultivated area of 13.68 million hectares, and 37.8 million tons harvested in 2000/2001 (http://www.conab.gov.br). The importance of soybean in Brazilian agriculture is due partly to suitable climate and soil management, but particu-larly to the great number of improved cultivars. For the 2000/2001 harvest alone, the Brazilian Agricultural Re-search Corporation (Embrapa) listed about 259 soybean cultivars, adapted to the most diverse producing regions in Central Brazil (Embrapa, 2000). This figure has increased year after year, with more productive new cultivars, resis-tant to pathogens, in both consolidated and expanding crop-ping areas.
Along with the development of new cultivars, there has been a growing interest in the genetic characterization, for commercial protection provided by the Brazilian Cultivar
Protection Act (1997). When referring to the necessary re-quirements for the protection of a cultivar, it states that the cultivar has to be reliably distinct, homogeneous and stable.
Plant breeders have traditionally used morphological and biochemical traits to register and protect their varieties. Although these traits remain predominant and important, they present limitations, particularly in closely related culti-vars. In plants with a narrow genetic base in their gene pool, such as soybean, they may not be sufficient, taking into ac-count the large number of cultivars eligible to be protected. In such cases, molecular descriptors can provide additional information about the characterization, degree of diversity and genetic constitution of the existing germplasm.
Microsatellites or SSR are sequences of a few re-peated and adjacent basepairs, well distributed over the eukaryote genome (Powellet al., 1996). Variations in the number of repeats can be detected by polymerase chain re-action (PCR), with the development of primers (20 to 30 base pairs) specifically built for amplification and comple-mentary to single sequences flanking the microsatellite. These markers have been used for genotypic identification of many plant species, such as soybean (Creganet al., 1994; Diwan and Cregan, 1997; Rongwenet al., 1995; Maughan
et al., 1995; Songet al., 1999), grape (Vitis vinifera L.)
www.sbg.org.br
(Thomas and Scott, 1993), rapeseed (Brassica napusL.) (Kresovichet al., 1995), apple (MalusxdomesticaBorch) (Hokansonet al., 1998), and many others.
A high level of polymorphism in the SSR loci has been reported for soybean. Akkayaet al.(1992) detected an average of seven alleles at each of three microsatellite loci studied in a group of 43 soybean genotypes. Morgante and Olivieri (1994) detected similar levels of allelic diversity in seven SSR loci in a group of 61 genotypes. Rongwenet al. (1995) reported 11 to 26 alleles at seven loci in a group of 96 soybean cultivars and plant introductions (PIs). Maughanet al.(1995) detected 79 alleles across five SSR loci in a sample of 94 soybean accessions ofG. maxandG. sojagenotypes. Using 12 microsatellite primers, Doldi et al.(1997) found two to six alleles per locus in a group of 18 soybean cultivars. Narvel et al. (2000), using 72 micro-satellite loci, detected a total of 397 alleles in 79 elite soy-bean cultivars and PIs.
Using 20 SSR markers, Diwan and Cregan (1997) were able to distinguish the 35 soybean genotypes that ac-counted for about 95% of the alleles present in North-Ame-rican soybean. They detected an average of 10.1 alleles per locus, and concluded that the stuttering related to the dinu-cleotide loci increased the difficulty in defining the main peak of the allele used to establish their size, suggesting the use of trinucleotide loci for cultivar identification. Songet al.(1999) selected a group of 13 trinucleotide SSR loci to characterize morphologically similar cultivars, and stan-dardized the identification of North-American soybean cultivars by this group of loci.
The objective of the present study was to determine the number of alleles and the gene diversity of trinucleotide loci in a group of soybean cultivars fit to be grown in Brazil, and to select or indicate a set of loci endowed with different profiles for each cultivar.
Material and Methods
Soybean plant material and DNA isolation
A group of 186 soybean elite cultivars, developed and released by Brazilian public and private institutions, was selected to represent the complete range of cultivars grown in Brazil. Seeds of each of the 186 cultivars were obtained from the Embrapa-Soybean Germplasm Collection. The cultivars are listed in Table I.
Thirty to fifty plants of each soybean cultivar were grown in a greenhouse for DNA isolation. The equivalent of 30 leaf tissue samples were collected from each cultivar, frozen in liquid nitrogen and lyophilized for 1-2 days. DNA was isolated from the bulked lyophilized leaf tissue of the plants of each cultivar by a mini-prep procedure based on Doyle and Doyle (1990). DNA quality and concentration were evaluated by electrophoresis in 0.8% agarose gel stained with ethidium bromide (EtBr).
Table I- The soybean cultivars used in the present study.
No. Cultivar Pedigree1 Group2
1 BR 16 D69-B10-M58 x Davis I
2 BR 36 IAS 4(2) x BR78-22043 I
3 BRS 132 BR80-20703 x Nissei I
4 BRS 153 Embrapa 1 x Braxton I
5 BRS 155 Paraná (2) x PI 157.440 I
6 Embrapa 1 (IAS 5 RC )
IAS-5(6) x Paranaíba I
7 Embrapa 48 (Davis x Paraná) x (IAS 4 x BR-5)
I
8 FT 106 I
9 FT 109 I
10 FT 2 Selection in IAS -5 I
11 FT 20 (Jaú) FT 8184 x Davis I
12 FT 4 D64-4636 x D65-3075 I
13 FT 7 (Tarobá) FT 81-84 x Davis I
14 FT 9 (Inaê) FT 81-84 x Davis I
15 FT Manacá FT 907 x Lancer I
16 FT Seriema M-2 (Inbred line of Cristalina) x FT-1
I
17 IAC 13 Paraná x IAC73-231 I
18 IAC 15 IAC 77-3086 x Paraná I
19 IAC 15-1 IAC 15 (3) x ? I
20 IAC 16 IAC 2 x Clark I
21 IAC 4 IAC 2 x Hardee I
22 IAC Foscarin-31 Selection in Foscarin I
23 IAC/Holambra Stwart-1
Selection in Stwart I
24 KI-S 601 FT 2 x Sertaneja I
25 KI-S 602 RCH Paraná x Oc 73-397 I
26 MS/BR 34 (Empaer 10)
D64-4636 x IAC 7 I
27 Ocepar 10 Paraná x União I
28 Ocepar 16 SOC 81-216 x Ocepar 3 I
29 Ocepar 4 (Iguaçu) R 70-733 x Davis I
30 Ocepar 7 (Brilhante) Selection in IAS 5 I
31 Ocepar 8 Selection in Paraná I
32 RB 502 CEPS 77-16 x Invicta I
33 RS 9 (Itaúba) FT 2 x IAS 5 I
34 BRS 156 [FT-5 x Dourados-1(5) x Ocepar 9)] x Tracy M
II
35 IAC 11 Paraná x [Davis x (Hill x PI 244-66)]
II
36 Paraná Hill x (Roanoke x Ogden) II
37 BRS 157 FT81-2926 x BR83-147 III
38 BRSMS Apaiari BR 16 x Ocepar 8 III
39 CEP 12 (Cambará) Bragg x Hood III
40 Cobb F57-735 x D58-3358 III
Table I(cont.)
No. Cultivar Pedigree1 Group2
81 BR 6 (Nova Bragg) Bragg(3) x Santa Rosa VII
82 Bragg Jackson x D49-2491 VII
83 BRS 137 Dourados-(5) x Ocepar 9-SS-1 VII
84 BRS 154 Embrapa 1 x Braxton VII
85 BRS Celeste Bossier x BR 1T VII
86 BRSMG Garantia Braxton(2) x (Cariri(4) x Cristalina)
VII
87 BRSMG Robusta BR94-23348 x Storewall VII
88 BRSMG Segurança (Ocepar 9-SS1 x Amambai) x Dourados(2)
VII
89 BRSMG Virtuosa Ocepar-4 (Iguaçu) x IAC-12 VII
90 BRSMS Mandi Dour-1 x {Dour-2(2)x [Amambai(2) x Oc 9-SS1]}
VII
91 Embrapa 20 (Doko RC)
Doko (4) x IAC-7-R VII
92 Embrapa 63 (Mirador)
Dourados(2) x [Amambai(2) x Ocepar 9-SS1]
VII
93 Emgopa 315 (R. Verm.)
Dourados(2) x [Amambai(2) x Ocepar 9-SS1]
VII
94 FT 10 (Princesa) FT 9510 (Inbred line of Dourados) x Sant’Ana
VII
95 FT 18 (Xavante) FT 9510 (Inbred line of Dourados) x Sant’Ana
VII
96 FT 6 (Veneza) FT 9510 (Inbred line of Dourados) x Prata
VII
97 FT Cometa Williams x FT 420 VII
98 IAC 18 D-72-9601-1 x IAC-8 VII
99 IAC 22 IAC 12 x FT 2 VII
100 MG/BR48 (Gar. RCH)
MG/BR-22 Garimpo (6) x Dourados
VII
101 UFV 19 FT 12 (Nissei) x IAC 8 VII
102 UFV/ITM-1 Paraná x Viçoja VII
103 BR 30 União(2) x Lo 76-1763 VIII
104 BRS 135 FT Abyara x BR83-147 VIII
105 BRS Milena FT Abyara x BR83-147 VIII
106 BRSMS Carandá FT-Abyara x BR83-147 VIII
107 BRSMS Lambari FT-Abyara x BR83-147 VIII
108 BRSMS Piraputanga
Selection in BR87-28091 VIII
109 BRSMS Taquari FT 14 (Piracema) x [(Dourados-2(2) x Oc 9-SS1]
VIII
110 BRSMS Tuiuiú FT Cristalina(4) x Doko VIII
111 DM Soberana FT- Estrela x UFV 9 VIII
112 Embrapa 64 (Ponta Porã)
União(2) x Lo76-1763 VIII
113 Emgopa 301 IAC 4 x Jupiter VIII
114 FT 14 (Piracema) FT 9510 (Inbred line of Dourados) x Sant’Ana
VIII
115 FT 5 (Formosa) FT 9510 (Inbred line of Dourados) x Sant’Ana
VIII
Table I(cont.)
No. Cultivar Pedigree1 Group2
42 FT 104 III
43 FT 2000 III
44 IAS 4 Selection in R60-390 ( Hood x
Jackson)
III
45 Ivorá (Davis x Shina.) x (Howgyku x
Amarela Comum)
III
46 Ocepar 17 SOC 81-216 x Ocepar 3 III
47 Ocepar 2 (Iapó) Coker Hampton 208 x Davis III
48 Ocepar 5 (Piquiri ) Coker 136 x Co72-260 III
49 RS 5 (Esmeralda) Pérola x (Hardee x Industrial) III
50 BRS 134 BR83-147 x BR84-8309 IV
51 BRS 136 FT Manacá x BR83-147 IV
52 BRS 138 BR 16 x BR85-16140 IV
53 BRS 65 Selection in Dourados IV
54 BRS 66 BR83-147 x FT Abyara IV
55 BRSMA Sambaíba FT 5 x[Dourados-1(4) x OCEPAR 9-SS1)]
IV
56 BRSMA Seridó RCH
BR-28 (Seridó)(6) x Embrapa 20 (Doko RCH)
IV
57 BRSMG Confiança Paraná x BR83-147 IV
58 BRSMS Piapara [BR16(2) x BR80-6989] x Braxton
IV
59 BRSMS Piracanjuba FT Abyara x BR 83-147 IV
60 CEP 20 (Guajuvira) La 59-7-21 x Forrest IV
61 DM Nobre Doko x BR-15 (Mato Grosso) IV
62 Embrapa 30 (V. R Doce)
BR85-29003 x Dourados-2 IV
63 Embrapa 62 FT-2 x BR83-147 IV
64 Emgopa 313 (Anhang.)
IAC 7 x (Santa Rosa x Go79-3068)
IV
65 Emgopa 316 (Rio Verde)
FT79-2564 x EA 302 IV
66 FT 101 IV
67 FT 19 (Macacha) Santa Rosa x (Cajeme Selection x São Luiz)
IV
68 GO/BR 25 (Aruanã) E 77-510-3 x BR 78-11202 IV
69 IAC 100 IAC 78-2318 x IAC-12 IV
70 IAC 12 Paraná x IAC73-231 IV
71 MS/BR 19 (Pequi) D69-442 x (Bragg x Santa Rosa) IV
72 Ocepar 14 Davis x União IV
73 Santa Rosa D49-772 x La 41-1219 IV
74 BR 28 (Seridó)
Santa Rosa x BR 78-11202 V
75 BR 38 FT 2 x União V
76 BRS Carla BR-16 x BR83-147 V
77 RB 603 CEPS 77-16 x Invicta V
78 RB 604 CEPS 7716 x Emgopa V
79 DM 247 BR83-8977 x Doko VI
Table I(cont.)
No. Cultivar Pedigree1 Group2
153 FT Cristalina Natural cross in UFV 1 XI
154 FT Cristalina RCH FT Cristalina(5) x Doko XI
155 FT Estrela M-2 (Inbred line of Cristalina)x FT-1
XI
156 FT Iramaia FT 440 x Ogden XI
157 FT Líder Dare x União XI
158 Ivaí Majos x Hood XI
159 MT/BR 50 (Parecis) BR83-9520-1(2) x FT Estrela XI
160 MT/BR 51 (Xingu) BR83-9520-1(2) x FT Estrela XI
161 MT/BR 53 (Tucano) BR83-9520-1(2) x FT Estrela XI
162 Planalto Hood x Kedelle STB 452 XI
163 UFV 5 Mineira x UFV-1 XI
164 BRSMT Crixás BR83-9520(2) X FT Estrela XII
165 CAC-1 Selection in IAC-8 XII
166 CS 301 FT 7 x UFV 7 XII
167 CS 303 Selection in CAC -1 XII
168 DM 118 FT Estrela x BR 83-1257 XII
169 Dourados Selection in Andrews XII
170 FEPAGRO-RS 10 IPAGRO 20 x Pel 7803 (Forrest-Hood)
XII
171 FT 102 XII
172 IAC 20 IAC 77-535 x Emgopa 302 XIII
173 M-SOY 2002 XIII
174 BRSGO Catalão Emgopa 306(Chapada)(6) x BR92-31910
XIV
175 Campos Gerais Arksoy x Ogden XIV
176 Embrapa 9 (Bays ) Lancer x BR 79-251-1 XIV
177 Emgopa 308 (S.Dourada)
Selection in Emgopa 301 XIV
178 FT 100 XIV
179 FT 45263 Selection in FT Cristalina XIV
180 FT Canarana FT Cristalina x FT-1 XIV
181 FT Eureka Paraná x (PI 346304 x Paraná) XIV
182 IAC 14 Davis x IAC76-4012 XIV
183 Invicta Lancer x Essex XIV
184 Ipagro 21 Forrest x (Hood x Lousiana) XIV
185 RS 7 (Jacuí) Ivorá x PI 80837 XIV
186 Emgopa 303 IAC 73-2736 x IAC 6 XV
1Blank gaps indicate lack of information on cultivar pedigree. 2
Morphological traits of soybean cultivars as to hypocotil color, flower color, pubescence color and hilum color within Groups I to XV, respec-tively: (I) Green, White, Gray and Buff; (II) Green, White, Gray and Light Yellow; (III) Green, White, Gray and Brown; (IV) Green, White, Brown and Brown; (V) Green, White, Brown and Buff; (VI) Green, White, Brown and Imperfect Black; (VII) Green, White, Brown and Black; (VIII) Purple, Purple, Brown and Brown; (IX) Purple, Purple, Brown and Black; (X) Pur-ple, PurPur-ple, Brown and Imperfect Black; (XI) PurPur-ple, PurPur-ple, Gray and Buff; (XII) Purple, Purple, Gray and Brown; (XIII) Purple, Purple, Gray and Black; (XIV) Purple, Purple, Gray and Imperfect Black; (XV) Purple, Pur-ple, Gray and Light Yellow.
Table I(cont.)
No. Cultivar Pedigree1 Group2
116 FT Abyara União x Sant’Ana VIII
117 FT Maracajú FT 9510 (Inbred line of Dourados) x Sant’Ana
VIII
118 FT Saray FT 5 (Formosa) x União VIII
119 Fundacep 33 IAS 5 x CEPS 8007 VIII
120 Ocepar 12 Davis x União VIII
121 UFV 10 (Uberaba) Santa Rosa x UFV-1 VIII
122 Bossier Natural mutation in Lee IX
123 BR IAC 21 IAC-8(6) x Cristalina IX
124 BRSMA Parnaíba FT Seriema (Selection RCH) x BR-10 (Teresina)
IX
125 BRSMG 68 (Vencedora)
Braxton x [FT-5 x
(Dourados-1(5) x Oc. 9-SS1)] IX
126 BRSMG Liderança Centennial(2) x [(Paraná x Bossier)(2) x Davis-1
IX
127 BRSMG Renascença [F81-2129 x (Kirby x Tracy M)] x Forrest
IX
128 BRSMS Bacuri {FT-2 x [IAS-5(6) x BR80-6989]} x Braxton
IX
129 BRSMS Surubi Cristalina R(2) x Doko IX
130 DM Vitória IAC 8 x UFV 9 IX
131 FT 11 (Alvorada) UFV 1 x Campos Gerais IX
132 FT Guaira Lancer x União IX
133 IAC 17 D-72-9601-1 x IAC-8 IX
134 IAC 8 Bragg x (Hill x PI 240664) IX
135 IAC 8-2 Selection in IAC 8 IX
136 KI-S 702 FT 10 x Lancer IX
137 KI-S 801 FT 2 x BR 80-6989 IX
138 MG/BR-46 (Conquista)
Lo76-4484 x Numbaíra IX
139 Ocepar 3 (Primavera)
(Halesog x Volstate) x (Hood x Rhosa)
IX
140 UFV 18 (Patos de Minas)
FT Cristalina x IAC 8 IX
141 BRSGO Goiatuba Emgopa 305(Caraíba)(6) x Doko X
142 Emgopa 305 (Caraíba)
Tropical x Cristalina X
143 BR 4 Hill x Hood XI
144 BR 9 (Savana) Selection in Lo B74-2 XI
145 BRSMA Pati BR83-9520(2) X FT Estrela XI
146 Embrapa 4 (BR-4 RC)
BR-4 (6) x Paranaíba XI
147 Embrapa 46 FT Manacá x BR 16 XI
148 Embrapa 47 FT Manacá x BR 16 XI
149 Emgopa 304 (Campeira)
Paraná x Mandarin XI
150 Emgopa 309 (Goiana)
Obtained from population BRB 214
XI
151 FT 8 (Araucária) Cobb x Planalto XI
Morphological and genealogical traits of the cultivars
The pedigrees and some morphological traits of the soybean cultivars were recorded, following research of the literature and information received from Embrapa-Soybean and private breeders. The 186 cultivars were divided into 15 groups, according to similarities in hypocotyl color (green or purple), flower color (white or purple), pubes-cence color (gray or brown) and hilum color (buff, brown, yellow, black and imperfect black), denominated with Ro-man numerals, as shown in Table I.
SSR loci
Twelve pairs of soybean primers flanking the micro-satellite regions, previously developed and published by Creganet al.(1999), were selected. They were synthesized by Bio Synthesis Inc., Texas, USA, and coded as Satt 002, Satt 005, Satt 009, Satt 102, Satt 173, Satt 263, Satt 307, Satt 308, Satt 309, Satt 335, Satt 406, and Sct_189.The se-quences of the Forward and Reverse primers are available at the soybean Website USDA-ARS Soybean Genome Da-tabase (http://129.186.26.94/SSR.html). The primers com-prise 12 of the 20 soybean linkage groups, chosen because they had presented polymorphism in previous studies and/or because of their trinucleotide nature.
PCR amplification of SSR loci
PCR amplification was performed on each of the 186 soybean genotypes, using primers for each SSR locus. Re-action mixtures contained 30ng of soybean genomic DNA, 0.2µM 3’ and 5’ end primers, 200µM of each nucleotide, 1 X PCR Buffer containing 50 mM KCl, 10 mM Tris-HCl pH 8.9, 2.0 mM MgCl2, and 1 unit of Taq DNA
polymer-ase, in a total volume of 25µL. For primers Satt 002, Satt 005 and Satt 009, the MgCl2concentration was changed to
2.5 mM for better amplification. A thermal cycler (PCR Machine Robocycler, Stratagene) was programmed for 2 min at 94 °C, followed by 32 cycles of 1 min at 94 °C, 1 min at 47 °C and 1 min at 72 °C, and a final cycle of 10 min at 72 °C.
Amplification products were separated in denaturing gels containing 10% polyacrylamide, 8 M urea and 1 X TBE, during approximately 4 h at 15 mA. The size of each band was estimated by a 25-bp DNA Ladder (Life Technol-ogies-Gibco BRL). Amplified SSR fragments of different sizes were considered as different alleles. The fragments were detected by silver staining, following the Sanguineti
et al. (1994) protocol.
Statistical analysis
The gene diversity (Weir, 1990) was calculated as: 1
-ΣPij2, where Pijis the frequency of the jthallele at the ith
lo-cus, summed across all alleles in the locus.
A genetic dissimilarity coefficient was calculated for each pair of cultivars, according to Diwan and Cregan
(1997), to determine the effectiveness of the group of twelve SSR loci in distinguishing each of the 186 cultivars. These authors state that in elite soybean cultivars (that are often derived from identical plants), 12.5% to 6.25% of het-erozygous loci remain in the F4and F5generations,
respec-tively, whereas such a heterozygosity might be expressed as a mixture of two different homozygotes in later genera-tions. Therefore, they suggest that the segregating bulks should be taken into account in the identification of soy-bean cultivars. They indicate a computer program to com-pare each pair of loci and attribute them either similarity or dissimilarity values. In order to obtain a dendrogram with significance values, the bootstrap procedure was applied over the original databank, allowing the construction of 100 different ones, by sorting with replacement of 12 loci, as suggested by Felsenstein (1985). For each databank, Microsoft Excel software, Version 5.0, was used to draw a spreadsheet where each locus of two cultivars would score 1.0 if they shared the same alleles, that is, if both alleles had the same size; 0.5 if only one of the alleles was the same, and 0 if they did not have the same alleles. These values were used to calculate a simple genetic dissimilarity coeffi-cient (1 - Score/12) between each pair of cultivars. The 100 matrices of genetic dissimilarity coefficients were used to construct a consensus UPGMA (Unweighted Pair-Group Method using Arithmetic Average) dendrogram, using the NEIGHBOR and CONSENSE programs contained in the PHYLIP package (Phylogeny Inference Package), Version 3.57c (Felsenstein, 1989). The capacity of the markers to distinguish between morphologically similar groups was also determined by calculating the genetic similarity coeffi-cients (1 - genetic dissimilarity coefficient) of each pair of cultivars in 14 out of the 15 groups shown in Table I, since one of the identified groups consisted of only one cultivar.
Results
SSR polymorphism in 186 soybean cultivars
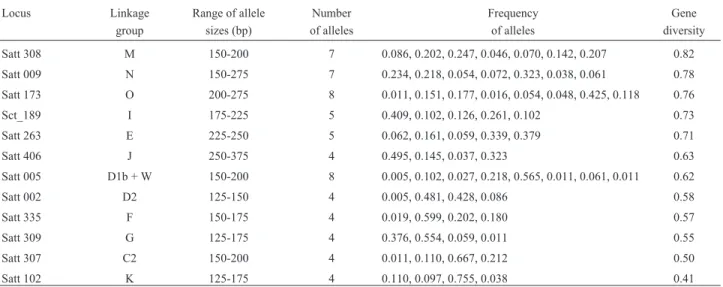
All the 12 SSR loci were polymorphic, as shown in Table II. The number of alleles per locus varied from four to eight, with an average of 5.3 alleles per locus, distributed among the 186 cultivars. The frequency of seventy-five percent of the 64 detected alleles was lower than 0.25, and that of the remaining 25% was equal to or higher than 0.25. Only one allele in Satt102 showed a frequency higher than 0.75, and two alleles had frequencies lower than 0.01, one in locus Satt005 and the other in locus Satt002. These val-ues confirm the good distribution and the representative as-pect of the alleles in the studied sample. The genetic diversity (GD), which is indicative of the effectiveness of SSR loci information, was also relatively high, ranging from 0.41 to 0.82, with a mean value of 0.64±0.12.
and FT 103 with regard to FT 104. Embrapa 1 (IAS 5RC) and RS 9 (Itaúba) derive from IAS 5. The first one resulted from a backcross of IAS 5 during five generations, and the second one, from a cross between FT 2 and IAS 5. In spite of their unknown origin, the two other cultivars, FT 103 and FT 104, were developed by the same institution by crossing many progenitors (bulk), which does not exclude the possi-bility that they may have similar origins. Another point to be noted concerning these similar cultivars is that the alleles of the 12 loci which constituted their profile were precisely the most frequent, although the probability of finding identical individuals at random in this sample was practically null.
The genetic dissimilarity coefficients found in the cultivar comparison matrix were relatively high. The distri-bution analysis of the 17,205 pairwise comparisons (Figure 1) revealed extreme values. Zero indicated similar culti-vars, and 1 indicated different cultivars. However, most of the values lied between 0.4 and 0.9, rather indicating a dis-similarity level among the cultivars than the opposite.
The 12 SSR loci were also successful in distinguishing cultivars with identical morphological traits (Table III). The mean similarity value among cultivars belonging to the same group was 0.46. There were totally different cultivars in the same group (coefficient 0.0), as in groups seven and nine, but the average for the minimum similarity values of all groups was 0.25. Although completely similar cultivars (coefficient 1.0) were present in groups 1 and 3, as mentioned above, the mean of the maximum similarity values was 0.81. Therefore, out of the 24 possible comparisons between two morpholog-ically similar cultivars (12 loci x 2 possible alleles), 11 were observed to be identical, on average.
Table II- Linkage group, allele size range, number, frequency, and gene diversity of 12 SSR loci in 186 soybean cultivars.
Locus Linkage
group
Range of allele sizes (bp)
Number of alleles
Frequency of alleles
Gene diversity
Satt 308 M 150-200 7 0.086, 0.202, 0.247, 0.046, 0.070, 0.142, 0.207 0.82
Satt 009 N 150-275 7 0.234, 0.218, 0.054, 0.072, 0.323, 0.038, 0.061 0.78
Satt 173 O 200-275 8 0.011, 0.151, 0.177, 0.016, 0.054, 0.048, 0.425, 0.118 0.76
Sct_189 I 175-225 5 0.409, 0.102, 0.126, 0.261, 0.102 0.73
Satt 263 E 225-250 5 0.062, 0.161, 0.059, 0.339, 0.379 0.71
Satt 406 J 250-375 4 0.495, 0.145, 0.037, 0.323 0.63
Satt 005 D1b + W 150-200 8 0.005, 0.102, 0.027, 0.218, 0.565, 0.011, 0.061, 0.011 0.62
Satt 002 D2 125-150 4 0.005, 0.481, 0.428, 0.086 0.58
Satt 335 F 150-175 4 0.019, 0.599, 0.202, 0.180 0.57
Satt 309 G 125-175 4 0.376, 0.554, 0.059, 0.011 0.55
Satt 307 C2 150-200 4 0.011, 0.110, 0.667, 0.212 0.50
Satt 102 K 125-175 4 0.110, 0.097, 0.755, 0.038 0.41
Figure 1- Distribution of genetic distances calculated for 17,205 pairs of genotypes.
Table III- Mean, maximum and minimum similarity coefficients calcu-lated between cultivars within morphologically identical groups based on 12 SSR loci.
Morphological groups
Similarity coefficients
Mean Maximum Minimum
1 0.41 1.00 0.08
2 0.38 0.50 0.25
3 0.42 1.00 0.13
4 0.37 0.79 0.04
5 0.50 0.75 0.29
6 0.50 0.50 0.50
7 0.32 0.92 0.00
8 0.42 0.92 0.17
9 0.33 0.92 0.00
10 0.92 0.92 0.92
11 0.45 0.92 0.13
12 0.36 0.67 0.17
13 0.71 0.71 0.71
14 0.42 0.79 0.17
Germplasm
The consensus tree relating the 186 cultivars based on the twelve SSR loci (Figure 2) expresses the distinction of groups with maximum and minimum similarities. The re-sults were also highly consistent with regard to the ances-tral descent of the groups, and identified groups with some degree of parentage. For instance, cultivars FT Eureka, Ocepar 8, BRSMG Virtuosa, and almost all the cultivars in the group named Paraná are in the same group as Paraná. Furthermore, all of them descended either from Paraná or from a selection of it. For the same reason, IAC 8, IAC 8-2, BR IAC 21, IAC 17, IAC 18, CAC 1, and CS 303 are in the same group as their ancestor Bragg. Similarly, other groups contain small sets of cultivars, all of them related to the same common ancestral, as shown in Figure 2.
Many of the ancestral genotypes mentioned present some degree of parentage. Dourados, for instance, is a se-lection of Andrews, which, in turn, is a sese-lection of Santa Rosa. Bragg and FT Cristalina share a common parent, D492491; Paraná and IAS 5 also share a common parent, Hill. All of them are ancestors of other groups.
There was only about 10% discrepancy between the dendrogram and the constituted pedigree, such as the inclu-sion of MG/BR 46 Conquista in the group containing Santa Rosa, BRSMS Piracanjuba, FT Estrela and RB 603 in the IAS 5 group, as well as all the X-marked cultivars in Figure 2. This incongruity, along with the lack of common pa-rental in some clusters, may mean either that there is no par-entage with the indicated ancestral genotype or that precise data on its pedigree are lacking.
Except for the genetic relationships of a variety being selected from another or pedigree relationships, the analy-sis did not show any correlation with growing habits, simi-lar morphology or geographical origin among the groups.
The dendrogram also revealed which North-American varieties more effectively contributed to the for-mation of this group of Brazilian cultivars. Santa Rosa, D492491 (sister line of Lee), Hill, Davis and Hood were most frequently used as parents, since they were directly or indirectly identified in most of the clusters.
Discussion
The polymorphism of SSR loci detected in this study was consistent with previous studies by Akkaya (1992), Morgante and Olivieri (1994), Maughan et al. (1995), Doldiet al.(1997) and Narvelet al.(2000), but lower than that obtained by Rongwen (1995) and Diwan and Cregan (1997). One possible reason for this difference is that the materials used in the present study were all from breeding programs, thus having a relatively narrow genetic base. In a study on genetic diversity in soybean, 11 to 26 alleles per microsatellite primer pair were amplified from 96 soybean genotypes, but this number was reduced by five to 10
alelles per primer pair in 26 cultivars from North-American breeding programs (Rongwenet al., 1995).
The obtained gene diversity (GD) was in agreement with the data of Rongwenet al.(1995), who found a mean value of 0.74 in a group of 96 soybean genotypes. It is in line with the results of Diwan and Creagan (1997), who found mean GD values close to 0.69 in a group of 36 com-mercial soybean lines, and in agreement with the data of Narvelet al.(2000), who detected a mean value of 0.50±
0.02 in a group of 39 elite cultivars.
The presence of low-frequency alleles in some SSR, as observed in Satt002 and Satt005, may reflect the soybean microsatellite mutation rate, estimated at 10-5to 10-4per generation (Diwan and Cregan, 1997). These authors ar-gued that such a rate is similar to the human rate, and that it should not be a hindrance to the use of SSR for cultivar identification. They also stated that soybean cultivars should be described for identification based on a bulk of 30 to 50 plants, since possible mutation alleles would not be detected and, therefore, mutations in isolated plants would not alter the allelic constitution of the cultivar. However, Songet al.(1999), using this procedure, detected 10 new al-leles in 66 soybean cultivars, that were not present in the 35 ancestral lines; and Narvelet al.(2000) recorded 32 alleles specific for elite cultivars, within a total of 397 alleles that had been detected in 40 lines and in 39 soybean cultivars.
The genetic dissimilarity coefficient derived from the 12 studied loci presented a mean variation of 0.63, which means that, on average, two genotypes presented 15 alleles that differed from one another. Table II shows that, even in groups which are similar for certain morphological traits, the mean average value obtained was 0.46, or 11 common alleles. These results were favorable to the loci, as far as distinguishing the assayed cultivars is concerned.
The existence of non-distinguished cultivars in the sample may reflect the narrow genetic base of the gene pool of Brazilian soybean germplasm. Hiromoto and Vello (1986) already reported that, in that year, all recommended cultivars had derived from only 26 ancestral genotypes, nine of which were responsible for more than 80% of that gene set, and only four of them being responsible for 50% of it. This picture was not so different in the following years, since Abdelnooret al.(1995) did not find much vari-ation (14.2 to 20.5%) in the genetic distances among 38 Brazilian soybean cultivars, as estimated by RAPD molec-ular markers.
The obtained data suggest that this group of 12 micro-satellite loci can be used to distinguish Brazilian soybean cultivars from each other, inasmuch as 98.9% of the as-sayed cultivars could be identified. Furthermore, in refer-ring to some morphological traits, identical cultivars could be distinguished by the same SSR loci in 12 out of the 14 es-tablished groups. Despite the existence of four non-distin-guished cultivars, which, as mentioned above, were closely related in their formation, the use of these 12 SSR loci may
be a feasible alternative in identifying and evaluating the soybean to be protected.
Acknowledgements
This work was supported by CAPES and FAEPA-HC-FMRP. Pedro Roberto R. Prado provided valuable technical assistance during the course of this study. Leones de Almeida, Milton Kaster, Roberto Zito, Nelson R. Braga and João Alberine provided samples and information about cultivars indicated in this study.
References
Abdelnoor RV, Barros EG and Moreira MA (1995) Determina-tion of diversity within Brazilian soybean germplasm using random amplified polymorphic DNA techniques and com-parative analysis with pedigree data. Braz J Genet 18:265-273.
Akkaya MG, Bhawat A and Cregan PB (1992) Length poly-morphisms of simple sequence repeat DNA in soybean. Ge-netics 132:1131-1139.
Cregan PB, Bhagwat AA, Akkaya MS and Rongwen J (1994) Microsatellite fingerprinting and mapping of soybean. Me-thods Mol Cell Biol 5:49-61.
Cregan PB, Jarvik T, Bush AL, Shoemaker RC, Lark KG, Kahler ALet al.(1999) An integrated genetic linkage map of the soybean genome. Crop Sci 39:1464-1490.
Diwan N and Cregan PB (1997) Automated sizing of fluores-cent-labeled simple sequence repeat (SSR) markers to assay genetic variation in soybean. Theor Appl Genet 95:723-733. Doldi ML, Vollmann J and Lelley T (1997) Genetic diversity in
soybean as determined by RAPD and microsatellite analy-sis. Plant Breeding 116:331-335.
Doyle JJ and Doyle JL (1990) Isolation of plant DNA from fresh tissue. BRL Focus 12:13-15.
Embrapa (2000) Recomendações Técnicas para a Cultura da Soja na Região Central do Brasil 2000/01. Embrapa Soja/Fun-dação MT, Londrina, 245pp.
Felsenstein J (1989) Phylip-phylogeny inference package (ver-sion 32). Cladistics 5:164-166.
Felsenstein J (1985) Confidence limits on phylogenies: an ap-proach using the bootstrap. Evolution 39:783-791. Hiromoto DM and Vello NA (1986) The genetic base of Brazilian
soybean cultivars. Braz J Genet 9:295-306.
Hokanson SC, Szewc-McFadden AK, Lamboy WF and McFerson JR (1998) Microsatellite (SSR) markers reveal genetic identities, genetic diversity, and relationships in a Malus x domestica Borkh. core subset collection. Theor Appl Genet 97:671-683.
Kresovich S, Szewc-McFadden AK and Bliek SM (1995) Abun-dance and characterization of simple-sequence repeats (SSRs) isolated from a size fractionated genomic library of Brassica napus L. (Rapessed). Theor Appl Genet 91:206-211.
Maughan PJ, Saghai-Maroof MA and Buss GR (1995) Micro-satellite and amplified sequence length polymorphisms in cultivated and wild soybean. Genome 38:715-723. Morgante M and Olivieri AM (1994) Genetic mapping and
Narvel JM, Fehr WR, Chu WS, Grant D and Shoemaker RC (2000) Simple sequence repeat diversity among soybean plant introductions and elite genotypes. Crop Sci 40:1452-1458.
Powell W, Machray GC and Provan J (1996) Polymorphism re-vealed by simple sequence repeats. Trends in Plant Science 1:215-222.
Rongwen J, Akkaya MS, Lavi U and Cregan PB (1995) The use of microsatellite DNA markers for soybean genotype identifi-cation. Theor Appl Genet 19:43-48.
Sanguineti C, Dias-Neto E and Simpson AJG (1994) RAPD silver staining and recovery of PCR products separated on poly-acrylamide gels. Biotechniques 17:914-921.
Song QJ, Quigley CV, Nelson RL, Carter TE, Boerma HR, Strachan JRet al.(1999) A selected set of trinucleotide sim-ple sequence repeat markers for soybean cultivar identifica-tion. Plant Var Seeds 12:207-220.