Biochemical and molecular investigations on qualitative and quantitative Hb
polymorphism in the river buffalo (
Bubalus bubalis L
.) population reared in
Southern Italy
Mario Iorio1, Donatella Vincenti1, Mario Annunziata1, Rosario Rullo1, Raffaele Bonamassa1, Aldo Di Luccia2and Elisa Pieragostini3
1
IABBAM, National Research Council, Napoli, Italy. 2
University of Bari, Dept. of Animal Production, Bari, Italy. 3
University of Bari, Dept. Engineering and Management of the Agricultural, Livestock and Forest Systems, Bari, Italy.
Abstract
On 398 river buffalo samples, randomly collected in distinct breeding areas of the Campania region, high-resolution analytical systems were used to identify both qualitative and quantitative variations of the Hb phenotype. Polyacrylamide gel isoelectric focusing and HPLC were used to determine the ratio between HBA1 and HBA2 globin chains; restriction endonuclease analysis was performed to assess whether quantitative variations in Hb bands were related to an unusual number ofα-globin genes. In the two buffalo subpopulations, allele frequencies of the alpha and beta globin systems were calculated, and F statistics (FIS, FIT and FST) were estimated as parameters of genetic diversity. The results suggest that: i) as shown by RFLP analysis, only a couple of associatedαglobin genes account for the quantitative variations recorded at the phenotypic level; ii) as expected, in theαglobin gene system (HBA), the frequency of haplotype B (HBA-B) largely exceeded that of haplotype A (HBA-A) (95.1% vs 4.9%); iii) the frequency of the usual allele at the beta locus is 0.6, as opposed to 0.4 of the slow variant; iiii) the most significant component of variation of the genetic system of hemoglobin is between individuals within the same location.
Key words:phenotype,RFLP, globin genes, haplotype, gene frequencies.
Received: February 24, 2003; Accepted: December 16, 2003.
Introduction
The biochemical polymorphism of hemoglobin in the water buffalo has been previously described, both by inves-tigating the possible adaptive significance of buffalo hemo-globin structure and thermodynamic properties (Giardinaet al., 1992) and by analysing the variation in the alpha globin system and beta globin locus (Di Lucciaet al., 1989; Di Lucciaet al., 1991a; Di Lucciaet al., 1991b).
In buffaloes, as in humans and most other mammals, there are two alfa globin genes (Iαand IIα), which are ex-pressed at different levels, the upstream gene being the most efficient. Thus, when the loci show characteristic dif-ferences in the average level of globin production, many genotypes can be deduced by the relative densities of the electrophoretic bands.
The buffalo duplicated haplotypesHBA-Aand HBA-Bproduce four alpha globin chains, corresponding to an
equal number of electrophoretically distinguishable Hbs. Isoelectric focusing patterns in ultra-narrow pH gradients show three phenotypes, the most frequent of which (BB) consists of a major (Hb2) and a minor (Hb4) hemoglobin. The rarer phenotype AA also consists of a major hemoglo-bin (Hb1) and a minor one (Hb3), whilst phenotype (AB) exhibits the four hemoglobins (Di Lucciaet al., 1989).
With the finding of an electrophoretically slower β-globin chain, provisionally called beta slow, the number of hemoglobins which can be found in one individual raises up to eight (Di Lucciaet al., 1991a).
The Campania region (Southern Italy) has long been a home to river buffalo breeding, strictly connected with the cheese-making of the traditional “mozzarella”. Of the 250,000 buffaloes living in Italy, more than 80% are bred in the provinces of Salerno and Caserta (ANASB, 2001). These two breeding areas are different from each other, as far as both animal management and breeding systems are concerned. Thus, a survey was carried out on the two river buffalo subpopulations, to estimate the amount of variation www.sbg.org.br
Send correspondence to Elisa Pieragostini. University of Bari, Fac-ulty of Agriculture. E-mail: [email protected].
at the alpha and beta globin loci and to check the homoge-neity of the hemoglobin system in the overall buffalo popu-lation living in Campania.
This paper reports the results obtained from 398 sam-ples, randomly collected in the two breeding areas and pro-cessed as follows: i) high-resolution analytical systems were used in order to identify both qualitative and quantita-tive variations of the Hb phenotype; ii) restriction endo-nuclease analysis was performed, to assess whether quantitative variations in Hb bands were related to an un-usual number of α-globin genes; iii) in the two buffalo sub-populations, allele frequencies of the alpha and beta globin systems were calculated, and F statistics (FIS, FIT and FST) were estimated as parameters of genetic diversity.
Material and Methods
Sampling and sample preparation
Within the buffalo population, 398 individuals of both sexes were randomly sampled in the two breeding ar-eas. Based on prior evidence, the sampling protocol was de-signed to detect both a gene frequency of 4% and of 40%, the former percentage concerning the alpha globin genetic system and the latter one the beta locus.
Setting the level of confidence at 0.95, the sample size was determined by the following formula
n d
P P
=
× −
2
2
196. exp(1 exp)
where:n= required sample size;Pexp= expected frequency;
d= desired precision (Thrusfield, 1995).
Blood samples were treated by standard procedures, as described by Di Luccia et al. (1991b) and Huisman (1986).
Electrophoresis and densitometry of hemoglobins
To investigate the Hb polymorphism and define Hb phenotypes, hemolysates were analyzed by isoelectric fo-cusing (IEF) on immobilized ultra-narrow pH (7.1-7.5) gradient (IPG), as previously described (Di Lucciaet al., 1991b; Di Lucciaet al., 1989). Routine analyses were per-formed on gel slabs from conventional IEF in a pH 6.7-7.7 gradient (Di Lucciaet al., 1991a) and scanned with a com-puterized enhanced laser densitometer Ultroscan XL equipped with Gelscan 2.0 software from Pharmacia-LKB (Uppsala, Sweden).
RP-HPLC of alpha and beta globins
As the densitometric evaluation of Hb bands showed a large variability and did not allow to fit for certain all the phenotypes in the frame of the globin expression ratio ex-pected on the basis of alpha duplicated arrangements, all the hemolysates were analysed by RP-HPLC, in order to control the recorded variation at the quantitative tetramer level. Globin chains were separated by reversed-phase
HPLC, according to Sheltonet al. (1984), with appropriate modifications for the study of non-human globin chains (Di Lucciaet al., 1991b; Mancaet al., 1990; Schroederet al., 1985).
RFLP of alpha globin genes
RP-HPLC of alpha and beta globin confirmed the ex-istence of a certain number of individuals whose Hb band proportions were out of the normal range as expected on the basis of a normally duplicatedαglobin gene arrangement. Thus, RFLP analysis was used to establish whether abnormal hemoglobin phenotypes resulted from duplicated or from multiple genes. To check the number ofαgenes, all homozygotes at the βlocus were chosen, total genomic DNA was extracted from their leukocytes and then com-pletely digested with HindIII, EcoRI, BamHI, KpnI and BstEII enzymes. Digested DNA was fractionated in 0.8% agarose gels in 40 mM Tris-borate buffer containing 50 mM EDTA, pH 8, and transferred to Gene-bind 45 membranes (Pharmacia Biotech), as described by Goossens and Kan (1981). Plasmid pGα2 (Southern, 1975) containing the goat α2-globin gene was digested with EcoRI to obtain a 1.3 kb fragment containing theα2 goat globin gene, that was then labeled with32P (MegaprimeTM DNA labeling system - Amersham) and used to probe the nylon filters.
Statistics
The effects of genotype as shown by densitometric evaluation of single Hb bands and chromatographic deter-mination of globin peaks were evaluated by least square variance analysis, in order to compare the observed alpha globin and Hb proportions with those expected based on the differential gene expression in duplicatedαglobin gene ar-rangements in Mammals.
The frequencies of theAandBalpha haplotypes and of theB and BS beta alleles were estimated by the GE-NEPOP program (Raymond and Rousset, 1995), also uti-lized to check the Hardy-Weinberg equilibrium.
Genetic diversity and its partition within and among subpopulations were quantified by FST, FISe FIT(Wright,
1965),and their statistical significance was evaluated by the
F-STAT program (Goudet, 1995).
Results
Nomenclature
nomen-clature (Sandberg and Cothran, 2000), the buffalo HBA
haplotypes were namedAandB,and the presence of the beta slow variant was indicated by simply adding a superscripted letter “s” to the usual alleleHBB(HBBs) or to the HBA phenotypes (ABAsBs, AsBs, BsBs). More accurate indications will be suggested as soon as the protein amino acid sequence is available and the amino acid substitutions are known. Presently we can only conclude that the small differences in migration of the tetramers carrying different beta alleles (Figure 1 and Figure 2) suggest that the HBBS variant is the result of a conservative mutation which, based on HPLC analyses, should be a neutralvsneutral amino-acid substitution (Figure 3).
Qualitative hemoglobin phenotypes
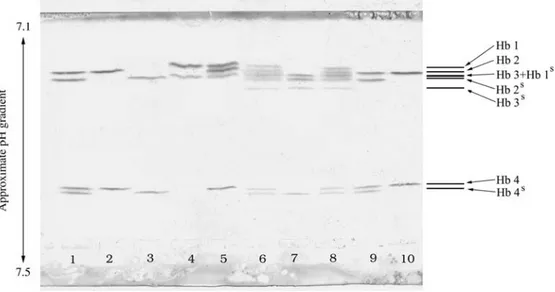
Isoelectrofocusing analysis of river buffalo hemo-globins with ultra-narrow immobilized pH (7.1-7.5) gradi-ents revealed eight tetramers (Figure 1), six of which focused on the anodal side with minute differences in their isoelectric points (pI), while the remaining two focused on the cathodal side. Single phenotypes showed from two to seven tetramers.
The phenotype AA (lane 4) has two hemoglobins, (Hb1 and Hb3) which differ in pI by about 0.02 pH units, due to the amino acid substitutions 129 Leu→Phe and 131 Ser→ Asn in theαchain (Ferrantiet al., 2001).
The phenotype BB (lane 2) consists of Hb2 and Hb4, which differ in 10 Val→Ile and 11Gln→Lys amino acid substitutions. The Hb4 pI is higher than the Hb2 pI by about 0.2 pH units, due to the charged amino acid substitution 11Gln→ Lys. The pI of Hb2 is between that of Hb 1 and that of Hb 3, being 0.008 pH higher than Hb1, as a result of two neutral amino acid substitutions at position 10
(Val→ Ile) and 64 (Asn→Ala) in theαchain (Ferrantiet al., 2001).
Figure 1- Isoelectric focusing of the river buffalo hemoglobin on immobilized pH gradients (7.1 - 7.5). Lanes 1 and 9 - heterozygote BBs; lanes 2 and 10 -homozygote BB; lane 3 - -homozygote BsBs; lane 4 - homozygote AA; lanes 5 - heterozygote AB; lanes 6 and 8 - heterozygote ABAsBs; lane 7 -heterozygote AsBs. Superscript “s” assigned to Hb and its phenotypes indicates the presence of one of the two variantβ-globin chain.
The BSBSphenotype shown in lane 3 consists of Hb2S and Hb4S, both with a pI slightly higher than the Hbs of the BB phenotype, due to the presence of the beta slow globin chain. Lanes 1 and 9 show the BBSpattern, and lanes 6 and 8 exhibit the pattern of the ABASBSphenotype. This pheno-type, never reported before, shows seven of the expected eight hemoglobins, because Hb2Sis characterized by a pI that is very similar to that of Hb3, differing in pH by less than 0.004 pH units.
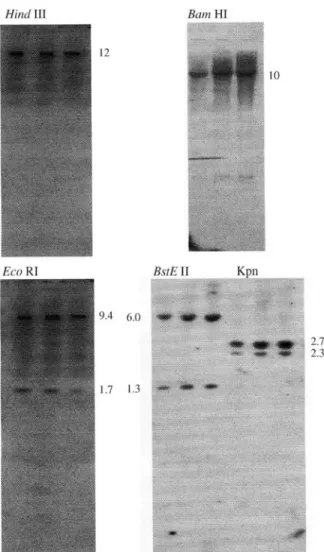
RFLP analysis
The results of the RFLP analysis confirmed the pres-ence of only duplicated haplotypes in all the examined sam-ples. Total genomic DNA from three BB individuals with different proportions ofα-globin chains was digested with five restriction endonucleases: EcoRI, HindIII, BamHI, KpnI and BstEII. The different patterns obtained are shown in Figure 4. The restriction enzymes HindIII and BamHI produced a single band of 12 kb and 10 kb, respectively, while two bands were found with EcoRI (9.4 kb and 1.7 kb) and KpnI (6.0 kb and 1.3 Kb). Only BstEII cleaved DNA within the gene, as reported in goats and sheep (Schonet al., 1981; Sambrooket al, 1989), producing two bands of 2.7 kb and 2.3 kb, respectively. Figure 4 clearly illustrates the overall results in that, despite the different proportions recorded at the levels of hemoglobin and alpha globin (in the samples above), there are undoubtedly no differences between their restriction patterns.
As to the wholeα-globin gene cluster, Figure 5 shows the restriction enzyme map obtained after double-diges-tions. The HindIII and BamHI digests contain at least two genes, while EcoRI and KpnI show intergenic sites.
Quantitative hemoglobin and alpha and beta globin
Once the number of alpha globin genes was ascer-tained, all the quantitative data were considered in the frame of double arrangements.
The means and standard deviations obtained by statis-tical analysis of the Hb band densitometric values are shown in Table 1, making it clear that Hb2 bands are about 1.8 fold more intense when compared to those of the Hb4
Figure 3- Reversed-phase high performance liquid chromatography of lysates of ABAsBsHb phenotype. The numbering of theαchains is the same as that of the associated Hb tetramers in Figure 1.
Figure 4- Southern blot analysis of genomic buffalo DNA digested with restriction endonucleases. The samples were of phenotype BB that con-tained different Hb2:Hb4 ratios (approx. 55:45, 65:35 and 75:25). The fragment sizes are given in kb.
bands. The data refer only to 362 single samples which were homozygous for the alpha gene arrangement B, but both homozygous and heterozygous at the beta locus (B and BSalleles). Least square variance analysis showed that the effect of the genotype on the percentage values was non-significant.
Percent gene efficiencies (mean±sd) from the 5’ to the 3’ end, as calculated by densitometric data in the buf-falo, are reported in Table 2, compared to those found in sheep (Pieragostiniet al., 2003).
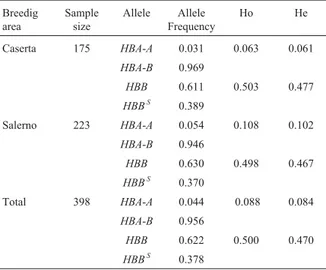
Allele frequencies and population parameters Table 3 shows the alpha and beta allele frequencies for river buffalo hemoglobins. No allelic frequency devia-tion from the Hardy-Weinberg equilibrium was found, and
the comparison between expected and observed heterozy-gotes (Table 3) shows no signs of decline in heterozygosity. Table 4 shows the F statistics used as heterozygosity calcu-lations to estimate the differentiation among subpopula-tions. Fis and Fit are relatively higher than Fst for both loci, indicating that local inbreeding and population subdivision may have some influence, while the variance of allele fre-quencies among populations is very low; the FSTvalue
indi-cates that only 1% of the variance is due to genetic differentiation among sub-populations, while 99% of the variance lies within the population.
Discussion
The main points emerging from these results are two. The first one refers to the allele polymorphism and the ge-netic differentiation of the examined buffalo subpopu-lations as to their hemoglobin system. The other concerns the high variability of the quantitative data,i.e., of the out-put of alpha genes, as deduced from the concentration of differentαglobin chains obtained by integrating RP-HPLC chromatographic peaks and from the densitometric evalua-tion of the respective Hb PAGIF bands.
a) Allele polymorphism
As to theHBAallele frequencies in the buffalo popu-lations world-wide, haplotype A is generally less common than haplotype B. The findings reported in this paper, indi-cating a 4.9% frequency for haplotype HBA-A and 95.1% for haplotype HBA-B, offer confirmation both of the above trend and of the results obtained in previous surveys of the Italian buffalo population (Iorio and Annunziata, 1986; Masinaet al., 1977).
Conversely, there are no reference data as toHBB, this locus being previously thought to be monomorphic. Theβallele frequencies found in this screening were 62.4% for the wild type and 37.6% for the so-called slow allele, in-dicating that the latter must be considered a common allele.
The F-statistics estimates based on hemoglobin ge-netic systems showed no significant departure from the Hardy -Weinberg expectation for the buffalo population. The estimates of FST population differentiation were not significantly greater than zero, indicating that the most sig-nificant component of variation in the hemoglobin genetic system is among individuals within the same location. Based on these results, the variation between local sub-populations seems to be negligible, but the hemoglobin sys-tem does not contain sufficiently informative variables to
Table 2- Percent gene efficiencies (mean±sd), from the 5’ to the 3’ end as calculated by densitometric data in buffalo and sheep.
Specie N Iα IIα Iα/IIα Reference
Buffalo 362 32.56±3.12 17.5±2.6 1.86 Present paper
Sheep 30 32.2±2.68 17.6±1.91 1.83 Pieragostini et al., 2002
Table 3- Allele frequencies at the alpha (HBA) and beta (HBB) systems and observedvsexpected heterozygotes in the two province subpopu-lations and in the total population.
Breedig area
Sample size
Allele Allele Frequency
Ho He
Caserta 175 HBA-A 0.031 0.063 0.061
HBA-B 0.969
HBB 0.611 0.503 0.477
HBBS 0.389
Salerno 223 HBA-A 0.054 0.108 0.102
HBA-B 0.946
HBB 0.630 0.498 0.467
HBBS 0.370
Total 398 HBA-A 0.044 0.088 0.084
HBA-B 0.956
HBB 0.622 0.500 0.470
HBBS 0.378
Table 1- Mean values and standard deviation of densitometric data ob-tained analysing buffalo Hb bands.
Phenotype BB BSBS BBS
N 133 47 182
Hb2 64.34±4.12 64.33±4.08 33.31±2.07 32.37±2.03
65.62±4.09
Hb4 34.93±3.46 34.40±3.96 17.60±2.5
16.98±2.53
34.58±3.67
Table 4- F-statistics estimates.
FIS FST FIT
HBA -0.047 0.004 -0.043
HBB -0.061 0.002 -0.063
draw final conclusions on the genetic structure of the water buffalo population of Campania.
b) Quantitative data
Different proportions of Hb tetramers may have mul-tiple causes.
Firstly, there are possible structural origins such as those ascribed to the presence of alpha globin extra genes found in different mammalian species; indeed, multiple copies ofα-globin genes have been observed in humans (Goossenset al., 1980; Higgset al., 1980; Liebhaberet al., 1986)), horses (Bowlinget al., 1988), apes (Zimmeret al., 1980), goat (Schon et al., 1982; Bergesen et al., 1991), sheep (Vestriet al., 1983; Ristaldiet al., 1995) and cattle (Scaloniet al., 1998). The presence of a trend of expression was widely confirmed; particularly in sheep triplicated and quadruplicated alpha-globin haplotypes, it was found that the alpha-chain output of the downstream genes progres-sively decreases (Vestriet al., 1991, 1994).
In the case of the river buffalo, the variation of the ra-tios Hb2:Hb4 among phenotypes cannot be explained by the presence of extra genes, because RFLP analysis clearly showed that there were no differences in the restriction pat-terns of the examined samples. Only two non-allelic genes were therefore responsible for the quantitative differences in hemoglobin.
Anyway, looking at the mean standard deviations in Table 1, the wide range of variability of the data is a fact. In-deed, the most striking aspect of the results reported in this paper is the size of the data set of quantitative records and, most of all, the general correspondence between the records obtained for the same individual by different analytical pro-cedures. This kind of variation has already been observed in previous studies on sheep with the same duplicated gene ar-rangements (Pieragostiniet al., 2003), where the mean val-ues recorded, as well as the variability ranges, were very similar to those of the buffalo (Table 2). It cannot be ex-cluded in any case that the variation may be due to analyti-cal or pre-analytianalyti-cal errors, but the apparent repeatability of the phenomenon may indicate that the possible presence of additional mechanisms of gene-expression regulation should not be neglected.
A certain range of quantitative hemoglobin pheno-types may be justified either by individual differences at “regulatory” loci closely linked to structural α-globin genes or by a different gene regulation occurring in
tandemly repeatedgenes.
In Sonoran deer mouse and Gambel’s deer mouse hemoglobins, the Hb ratios varied widely among individu-als within the same population, and extensive inheritance studies on mice have shown that this residual quantitative variation is under fine-scale genetic control (Snyder, 1980). Proudfoot (1986) demonstrated that transcriptional interference substantially inhibits the downstreamαgene by stimulating the transcription of the upstreamα gene.
This inhibition is modulated by transcriptional termination signals located between the two α genes. Recently, Shewchuk and Hardison (1997) have shown that the size of CpG islands in theα-globin gene cluster, which includes both 5’ flanking and intragenic regions, positively corre-lates with the level of gene expression, also suggesting that a mechanism at the chromatin structure level may be in-volved.
Apart from these considerations which invoke ge-netic mechanisms, even variables such as protein stability, efficiency of hemoglobin tetramer formation, and other factors can affect the steady-state levels of globin variants and the consequent repeatability of quantitative evaluation, both of globins and hemoglobins. In conclusion, the crucial point in this discussion is whether the quantitative variabil-ity recorded for the alpha globin system and the related hemoglobins in buffalo is of genetic or non-genetic origin. In our opinion, there are no answers to this question at pres-ent, and further investigations are needed.
Acknowledgments
The authors wish to thank Dr J.B. Lingrel for provid-ing the plasmid pGα2 containprovid-ing goatα2-globin gene, and Mr. C. Campanile for excellent technical support in the RFLP analyses.
References
ANASB (2001) Data from Associazione Nazionale Allevatori della Specie Bufalina.
Andresen E, Broad T, Di Stasio L, Dolling CHS, Hill D, Huston K, Larsen B, Lauvergne JJ, Laveziel H, Mahler X, Millar P, Rae, AL, Renieri C and Tucker EM (1991) Guidelines for gene nomenclature in ruminants. Genetics Selection Evolu-tion 23:461-466.
Bergersen O, Fosse VM and Nesse LL (1991) Differential expresion ofIα- andIIα-globin genes in Norwegian dairy goats. Animal Genetics 22:77-86.
Bowling AT, Scott AM, Flint J and Clegg JB (1988) Novel alpha hemoglobin haplotypes in horses. Animal Genetics 19:87-111.
Di Luccia A, Iannibelli L, Ferranti P, Iorio M, Annunziata M, and Ferrara L (1989) Water buffalo (Bubalus bubalis) hemo-globins: An electrophoretic and chromatographic study. Comparative Biochemistry and Physiology 94B:71-77. Di Luccia A, Iannibelli L, Addato E, Masala B, Manca L and
Ferrara L (1991a) Evidence for the presence of two different
β-globin chains in the hemoglobin of the river buffalo (Bubalus bubalis L.). Comparative Biochemistry and Physi-ology 99B:887-892.
Di Luccia A, Iannibelli L, Ferranti P, Manca L, Masala B and Ferrara L (1991b) Electrophoretic and chromatographic evi-dence for allelic polymorphisms in the river buffaloα -glo-bin gene complex. Biochemical Genetics 29:421-430. Ferranti P, Facchiano A, Zappacosta F, Vincenti D, Rullo R,
-Glo-bin Chains from River Buffalo (Bubalus Bubalis L.) hemoglobins. Journal of Protein Chemistry 20:171-179. Giardina B, Arevalo F, Clementi ME, Ferrara L, Di Luccia A,
Lendaro E, Belleli A and Condò SG (1992) Evolution of ru-minants divergence ox and buffalo hemoglobins. European Journal of Biochemistry 204:509-513.
Goossens M and Kan YY (1981) DNA analysis in the diagnosis of hemoglobin disorders. Methods in Enzymology 76:805-817.
Goossens M, Dozy AM, Embury SH, Zachariades Z, Hadjiminas MG, Stamatoyannopoulos G and Kan YW (1980) Tripli-catedα-globin loci in humans. Proceedings of The National Academy of Sciences USA 77:518-521.
Goudet J (1995) FSTAT, Version 1.2, a computer program to cal-culate F-statistics. Journal of Heredity 86:485-486. Higgs DR, Old JM, Pressley L, Clegg JB and Weatherall DJ
(1980) A novelα-globin gene arrangement in man. Nature 284:632-635.
Huisman THJ (1986) Introduction and review of standard meth-odology for the detection of hemoglobin abnormalities. In: Huisman THJ (ed) The Hemoglobinopathies. Methods in Hematology. Churchill Livingstone, Edinburgh, v 15 pp 32-46.
Iorio, M and Annunziata, M (1986) Biochemical polymorphism studies in Italian buffalo (Bubalus bubalis). Genetica Agraria 2:137-144.
Liebhaber SA, Cash FE and Ballas SK (1986) Humanαglobin gene expression. The dominant role of the α2 locus in mRNA and protein synthesis. Journal of Biological Chemis-try 261:15327-15333.
Manca L, Marsala B, Ledda S and Naitana S (1990) Separation of caprine globin chains by reversed phase-high performance chromatography: evidence for the presence of a silentβ -glo-bin allele in the Sardinian sheep. Journal of Chromatography B 563:158-165.
Masina P, Iannelli D, Iorio M and Ramunno L (1977) Hemoglobin polymorphism in Italian water buffalo (Bubalus bubalis
(Arnee). Animal Blood Groups and Biochemical Genetics 8:65-72.
Pieragostini E, Petazzi F and Di Luccia A (2003) The relationship between the presence of extra alpha-globin genes and blood cell traits in Altamurana sheep. Genetics Selection Evolu-tion in press.
Proudfoot NJ (1986) Transcriptional interference and termination between duplicated α-globin gene constructs suggest a novel mechanism for gene regulation. Nature 322:562-565. Raymond M. and Rousset F (1995) GENEPOP (version 1.2): pop-ulation genetics software for exact tests and ecumenicism. Journal of Heredity 86:248-249.
Ristaldi MS, Casula S, Rando A and Vestri R (1995) Sheepα -glo-bin gene sequences: implications for their concerted evolu-tion and for the down-regulaevolu-tion of the 3’ genes. Journal of Molecular Evolution 40:349-353.
Sambrook, JE Fritsch F and Maniatis T (1989) Molecular Clon-ing: A Laboratory Manual, 2nd ed, Cold Spring Harbor Lab-oratory, Cold Spring Harbor, NY.
Sandberg K and Cothran EG (2000) Blood groups and biochemi-cal polymorphisms. In: Bowling AT and Ruvinsky A (eds) The Genetics of the Horse, CABI Publishing, pp 85-108. Scaloni A, Pieragostini E, Malorni A, Ferrara L and Di Luccia A
(1998) Hemoglobinα-globin chain polymorphism in po-dolian cattle: primary structure determination of two new genetic variants by mass spectrometry and amino acid se-quencing. Biochimie 80:333-338.
Schon EA, Wernke SM and Lingrel JB (1982) Gene conversion of two functional goatα-globin genes preserves only minimal flanking sequences. Journal of Biological Chemistry 257:6825-6835.
Schroeder WA, Shelton JB, Shelton JR, Huynh V and Teplow DB (1985) High performance liquid chromatographic separa-tion of the globin chains of non-human hemoglobins. Hemo-globin 9:461-482.
Shelton JB, Shelton JR and Schroeder WA (1984) High perfor-mance liquid chromatographic separation of globin chains on a large pore C4column. Journal of Liquid Chromatogra-phy 7:1969-1977.
Shewchuk BM and Hardison RC (1997) CpG islands from the al-pha-globin gene cluster increase gene expression in an inte-gration-dependent manner. Molecular Cell Biology 17:5856-5866.
Snyder LRG (1980) Closely linkedα-chain hemoglobin loci in
Peromyscusand other animals: speculations on the evolu-tion of duplicate loci. Evoluevolu-tion 34:1077-1098.
Southern EM (1975) Detection of specific sequences among DNA fragments separated by gel electrophoresis. Journal of Mo-lecular Biology 98:503-517.
Thrusfield, M (1995) Veterinary epidemiology. 2nd edition. Blackwell Science, Oxford, England, pp 178-183. Vestri R, Giordano PC and Bernini LF (1983) Different
quantita-tive expression of the hemoglobinα-genes in sheep. Bio-chemical Genetics 21:1089-1099.
Vestri R, Pieragostini E and Ristaldi MS (1994) Expression gradi-ent in sheep alpha alpha and alpha alpha alpha globin gene haplotypes: mRNA levels. Blood 83:2317-22.
Vestri R, Pieragostini E, Yang F, Di Gregorio P, Rando A and Masina P (1991) Expression of triplicated and quadrupli-cated alfa globin genes in sheep. British Journal of Haema-tology 77:110-116.
Wright S (1965) The interpretation of population structure by F-statistics with special regards to systems of mating. Evol 19:395-420.
Zimmer EA, Martin SL, Beverley SM, Kan YW and Wilson AC (1980) Rapid duplication and loss of genes coding for the
α-chains of hemoglobin. Proceedings of The National Acad-emy of Sciences USA 77:2158-2162.