Regulation of
-Transducin and
-Gustducin
Expression by a High Protein Diet in the Pig
Gastrointestinal Tract
Roberto De Giorgio1, Maurizio Mazzoni2*, Claudia Vallorani2, Rocco Latorre2, Cristiano Bombardi2, Maria Laura Bacci2, Monica Forni2, Mirella Falconi3, Catia Sternini4,5,6, Paolo Clavenzani2
1Department of Medical and Surgical Sciences, University of Bologna, Bologna, Italy,2Department of Veterinary Medical Sciences, University of Bologna, Bologna, Italy,3Department of Biomedical and Neuromotor Sciences, University of Bologna, Bologna, Italy,4CURE Digestive Diseases Research Center, Digestive Diseases Division, Department of Medicine, David Geffen School of Medicine, University of California Los Angeles, Los Angeles, California, United States of America,5Department of Neurobiology, David Geffen School of Medicine, University of California Los Angeles, Los Angeles, California, United States of America,6Veterans Administration, Greater Los Angeles Health system, Los Angeles, California, United States of America
Abstract
Background
The expression of taste receptors (TASRs) and their signalling molecules in the gastrointes-tinal (GI) epithelial cells, including enteroendocrine cells (EECs), suggests they participate in chemosensing mechanisms influencing GI physiology via the release of endocrine mes-sengers. TASRs mediate gustatory signalling by interacting with different transducers, includingα-gustducin (Gαgust) andα-transducin (Gαtran) G protein subunits. This study
tested whether Gαtranand Gαgustimmunoreactive (-IR) cells are affected by a short-term
(3 days) and long-term (30 days) high protein (Hp) diet in the pig GI tract.
Result
In the stomach, Gαgustand Gαtran-IR cells contained serotonin (5-HT) and ghrelin (GHR),
while in the small and large intestine, Gαgustand Gαtran-IR colocalized with 5-HT-,
cholecys-tokinin (CCK)- and peptide YY (PYY)-IR. There was a significant increase in the density of Gαtran-IR cells in the pyloric mucosa in both short- and long-term Hp diet groups (Hp3 and
Hp30) vs. the control group (Ctr) (P<0.05), while the increase of Gαgust-IR cells in the pyloric
mucosa was significant in Hp30 group vs. Ctr and vs. Hp3 (P<0.05); these cells included Gαtran/ 5HT-IR and Gαtran/ GHR-IR cells (P<0.05 andP<0.001 vs. Ctr, respectively) as well
as Gαgust/5-HT-IR or Gαgust/ GHR-IR cells (P<0.05 andP<0.01 vs. Ctr, respectively). In the
small intestine, we recorded a significant increase in Gαtran-IR cells in the duodenal crypts
and a significant increase of Gαgust-IR cells in the jejunal crypts in Hp3 group compared to
HP30 (P<0.05). With regard to the number of Gαtran-GαgustIR cells colocalized with CCK or
5-HT, there was only a significant increase of Gαtran/ CCK-IR cells in Hp3 group compared
to Ctr (P= 0.01).
OPEN ACCESS
Citation:De Giorgio R, Mazzoni M, Vallorani C, Latorre R, Bombardi C, Bacci ML, et al. (2016) Regulation ofα-Transducin andα-Gustducin Expression by a High Protein Diet in the Pig Gastrointestinal Tract. PLoS ONE 11(2): e0148954. doi:10.1371/journal.pone.0148954
Editor:François Blachier, National Institute of Agronomic Research, FRANCE
Received:August 19, 2015
Accepted:January 25, 2016
Published:February 12, 2016
Copyright:© 2016 De Giorgio et al. This is an open access article distributed under the terms of the
Creative Commons Attribution License, which permits unrestricted use, distribution, and reproduction in any medium, provided the original author and source are credited.
Data Availability Statement:All relevant data are within the paper and its Supporting Information files.
Conclusion
This study showed an upregulation of selected subpopulations of Gαgust/ Gαtran-IR cells in
distinct regions of the pig GI tract by short- and long-term Hp diet lending support to TASR-mediated effects in metabolic homeostasis and satiety mechanisms.
Introduction
The gastrointestinal (GI) tract has the important task of food digestion followed by absorption and metabolism of nutrients such as amino acids, sugars and fatty acids. These food-derived
components are detected by a“nutrient chemosensing system”involving luminal sensors in
the GI mucosa [1–6], which send information to the nervous system to initiate physiological
responses regulating food intake and eating behaviour through the gut-brain axis [1–3,6]. The
identification of taste receptors (TASRs) and their signalling molecules along the mammalian GI tract and the observation that TASR ligands in the gut lumen induce functional responses such as activation of vagal afferents, alteration of food intake and GI motility, aversion, release
of peptides and regulation of glucose homeostasis [7–13], support a key role of these receptors
in the luminal chemosensing processes. In the GI tract, TASRs are expressed by epithelial cells,
mainly enteroendocrine cells (EECs). Their stimulationin vivoandin vitroinitiates a signalling
cascade that ultimately leads to release of chemical messengers [8,11,14]. This mechanism has
been postulated to activate neural reflex pathways including intrinsic and extrinsic neurons
affecting gut physiology and energy homeostasis [1–3,6].
TASRs are G-protein coupled receptors comprising two major families: the TAS1Rs family composed by three receptors (TAS1R1, TAS1R2 and TAS1R3) that function as dimers to detect
umami (TAS1R1 with TAS1R3) and sweet (T1R2 with TAS1R3) [15–17], and a large family of
TAS2Rs (about 25 subtypes in humans and>30 in rodents) that detect an array of diverse
bit-ter compounds [18,19]. Upon activation, TASRs coupled to G-protein related signalling
mes-sengers,α-gustducin (Gαgust),α-transducin (Gαtran), and other transducers as well, lead to the
intracellular Ca2+increase and cellular response. Gαgustand Gαtranhave been identified
throughout the digestive system, from the tongue down to the distal part of the GI tract of
dif-ferent mammalian and non-mammalian species [13,20–29]. The involvement of different G
protein subunits, such as Gαgust, Gαtranand other Gi-family alpha subunits, in taste
transmis-sion has been demonstrated by several findings including the observations that not all taste
cells contain Gαgust, that gustatory transduction was not completely abolished in mice with
deletion ofGαgustgene, and that Gαtrancan partially rescue the taste response in these mice
[30–32].
In our previous studies, we found that the TASR-related G protein subunits, Gαgustand
Gαtranin the gut are regulated by different diet manipulation, including fasting and refeeding,
high-fat diet and a low cholesterol mimicking diet in the mouse and porcine gut [27,28]. These
findings suggest plasticity in taste-related molecules in the GI tract in response to different feeding states and caloric intake. Increasing evidence support the notion that high protein diets reduce food intake, facilitate weight loss, and improve body composition in both humans and
animal models [33–35]. Thus, our study was designed to test whether short- and long-term
high protein (Hp) diet affected the expression of Gαgustand Gαtranimmunoreactive (IR) cells
throughout the pig GI tract. In addition, we characterized the phenotype of Gαgust-and Gαtran
-IR cells with special emphasis on chemical messengers such as peptides and biogenic amines involved in satiation and body weight regulation.
Materials and Methods
Animals
The experiments were performed at the Physiology unit of the Department of Veterinary Med-ical Sciences of the University of Bologna. The study was conducted according to relevant national and international guidelines on Animal Experimentations. The procedure was reviewed and approved in advance by the Scientific Ethics Committee for Animal Experimen-tation of the University of Bologna and by the Italian Ministry of Public Health. Twelve Large White/Duroc hybrid female pigs (12 weeks old, live weight 33.6 ± 3.05 kg) were purchased from a commercial breeder. Upon arrival, pigs were weighed, clinically examined and arranged in multiple boxes (n = 4 in each box) with slatted floor, previously cleaned and sanitized by an authorized operator. They were immediately fed with standard diet containing 14.5% protein (Big 30 Flour, Cooperativa Agricola Tre Spighe, Castel Guelfo, Bologna, Italy); tap water was freely available. The clinic exam ensured all the animals were healthy and did not show pathol-ogies that could interfere with the experimental results. All pigs were fed with standard diet for 2 weeks in order to allow the normalization of GI function. Animals were then randomly assigned to three experimental groups; one group (n = 4) received standard diet and served as control (Ctr); one group (n = 4) was fed high protein diet (35% protein) for 3 days (Hp3); and one group (n = 4) was fed high protein diet (35% protein) for 30 days (Hp30). The component of experimental diet, energy density as well as body weight and food consumption are
described inS1andS2Tables. Feeding behaviour was recorded every week and pigs were
weighed at the beginning and at the end of the experimental design (i.e., at 0, 3 and 30 days). At the end of the experiment, animals were euthanized with i.v. bolus of Tanax (embutramide, mebenzonio iodure, tetracaine) (10 mL / head; Intervet Italia Srl, Milan, Italy) after premedica-tion with i.m. azaperone 3 mg / kg (Stresnil; Janssen-Cilag SpA, Milan, Italy) and surgical anaesthesia, induced with 20 mg/kg ketamine i.m. (Ketavet 100; Intervet Italia Srl, Milan, Italy) and with an i.v. bolus of sodium thiopental (300 mg / animal, Pentothal Sodium; Intervet Italia Srl, Milan, Italy). We euthanized two animals for the Ctr group at 3 days and two at 30 days since in preliminary studies (data not shown) we did not see significant differences of mucosal morphology.
Samples collection
Specimens of the GI tract included stomach mucosa (cardiac, near the gastric diverticulum; pyloric, close to the pyloric sphincter), duodenum (about 10 cm from the pyloric sphincter), middle jejunum, ileum, cecum, ascending colon (near the centrifugal turns), descending colon
(about 25 cm from the anus) and rectum (in theampulla recti). Specimens were pinned flat on
balsa wood, fixed in 4% buffered paraformaldehyde / 0.1 M phosphate buffer, pH 7.4 for 48 h
at 4°C, dehydrated and embedded in paraffin [27].
Immunohistochemistry
Serial (5μm thick) sections mounted on poly-L-lysine-coated slides were subjected to single
and double immunofluorescence staining using antibodies directed to Gαtranor Gαgustand
spe-cific EEC subtype markers such as ghrelin (GHR), gastrin/cholecystokinin (GAS/CCK),
5-hydroxytryptamine (5-HT), peptide YY (PYY) shown inTable 1. Briefly, sections were
overnight with primary antibodies diluted in PBS and 5% of normal serum. After primary anti-body incubation, a mixture of fluorescein isothiocyanate (FITC)-conjugated, tetramethyl
rhoda-mine isothiocyanate (TRITC)-conjugated, Alexa Fluor1594- and Alexa Fluor1488-conjugated
secondary antibodies diluted in PBS (Table 1) was added for 1 h at room temperature. Finally,
the slides were washed in PBS and cover-slipped with buffered glycerol, pH 8.6.
Specificity of antibodies
Specificity of Gαtran, Gαgustand CCK/GAS has been previously demonstrated by Western Blot
and/or pre-adsorption test [27]. GHR, 5-HT and PYY antibody specificity was assessed by
pre-adsorption with an excess of the homologous peptide (GHR, sc-10368 P, Santa Cruz, CA, USA;
5-HT, H9523, Sigma-Chemicals, St. Louis, MO, USA; and PYY, 059–06, Phoenix Pharm. Inc.,
Burlingame, CA, USA, respectively) (S1 Fig).
Cell counting and statistical analysis
Cell counting was performed with a 40X objective lens using a Zeiss Axioplan microscope (Carl Zeiss, Oberkochen, Germany) with appropriate filter cubes. Images were obtained with a Polaroid DMC digital photocamera (Polaroid, Cambridge, Mass., USA), and minimal adjust-ments to brightness and contrast were made with Corel Photo Paint and Corel Draw (Corel, Dublin, Ireland). Each specimen was evaluated and counted by two investigators in a blind
fashion. For each animal, Gαtran- and Gαgust-IR cells were counted in 36 random microscope
fields (each field 0.28 mm2), for a total area of 10 mm2, in the cardiac and pyloric mucosa, in
50 randomly selected villi and glands in the small intestine, and in 50 glands in the large
intes-tine. Only villi and glands perpendicular to themuscularis mucosaewere evaluated. The values
obtained from counting Gαtran- and Gαgust-IR cells were grouped for each experimental group
(Ctr, Hp3 and Hp30) and the means were calculated. Moreover, the mean numbers of cells
showing a colocalization of Gαtranor Gαgust-IRs with different EEC markers were calculated.
Results were expressed as mean ± standard deviation (SD). Data were analysed by one-way
ANOVA (Graph Prism 4, GraphPad Software, Inc., La Jolla, CA, USA). AP<0.05 was
consid-ered statistically significant.
Table 1. List and dilutions of primary and secondary antibodies.
Primary antibodies Code Species Dilution Supplier
α-Transducin sc-390 rabbit 1:200 Santa Cruz
α-Gustducin sc-395 rabbit 1:200 Santa Cruz
Cholecystokinin/Gastrin CCK/GAS # 9303 mouse 1:1000 CURE/DDRC
Ghrelin sc-10368 goat 1:400 Santa Cruz
5-hydroxitryptamine ab16007 mouse 1:200 Abcam
Peptide YY PAB17185 guinea pig 1:1000 Abnova
Secondary antibodies Code Species Dilution Supplier
Alexa 594 conjugated anti-mouse IgG A11005 goat 1:600 Mol. Probes
Alexa 488 conjugated anti-rabbit IgG A21206 donkey 1:1000 Mol. Probes
FITC conjugated anti-rabbit IgG 401314 goat 1:500 Calbiochem
TRITC conjugated anti-goat IgG 705-295-003 donkey 1:1000 Jackson
TRITC conjugated anti-guinea pig IgG AP108R goat 1:100 Chemicon/Millipore
CURE/DDRC (P30DK041301), UCLA, Los Angeles, CA, USA. Chemicon International, Temecula, CA, USA. Abcam, Cambridge, UK. Santa Cruz Biotecnology, Inc., CA, USA. Abnova, Jhouzih St. Neihu District. Taipei City, Taiwan. Calbiochem- Novabiochem Corporation, San Diego, CA, USA. Molecular Probes, Eugene, OR., USA. Jackson ImmunoResearch Laboratories, Inc., West Grove, PA, USA.
Results
Distribution and neurochemical characterization of G
αtran-IR and G
αgust-IR cells in the GI tract
Gαtran- and Gαgust-IR cells were distributed throughout the whole pig GI tract (Fig 1A, 1C, 1E
and 1G;Fig 2A and 2C), extending our previous description of Gαtran-IR cell distribution [27].
Similarly to the distribution of Gαtran-IR cells as reported in details in our previous publication
[27] and confirmed in this study, Gαgust-IR cells were observed both in the distal third and in
the epithelial profile of the gastric mucosa of pyloric region, along the villus-crypt axis of the
small intestine, and in the glandular epithelium of the large intestine. Most Gαtran-and Gαgust
-IR cells had the morphological appearance of“open-type”EECs with an elongated shape,
homogenous cytoplasm (Fig 2A and 2C) and two cytoplasmic prolongations, one reaching the
lumen and the other the basal lamina (Fig 1G). Other Gαtran-and Gαgust-IR cells had the
“closed-type”EEC appearance with a round shape without cytoplasmic prolongations (Fig 1A
and 1C). Double labelling immunofluorescence showed that the majority of Gαtran-IR and
Gαgust-IR cells in the cardiac and pyloric mucosa were immunopositive for 5-HT (Fig 1A and
1B). Co-expression of Gαtran/ 5-HT or Gαgust/ 5-HT was also observed in the villi and
glandu-lar epithelium of the duodenum (Fig 1E and 1F), where some Gαtran-IR cells were
immunoposi-tive for 5-HT, while most Gαgustpositive cells co-expressed 5-HT. In the cardiac and pyloric
mucosa, the majority of Gαtran-IR and Gαgust-IR cells co-expressed GHR (Fig 1C and 1D). In
the jejunum, most of the Gαtran- or Gαgust-IR cells distributed along the crypt-villus axis
co-expressed CCK-IR (Fig 1G and 1H). In the large intestine, coexpression of Gαtranor Gαgustand
PYY-IR was seen in elongated cells located in the surface epithelium as well in cells of the
glan-dular epithelium (Fig 2A–2D). The percentages of colocalization of Gαtran- or Gαgust-IR cells
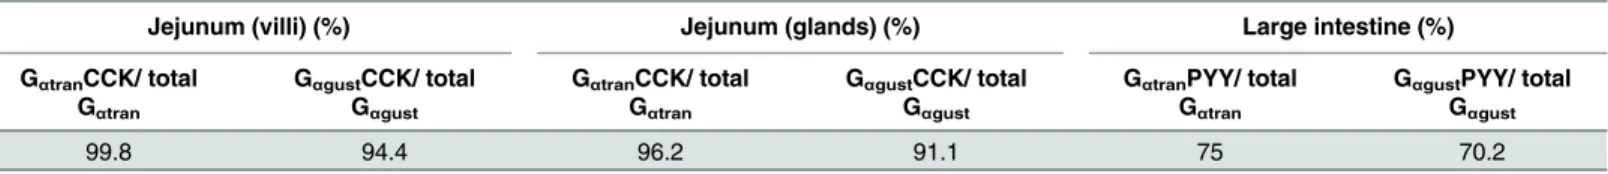
with EEC subtypes are shown in Tables2and3.
Distribution of the G
αtran- and G
αgust-IR cells in the three experimental
groups (Ctr, Hp3 and Hp30)
In the cardiac mucosa, the density of Gαtran-or Gαgust-IR cells was not affected by the
adminis-tration of the short or long-term Hp diet (Hp3 and Hp30, respectively; not shown). By contrast,
in the pyloric mucosa, we observed a significant increase in the density of Gαtran-IR cells in
both Hp3 and Hp30 group compared to Ctr (P<0.05) as well as Hp30 vs. Hp3 (P<0.05); also, a
similar increase was observed for Gαgust-IR cells in the Hp30 vs. Ctr and Hp3 (P<0.05) while
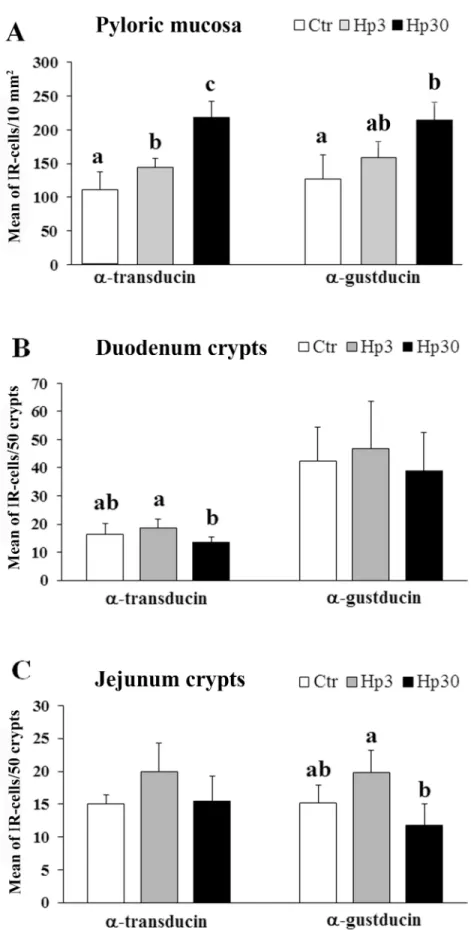
there were not a significant increase of Gαgust-IR cells in Hp3 compared to Ctr (Fig 3A).
In the small intestine, Gαtran-IR cells were significantly increased in the duodenum crypts in
the Hp3 group compared to Hp30, while there was a significant increase of Gαgust-IR cells in
jejunal crypts in Hp3 compared to Hp30 groups (P<0.05) (Fig 3B and 3C). Conversely, there
were not significant differences between the mean number of Gαtran- or Gαgust-IR cells in the
duodenal and jejunal villi in the Ctr vs. the different experimental groups (data not shown). In
the large intestine, we observed a progressive increase in the number of Gαtran- or Gαgust-IR
cells from the cecum to the rectum without reaching statistically significant differences among the experimental groups (data not shown).
Expression of EEC subpopulations of cells in the three experimental
groups (Ctr, Hp3 and Hp30)
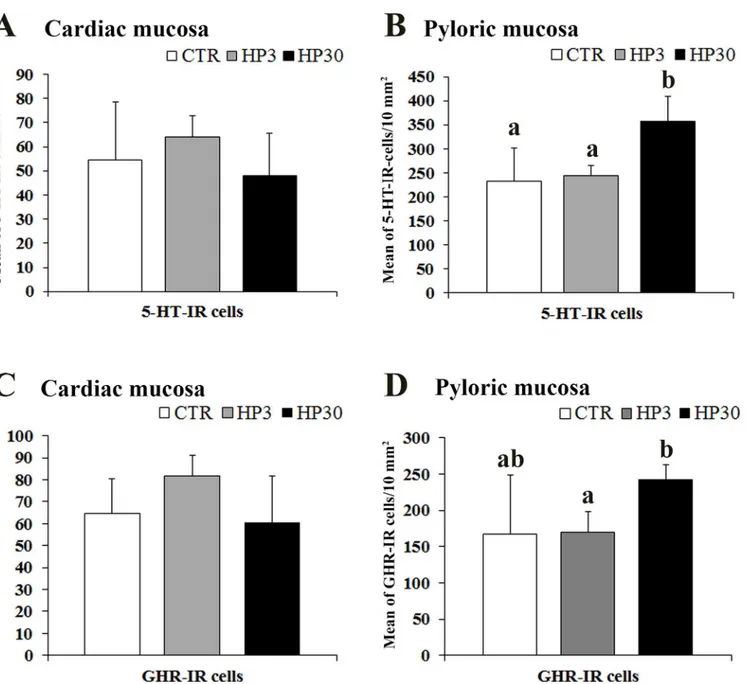
In the cardiac mucosa, the number of 5-HT positive cells did not change in the three experi-mental groups, whereas in the pyloric mucosa, 5-HT-IR cells were significantly more
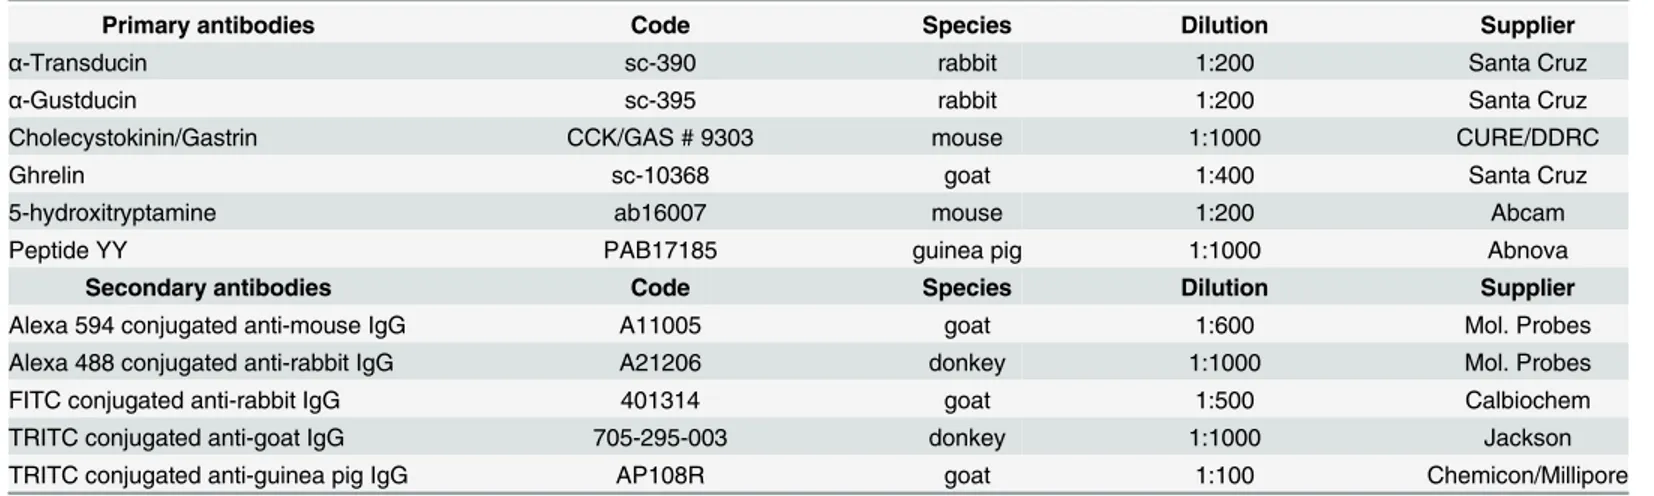
Fig 1. Colocalization of Gαtran-IR with 5-hydroxytryptamine (5-HT) in the pyloric mucosa following short-term
Hp diet (Hp3) (arrows in A and B). The arrows in the photomicrographs (C), (E) and (G) show Gαgust-IR cells
co-expressing ghrelin (D) in the pyloric mucosa of a pig fed a control diet (Ctr), 5-HT (F) in the duodenum of a pig fed long-term Hp diet (Hp30) and cholecystokinin (CCK) (H) in the jejunum of a Hp30 fed pig. The arrowheads in G and H indicate Gαgust-IR cells not containing CCK-IR. Generally, the Gαtran/ Gαgustlabelled
cells were found lying close to the basal lamina of the glands (typical closed-type morphology) (A and C, arrows). Frequently, the Gαtran/ Gαgust-IR cells are localized in the surface epithelium of the villi (with typical
open-type morphology) (E and G, arrows).
differences in the expression of GHR positive cells among the groups in the cardiac mucosa, while in the pyloric mucosa we observed a significant increase in the mean value of GHR-IR
cells in the Hp30 compared to the Hp3 (P<0.01) (Fig 4C and 4D). The density of 5-HT- and
CCK-IR cells in the duodenum and jejunum (villi and crypts) did not differ significantly in the three experimental groups. PYY-IR cells were more numerous in the descending colon and
rec-tumvs. cecum and ascending colon, but there were no significant differences among the
differ-ent segmdiffer-ents of the large intestine in the three experimdiffer-ental groups.
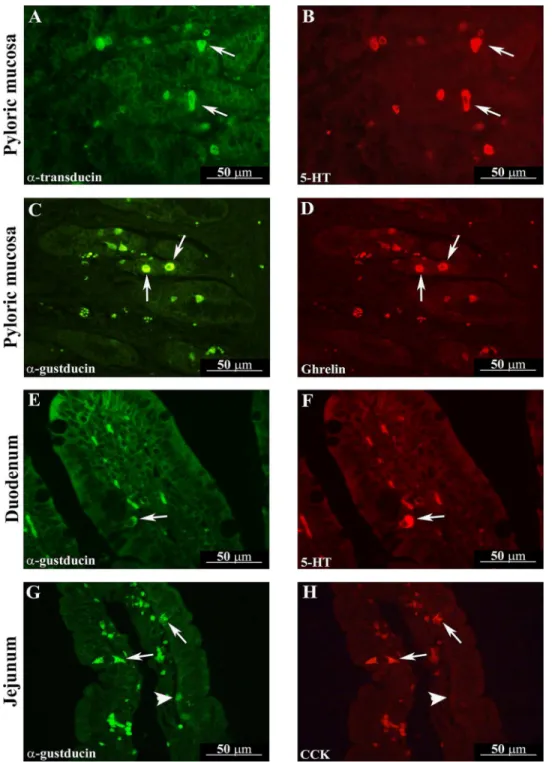
Fig 2. Gαtranand Gαgustcolocalized with peptide YY (PYY) in the ascending colon of an Hp3-fed animal (A and B, arrows) and in rectum of an Hp30-fed pig
(C and D, arrows), respectively. Gαtranand Gαgustpositive cells containing PYY-IR located in either the glandular or surface epithelium of the ascending colon
and rectum have an open-type morphology.
doi:10.1371/journal.pone.0148954.g002
Table 2. Percentages of co-localization of Gαtran- or Gαgust-IR cells with 5-HT and GHR in the gastric and duodenal mucosa.
Cell types Cardiac mucosa (%) Pyloric mucosa (%) Duodenal villi (%) Duodenal glands (%)
Gαtran5HT/ total Gαtran 95 94 21.2 28.2
Gαgust5HT/ total Gαgust 92.2 96.2 95.2 94.6
GαtranGHR/ total Gαtran 82.8 77 - - -
-GαgustGHR/ total Gαgust 61.3 74.6 - - -
Distribution of the different subgroups of G
αtran- and G
αgust-IR EECs in
Ctr, Hp3 and Hp30 groups
In the cardiac mucosa, the Hp diet did not produce any significant change in the mean number
of Gαtran/ 5-HT or Gαgust/ 5-HT-IR cells (Fig 5A), whereas in the pyloric mucosa, the 30-day
Hp diet led to a significant (P<0.01) increase of Gαtran/ 5-HT-IR or Gαgust/ 5-HT-IR cells
compared with the others two experimental groups (Ctr and Hp3) (Fig 5B). Moreover, there
were no changes in the mean number of Gαtran/ 5-HT and Gαgust/ 5-HT cells in Ctr, Hp3 and
Hp30 groups both in villi and crypts of the duodenum (Fig 5C and 5D).
The number of cells co-expressing Gαtran/ GHR or Gαgust/ GHR in the cardiac mucosa did
not differ in the experimental groups vs. the control (Fig 5E). By contrast, in the pyloric
mucosa, the administration of the Hp diet evoked an increase of the mean number of Gαtran/
GHR-IR or Gαgust/ GHR cells after 3 and 30 days vs. Ctr (Fig 5F).
There were no significant differences in the number of Gαtran/ CCK-IR cells in the villi in
the jejunum (Fig 5G), whereas there was a significant increased number of these cells in Hp3
(18.3 ± 2.8) compared to Ctr (14.5 ± 1.3,P<0.05) in the crypts (Fig 5H). The number of
Gαgust/ CCK-IR cells in jejunal crypts was greater in Hp3 (16.8 ± 3.3) than Hp30 (10.8 ± 4.1),
although this result did not reach statistical significance (P= 0.06) (Fig 5H).
Finally, in the large intestine, the quantitative analysis of Gαtran/ or Gαgust/ PYY-IR cells
showed no difference in the three experimental groups (Fig 5I and 5J).
Regarding the percentages of expression of Gαtran- or Gαgust-IR in ECC subtypes, we
observed statistical differences in the percentage of the colocalized Gαtran- or Gαgust-5-HT /
total 5HT-IR cells in the duodenal villi and glands (S3 Table).
Discussion
Physiological processes in the GI tract, such as secretomotor functions, digestion and absorp-tion are coordinated and integrated events depending upon dietary intake and hormone release
through constant monitoring of the luminal content by different sensory systems [1,4,6,36].
TASRs and taste-related molecules in the gut mucosa could serve as the initial molecular mech-anisms underlying appropriate functional responses to luminal nutrients and non-nutrients
contributing to gut chemosensitivity. This is supported by the localization of Gαtranand Gαgust
in distinct populations of EECs in different mammals including rodents [13,20,23,37–39], pigs
[27] and humans [24,40]. Here we showed that Hp diet affected the expression of the
taste-related molecules, Gαtran- or Gαgust, expressed by EECs, which act as chemoreceptors in the GI
tract [4]. The effects of a Hp diet on the density of Gαtran- or Gαgust-IR cells were more
promi-nent at 30 days than at 3 days and particularly evident in the pyloric mucosa, compared to other regions of the gut. These findings expand previous observations on the effect of feeding and fasting and dietary factors, including low cholesterol and high fat diets, on the GI
chemo-sensory system [27,28]. Several studies demonstrated that protein breakdown results in amino
acids and protein-hydrolysates that activate sensory receptors in chemosensing EEC cells of the gastric mucosa, which modulate digestive functions including gastric emptying, acid and
Table 3. Percentages of co-localization of Gαtran- or Gαgust-IR cells with CCK- and PYY-IR in the jejunum and large intestine mucosa.
Jejunum (villi) (%) Jejunum (glands) (%) Large intestine (%)
GαtranCCK/ total
Gαtran
GαgustCCK/ total
Gαgust
GαtranCCK/ total
Gαtran
GαgustCCK/ total
Gαgust
GαtranPYY/ total
Gαtran
GαgustPYY/ total
Gαgust
99.8 94.4 96.2 91.1 75 70.2
Fig 3. Quantitative assessment of the mean number of Gαtranand Gαgust-IR cells in the pig pyloric mucosa
(A), duodenum (B) and jejunum (C) crypts. Different letters indicate a significant (P<0.05) statistical difference
among groups. Values are expressed as mean±SD.
entero-pancreatic secretion and food intake, and contribute to the maintenance of energy
homeostasis, via hormone (mainly peptides) secretion [5,36,41]. Recent evidence suggests that
L-amino acids may be sensed by a group of G-protein coupled receptors which include TAS1R and TAS2R families, the calcium sensing receptor (CaSR) and the G-protein coupled receptor
family C group 6 member A (GPRC6A) [42]. The CaSR mainly senses aromatic amino acids
and calcium (Ca2+) [43–45], while the GPRC6A is a receptor that predominantly senses basic
amino acids and Ca2+and acts in concert with the CaSR [44,46].
Several studies have demonstrated that the G-proteins, Gαtran- or Gαgust, are signalling
mole-cules transducing TAS1Rs and TAS2Rs functions [47–50], while CaSR and GPRC6A are
trans-duced by Gαq-family proteins [51–53] or other Gαi-family proteins [54,55]. The increased
Fig 4. Quantitative assessment of the mean number of 5-HT and GHR-IR cells in the pig cardiac (A and C) and pyloric mucosa (B and D). Different letters indicate a significant (P<0.05) statistical difference among groups. Values are expressed as mean±SD.
density of Gαtranand Gαgust-IR cells during Hp diet observed in this study might reflect the
upregulation of TAS1Rs that included the TAS1R1, TAS1R2 and TAS1R3 subtypes that func-tions as dimers. The heteromeric combination of TAS1R1-TAS1R3 has been shown to function as a broad spectrum L-amino acid sensor, responsible for mediating perception of the savory
“umami”, taste of monosodium glutamate [55,56], and responds to a wide variety of L-amino
acids in the millimolar range [56]. On the other hand, the high content of proteins in the diet
could enhance the expression of the sweet sensors, i.e. the TAS1R2 and TAS1R3, likely a com-pensatory effect of a decreased content of carbohydrates. This response appears to be in con-trast to the TAS1R2 down-regulation induced by glucose administration reported in the mouse
gut [57]. Since the degradation products of protein hydrolysis can be bitter, we cannot exclude
that the Hp diets exert a modulatory role on the large TAS2Rs family [58] and therefore an
increased amount of food-born bitter tastants (or, alternatively, increased amino acids per se)
could result in increased TAS2R / Gαtran/ Gαgustexpression in the pyloric mucosa.
Gαtran-IR cells density in pyloric mucosa was significantly increased after 3 days of the Hp diet
administration, whereas the increase in Gαgust-IR cells reached statistical significance only after 30
days of Hp diet. This suggests that the Hp diet evoked a differential regulation of the taste receptor
system mainly involving Gαtranin the short-term and both Gαtranand Gαgustin the long-term.
Our results indicated the occurrence of major changes in taste signaling molecules in the upper GI tract, mainly in the antrum, thus expanding previous data from our laboratory showing modu-lation of taste-related molecules and distinct TAS2Rs in the stomach following fasting and
re-feeding [27] and in the upper small intestine with low-cholesterol diet [28]. Taken together these
data indicate that different dietary manipulations affect taste signaling molecules and receptors
throughout GI tract segments. Based on the "intestinal sensor cell hypothesis" [59], implying that
nutrients can be sensed by EECs expressing TASRs, the stomach could be thought as the "first gate" monitoring food components and activating digestive processes or aversive responses in the
case of potentially harmful substances [60]. This initial response would be followed by the
func-tional response of the upper small intestine where digestion continues and absorption initiates.
Kinsey-Jones et al. (2015) [42] reported that a Hp diet was not effective in modulating
GPRC6A expression in different regions of the mouse GI tract and hypothesized the presence of multiple overlapping systems mediating the effects of dietary amino acids and proteins. Our finding of changes in the expression of G proteins transducing taste receptors in certain regions of the gut in response to Hp diets are consistent with the notion of multiple receptors
involve-ment for amino acid sensing in the gust as reported in the lingual epithelium [61,62].
The increased density of the overall GHR-IR cells population observed in the pyloric region in the Hp30 group is in line with the reported increase of GHR levels in plasma in rats and
ruminant following long-term high-protein diets (7 days to 2 weeks) [63,64]. Furthermore, our
observation of an increase in Gαtran-and Gαgust-IR cells containing GHR-IR in the pyloric
mucosa of Hp30 group compared to Hp3 and Ctr, is in agreement with recent findings show-ing that amino acids and di- / tripeptides are sensed by TAS1R1-TAS1R3, which stimulate a
chemosensory signalling pathway regulating ghrelin release [35]. However, we did not see any
quantitative change of GHR-IR cells after Hp3 diet, whereas Lejeune et al. (2006) [65]
demon-strated that a four-day administration of a Hp diet resulted in suppression of GHR plasma
lev-els. We did not see any change in the number of PYY-IR or PYY cell coexpressing Gαtranor
Gαgust-IR in the colon and rectum, though PYY release is increased by Hp diet stimulation in
Fig 5. Quantitative evaluation of the mean number of Gαtran- or Gαgust/ 5-HT-IR in the cardiac (A) and pyloric mucosa (B), in the villi (C) and crypts (D) of the
duodenum. E and F show the mean number of Gαtran- or Gαgust/ GHR-IR cells in the pig cardiac and pyloric mucosa, respectively), and in the villi (G) and
crypts (H) of the jejunum. Finally, I and J illustrate the mean number of Gαtran- or Gαgust/ PYY-IR in the large intestine, respectively. Different letters indicate a
significant (P<0.05) statistical difference among groups. Values are expressed as mean±SD.
mammals, including humans [66–68]. These apparently discrepant results are likely due to the different measurements of GHR and PYY in tissue and blood and the different animal models.
Whether an increased number of Gαtranand Gαgust/ GHR-IR or Gαtranand Gαgust/ PYY-IR
cells is associated with increased circulating levels of these peptides was beyond the purpose of the present study and remains to be established.
Our finding that Gαtranand Gαgustcells in the small bowel co-expressed 5-HT extend
previ-ous data in the mprevi-ouse [38]. Furthermore, the observation that Gαtranand Gαgust/ 5-HT cells
are increased in the Hp3 and Hp30 groups compared to controls, suggests that the effect of Hp
diet on gut physiology (e.g. secreto-motor and nociceptive function) [69] involves the
activa-tion of the gut taste system via the release of 5-HT, a key signalling molecule in the gut.
The increase of the Gαtran/ CCK cells in the jejunal crypts of Hp3 group might reflect
activa-tion of these cells by protein hydrolysates, peptides and amino acids, which have been reported
to induce secretion of CCK by EECs expressing TAS1R1-TAS1R3 [70]. On the other hand, the
decreased number of Gαtran/ CCK cells after 30 days of high-proteins diet suggests that
adap-tive mechanisms come into play. CCK plays many roles in the digesadap-tive processes and has a
well known inhibitory effect on food intake [71], effects that could be mediated by the
activa-tion of the taste receptor system in the gut.
In conclusion, this study shows that short- and, in particular, long-term Hp diet evoked selective changes in the expression of TASR related signalling molecules in subsets of EECs in different regions of the GI tract. Our findings further strengthen the hypothesis of a functional role of taste-related molecules in gut chemosensitivity and suggest a functional role of the gut
taste system in nutrient-dependent—including proteins—gut functions.
Supporting Information
S1 Fig. Representative images of the pre-adsorption test of ghrelin (A), serotonin (5-HT, B) and peptide YY (PYY, C) primary antibodies.
(TIF)
S1 Table. A Composition of experimental diets and energy density.vitamins, minerals and amino acids integration
(DOCX)
S2 Table. Body weight and feed consumption of experimental animals.Values are expressed as mean ± standard deviation.
(DOCX)
S3 Table. Percentages of the colocalized Gαtran- Gαgust-5-HT/ total 5HT-IR cells in the
duo-denal villi and glands.
(DOCX)
Acknowledgments
The present work was supported by NIH grants DK09 and 41301 (C.S.), and grants from the Italian Ministry of Education, University and Research (MIUR) (PRIN2009) (R. De G.), from
‘Fondazione Del Monte di Bologna e Ravenna’, Italy and funds from the University of Bologna
(R. De G. and P.C.).
Author Contributions
Contributed reagents/materials/analysis tools: MLB RDG PC CS MM. Wrote the paper: CV RDG MM CS PC.
References
1. Furness JB, Kunze WA, Clerc N. Nutrient tasting and signaling mechanisms in the gut. II. The intestine as a sensory organ: neural, endocrine, and immune responses. Am J Physiol. 1999; 277: G922–928. PMID:10564096
2. Dockray GJ. Luminal sensing in the gut: an overview. J Physiol Pharmacol. 2003; 54: 9–17.
3. Cummings DE, Overduin J. Gastrointestinal regulation of food intake. J Clin Invest. 2007; 117: 13–23. PMID:17200702
4. Sternini C, Anselmi L, Rozengurt E. Enteroendocrine cells: a site of“taste”in gastrointestinal chemo-sensing. Curr Opin Endocrinol Diabetes Obes. 2008; 15: 73–78. doi:10.1097/MED.
0b013e3282f43a73PMID:18185066
5. Nakamura E, Hasumura M, Uneyama H, Torii K. Luminal amino acid-sensing cells in gastric mucosa. Digestion. 2011; 83: S13–18.
6. Furness JB, Rivera LR, Cho HJ, Bravo DM, Callaghan B. The gut as a sensory organ. Nat Rev Gastro-enterol Hepatol. 2013; 10: 729–740. doi:10.1038/nrgastro.2013.180PMID:24061204
7. Jang HJ, Kokrashvili Z, Theodorakis MJ, Carlson OD, Kim BJ, Zhou J, et al. Gut-expressed gustducin and taste receptors regulate secretion of glucagon-like peptide-1. Proc Natl Acad Sci U S A. 2007; 104: 15069–15074. PMID:17724330
8. Margolskee RF, Dyer J, Kokrashvili Z, Salmon KS, Ilegems E, Daly K, et al. T1R3 and gustducin in gut sense sugars to regulate expression of Na+-glucose cotransporter 1. Proc Natl Acad Sci U S A 2007; 104: 15075–15080. PMID:17724332
9. Glendinning JI, Yiin YM, Ackroff K, Sclafani A. Intragastric infusion of denatonium conditions flavor aversions and delays gastric emptying in rodents. Physiol Behav. 2008; 93: 757–765. doi:10.1016/j. physbeh.2007.11.029PMID:18174110
10. Hao S, Sternini C, Raybould HE. Role of CCK1 and Y2 receptors in activation of hindbrain neurons induced by intragastric administration of bitter taste receptor ligands. Am J Physiol Regul Integr Comp Physiol. 2008; 294: R33–38. PMID:18003792
11. Jeon TI, Zhu B, Larson JL, Osborne TF. SREBP-2 regulates gut peptide secretion through intestinal bit-ter taste receptor signaling in mice. J Clin Invest. 2008; 118: 3693–3700. doi:10.1172/JCI36461PMID: 18846256
12. Hao S, Dulake M, Espero E, Sternini C, Raybould HE, Rinaman L. Central Fos expression and condi-tioned flavor avoidance in rats following intragastric administration of bitter taste receptor ligands. Am J Physiol Regul Integr Comp Physiol. 2009; 296: R528–536. doi:10.1152/ajpregu.90423.2008PMID: 19073908
13. Janssen S, Laermans J, Verhulst PJ, Thijs T, Tack J, Depoortere I. Bitter taste receptors andα -gustdu-cin regulate the secretion of ghrelin with functional effects on food intake and gastric emptying. Proc Natl Acad Sci USA. 2011; 108: 2094–2099. doi:10.1073/pnas.1011508108PMID:21245306 14. Chen MC, Wu V, Reeve JR, Rozengurt E. Bitter stimuli induce Ca2+signaling and CCK release in
enteroendocrine STC-1 cells: role of L-type voltage-sensitive Ca2+channels. Am J Physiol Cell
Phy-siol. 2006; 291: C726–739. PMID:16707556
15. Nelson G, Hoon MA, Chandrashekar J, Zhang Y, Ryba NJ, Zuker CS. Mammalian sweet taste recep-tors. Cell 2001; 106: 381–390. PMID:11509186
16. Li X, Staszewski L, Xu H, Durick K, Zoller M, Adler E. Human receptors for sweet and umami taste. Proc Natl Acad Sci USA. 2002; 99: 4692–4696. PMID:11917125
17. Nelson G, Chandrashekar J, Hoon MA, Feng L, Zhao G, Ryba NJ et al. An amino-acid taste receptor. Nature 2002; 416: 199–202. PMID:11894099
18. Chandrashekar J, Hoon MA, Ryba NJ, Zuker CS. The receptors and cells for mammalian taste. Nature 2006; 444: 288–294. PMID:17108952
19. Meyerhof W, Batram C, Kuhn C, Brockhoff A, Chudoba E, Bufe B, et al. The molecular receptive ranges of human TAS2R bitter taste receptors. Chem senses. 2010; 35: 157–170. doi:10.1093/chemse/ bjp092PMID:20022913
20. Höfer D, Püschel B, Drenckhahn D. Taste receptor-like cells in the rat gut identified by expression of alpha-gustducin. Proc Natl Acad Sci USA. 1996; 93: 6631–6634. PMID:8692869
22. Höfer D, Asan E, Drenckhahn D. Chemosensory Perception in the Gut. News Physiol Sci. 1999; 14: 18–23. PMID:11390812
23. Wu SV, Rozengurt N, Yang M, Young SH, Sinnett-Smith J, Rozengurt E. Expression of bitter taste receptors of the T2R family in the gastrointestinal tract and enteroendocrine STC-1 cells. Proc Natl Acad Sci USA. 2002; 99: 2392–2397. PMID:11854532
24. Rozengurt N, Wu SV, Chen MC, Huang C, Sternini C, Rozengurt E. Colocalization of the alpha-subunit of gustducin with PYY and GLP-1 in L cells of human colon. Am J Physiol Gastrointest Liver Physiol. 2006; 291: G792–802. PMID:16728727
25. Moran AW, Al-Rammahi MA, Arora DK, Batchelor DJ, Coulter EA, Daly K et al. Expression of Na+
/glu-cose co-transporter 1 (SGLT1) is enhanced by supplementation of the diet of weaning piglets with artifi-cial sweeteners. Br J Nutr. 2010; 104: 637–646. doi:10.1017/S0007114510000917PMID:20338074 26. Latorre R, Mazzoni M, De Giorgio R, Vallorani C, Bonaldo A, Gatta PP, et al. Enteroendocrine profile of
α-transducin immunoreactive cells in the gastrointestinal tract of the European sea bass (Dicentrarchus labrax). Fish Physiol Biochem. 2013; 39: 1555–1565. doi:10.1007/s10695-013-9808-4PMID: 23748963
27. Mazzoni M, De Giorgio R, Latorre R, Vallorani C, Bosi P, Trevisi P, et al. Expression and regulation of α-transducin in the pig gastrointestinal tract. J Cell Mol Med. 2013; 17: 466–474. doi:10.1111/jcmm. 12026PMID:23414137
28. Vegezzi G, Anselmi L, Huynh J, Barocelli E, Rozengurt E, Raybould H, et al. Diet-reduced regulation of bitter taste receptor subtypes in the mouse gastrointestinal tract. PLoS One. 2014; 9: e107732. doi:10. 1371/journal.pone.0107732PMID:25238152
29. Mazzoni M, Bonaldo A, Gatta PP, Vallorani C, Latorre R, Canova M, et al.α-transducin andα-gustducin immunoreactive cells in the stomach of common sole (Solea solea) fed with mussel meal. Fish Physiol Biochem. 2015; 41: 603–12. doi:10.1007/s10695-015-0031-3PMID:25673424
30. Wong GT, Gannon KS, Margolskee RF. Transduction of bitter and sweet taste by gustducin. Nature 1996; 381: 796–800. PMID:8657284
31. He W, Danilova V, Zou S, Hellekant G, Max M, Margolskee RF, et al. Partial rescue of taste responses of alpha-gustducin null mice by transgenic expression of alpha-transducin. Chem Senses. 2002; 27: 719–727. PMID:12379596
32. Sainz E, Cavenagh MM, LopezJimenez ND, Gutierrez JC, Battey JF, Northup JK, et al. The G-protein coupling properties of the human sweet and amino acid taste receptors. Dev Neurobiol. 2007; 67: 948–
959. PMID:17506496
33. Potier M, Darcel N, Tome D. Protein, amino acids and the control offood intake. Curr Opin Clin Nutr Metab Care. 2009; 12: 54–58. doi:10.1097/MCO.0b013e32831b9e01PMID:19057188
34. Bensaid A, Tome D, Gietzen D, Evena P, Morensa C, Gausseresc N, et al. Protein is more potent than carbohydrate for reducing appetite in rats. Physiol Behav. 2002; 75: 577–582. PMID:12062322 35. Vancleef L, Van Der Broeck T, Thijs T, Steensels S, Briand L, Tack J et al. Chemosensory signalling
pathways involved in sensing of amino acids by the ghrelin cell. Sci Rep. 2015; 5:15725. doi:10.1038/ srep15725PMID:26510380
36. Haid D, Widmayer P, Breer H. Nutrient sensing receptors in gastric endocrine cells. J Mol Histol. 2011; 42: 355–364. doi:10.1007/s10735-011-9339-1PMID:21750971
37. Wu SV, Chen MC, Rozengurt E. Genomic organization, expression, and function of bitter taste recep-tors (T2R) in mouse and rat. Physiol Genomics. 2005; 22: 139–149. PMID:15886333
38. Sutherland K, Young RL, Cooper NJ, Horowitz M, Blackshaw LA. Phenotypic characterization of taste cells of the mouse small intestine. Am J Physiol Gastrointest Liver Physiol. 2007; 292: G1420–G1428. PMID:17290008
39. Fujita Y, Wideman RD, Speck M, Asadi A, King DS, Webber TD, et al. Incretin release from gut is acutely enhanced by sugar but not by sweeteners in vivo. Am J Physiol Endocrinol Metab. 2009; 296: E473–E479. doi:10.1152/ajpendo.90636.2008PMID:19106249
40. Steinert RE, Gerspach AC, Gutmann H, Asarian L, Drewe J, Beglinger C. The functional involvement of gut-expressed sweet taste receptors in glucose-stimulated secretion of glucagon-like peptide-1 (GLP-1) and peptide YY (PYY). Clin Nutr. 2011; 30: 524–532. doi:10.1016/j.clnu.2011.01.007PMID: 21324568
41. Haid DC, Jordan-Biegger C, Widmayer P, Breer H. Receptors responsive to protein breakdown prod-ucts in G-cells and D-cells of mouse, swine and Human. Front Physiol. 2012; 3: 65. doi:10.3389/fphys. 2012.00065PMID:22514536
43. Conigrave AD, Quinn SJ, Brown EM. L-amino acid sensing by the extracellular Ca2+-sensing receptor. Proc Natl Acad Sci. USA 2000; 97:4814–4819. PMID:10781086
44. Haid DC, Jordan-Biegger C, Widmayer P, Breer H. Receptors responsive to protein breakdown prod-ucts in g-cells and d-cells of mouse, swine and human. Front Physiol. 2012; 3: 65. doi:10.3389/fphys. 2012.00065PMID:22514536
45. Liou AP, Sei Y, Zhao X, Feng J, Lu X, Thomas C, et al. The extracellular calcium-sensing receptor is required for cholecystokinin secretion in response to L-phenylalanine in acutely isolated intestinal I cells. Am J Physiol Gastrointest Liver Physiol. 2011; 300: G538–546. doi:10.1152/ajpgi.00342.2010 PMID:21252045
46. Wellendorph P, Johansen LD, Brauner-Osborne H. Molecular pharmacology of promiscuous seven transmembrane receptors sensing organic nutrients. Mol Pharmacol. 2009; 76: 453–465. doi:10.1124/ mol.109.055244PMID:19487246
47. Ruiz-Avila L, McLaughlin SK, Wildman D, McKinnon PJ, Robichon A, Spickofsky N, et al. Coupling of bitter receptor to phosphodiesterase through transducin in taste receptor cells. Nature 1995; 376: 80–
85. PMID:7596440
48. He W, Danilova V, Zou S, Hellekant G, Max M, Margolskee RF, et al. Partial rescue of taste receptor responses of alpha-gudtducin null mice by transgenic expression of alpha-transducin. Chem Sens 2002; 27: 719–727.
49. Margolskee RF Molecular mechanisms of bitter and sweet taste transduction. J Biol Chem 2002; 277: 1–4. PMID:11696554
50. He W, Yasumatsu K, Varadarajan V, Yamada A, Lem J, Ninomiya Y, et al. Umami taste responses are mediated by alpha-transducin and alpha-gustducin. J Neurosci. 2004; 24: 7674–7680. PMID: 15342734
51. Buchan AM, Squires PE, Ring M, Meloche RM. Mechanism of action of the calcium-sensing receptor in human antral gastrin cells. Gastroenterology. 2001; 120: 1128–39. PMID:11266377
52. Höfer AM, Brown EM. Extracellular calcium sensing and signalling. Nat Rev Mol Cell Biol. 2003; 4: 530–8. PMID:12838336
53. Choi S, Lee M, Shiu AL, Yo SJ, Aponte GW. Identification of a protein hydrolysate responsive G pro-tein-coupled receptor in enterocytes. Am J Physiol Gastrointest Liver Physiol. 2007; 292: G98–G112. PMID:16935853
54. Ward DT. Calcium receptor-mediated intracellular signalling. Cell Calcium. 2004; 35: 217–28. PMID: 15200145
55. Li X, Staszewski L, Xu H, Durick K, Zoller M, Adler E. Human receptors for sweet and umami taste. Proc Natl Acad Sci USA. 2002; 99: 4692–4696. PMID:11917125
56. Nelson G, Chandrasheker J, Hoon MA, Feng L, Zhao G, Ryba NJ et al. An amino-acuid taste receptor. Nature. 2002; 416:199–202. PMID:11894099
57. Young RL, Sutherland K, Pezos N, Brierley SM, Horowitz M, Rayner CK, et al. Expression of taste mol-ecules in the upper gastrointestinal tract in humans with and without type 2 diabetes. Gut. 2009; 58: 337–346. doi:10.1136/gut.2008.148932PMID:19039089
58. Maehashi K, Huang L. Bitter peptides and bitter taste receptors. Cell Mol Life Sci. 2009; 66: 1661–
1671. doi:10.1007/s00018-009-8755-9PMID:19153652
59. Fujita T, Kobayashi S, Yui R. Paraneuron concept and its current implications. Adv Biochem Psycho-pharmacol. 1980; 25: 321–325. PMID:6108685
60. Widmayer P, Breer H, Hass N. Candidate chemosensory cells in the porcine stomach. Histochem Cell Biol. 2011; 136: 37–45. doi:10.1007/s00418-011-0824-0PMID:21667283
61. Daly K, Al-Rammahi M, Moran A, Marcello M, Ninomiya Y, Shirazi-Beechey SP. Sensing of amino acids by the gut-expressed taste receptor T1R1-T1R3 stimulates CCK secretion. Am J Physiol Gastro-intest Liver Physiol. 2013; 30: G271–282.
62. Yasumatsu K, Ogiwara Y, Takai S, Yoshida R, Iwatsuki K, Torii K et al. Umami taste in mice uses multi-ple receptors and transduction pathways. J Physiol. 2012; 590; 1155–1170. doi:10.1113/jphysiol. 2011.211920PMID:22183726
63. Vallejo-Cremades MT, Gómez-García L, Chacatas-Cortesao M, Moreno C, Sánchez M, De Miguel E, et al. Enriched protein diet-modified ghrelin expression and secretion in rats. Regul Pept. 2004; 121: 113–119. PMID:15256281
65. Lejeune MP, Westerterp KR, Adam TC, Luscombe-Marsh ND, Westerterp-Plantenga MS. Ghrelin and glucagon-like peptide 1 concentrations, 24-h satiety, and energy and substrate metabolism during a high-protein diet and measured in a respiration chamber. Am J Clin Nutr. 2006; 83: 89–94. PMID: 16400055
66. Batterham RL, Heffron H, Kapoor S, Chivers JE, Chandarana K, Herzog H, et al. Critical role for peptide YY in protein-mediated satiation and body-weight regulation. Cell Metab. 2006; 4: 223–233. PMID: 16950139
67. Lobley GE, Holtrop G, Horgan GW, Bremner DM, Fyfe C, Johnstone AM. Responses in gut hormones and hunger to diets with either high protein or a mixture of protein plus free amino acids supplied under weight-loss conditions. Br J Nutr 2015; 113: 1254–1270. doi:10.1017/S0007114515000069PMID: 25809236
68. Wang S, Yang L, Lu J, Mu Y. High-protein breakfast promotes weight loss by suppressing subsequent food intake and regulating appetite hormones in obese Chinese adolescents. Horm Res Paediatr. 2015; 83: 19–25. doi:10.1159/000362168PMID:24923232
69. Gershon MD, Tack J. The serotonin signaling system: from basic understanding to drug development for functional GI disorders. Gastroenterology 2007; 132: 397–414. PMID:17241888