Quim. Nova, Vol. 35, No. 6, 1233-1238, 2012
Nota Técnica
*e-mail: [email protected]
SIMVASTATIN ASSAY AND DISSOLUTION STUDIES BY FEASIBLE RP-HPLC IN TABLETS
Flávia Dias Marques-Marinho*, Amanda Leão dos Santos and Cristina Duarte Vianna-Soares
Departamento de Produtos Farmacêuticos, Faculdade de Farmácia, Universidade Federal de Minas Gerais, Av. Pres. Antônio Carlos, 6627, 31270-901 Belo Horizonte - MG, Brasil
Ilka Afonso Reis
Departamento de Estatística, Instituto de Ciências Exatas, Universidade Federal de Minas Gerais, Av. Pres. Antônio Carlos, 6627, 31270-901 Belo Horizonte - MG, Brasil
José Carlos da Costa Zanon
Clínica Ouro Cordis, Hospital Santa Casa, R. José Moringa, 620, 35400-000 Ouro Preto - MG, Brasil
Angélica Alves Lima
Departamento de Análises Clínicas, Escola de Farmácia, Universidade Federal de Ouro Preto, R. Costa Sena, 171, 35400-000 Ouro Preto - MG, Brasil
Recebido em 19/9/11; aceito em 10/12/11; publicado na web em 23/3/12
Commonly used HPLC acetonitrile solvent has been through a worldwide shortage with a cost increase in 2008 and 2009. In order to get around this situation, a method by RP-HPLC employing methanol and aqueous acid mobile phase was developed and validated to evaluate simvastatin. The quality control assay and dissolution studies of this lipid-lowering drug were performed in diluents methanol and 0.01 M phosphate buffer with 0.5% SDS, pH 7, respectively. Dissolution test aliquots did not go through sample treatment, as described in USP SIM tablets monograph by ultraviolet spectrophotometry. The proposed method is fast, simple, feasible and robust.
Keywords:Simvastatin tablets; dissolution studies; RP-HPLC.
INTRODUCTION
Simvastatin (SIM, Figure 1a), 2,2-dimethyl-,1,2,3,7,8,8a- hexahydro-3,7-dimethyl-8-[2-(tetrahydro-4-hydroxy-6-oxo-2H-pyran-2-yl)ethyl]-1-naphthalenyl ester [1S-[1a,3a,7b,8b (2S*,4S*),8ab]] butanoic acid is one of the most used statins as lipid-lowering agents, for the treatment of hypercholesterolemia.1,2
It reduces the morbidity and mortality associated with chronic heart disease.3 SIM is commercially available as tablets. Similarly to
lovastatin (LOV, Figure 1b) SIM is administered in lactone form as a pro-drug, which is enzymatically hydrolyzed in vivo to active β-hydroxy acid form (Figure 1c), particularly in liver. The active form competitively inhibits 3-hydroxyl-3-methylglutarylcoenzyme A (HMG-CoA) reductase, which converts HMG-CoA to mevalonate, a rate-limiting step in cholesterol biosynthesis.4-6
SIM is semi-synthetically produced from LOV, which is a natural fermentation product of Aspergillus terreus. Hence, LOV can be found in SIM raw material as impurity.2,7-9 SIM quantitation in bulk
or finished products samples has been reported using ultraviolet spectrophotometry and liquid chromatography (LC-UV/DAD).10-19
LC ion-par coupled to UV detectorand visible spectrometric method have also been reported.20,21 Furthermore, LC-MS/MS was employed
to identify SIM impurities or degradation products in bulk drug or tablets dosage form.22,23 UV spectrometry, LC-UV and LC-MS have
been reported to quantify SIM associated with other drugs such as ezetimibe, gemfibrozile or in multi-drugs formulation.24-27 A micellar
electrokinetic chromatographic (MEKC) method has been employed to quantify SIM and LOV in tablets.28 Several other studies, not here
considered because of its focus on SIM quantitation in biological samples describe LC coupled with UV or fluorescence detectors. LC is the most commonly reported method due to its feasibility to
couple with several detection techniques. Acetonitrile (ACN) widely used in combination with buffer solution in mobile phases, mainly in SIM official monographs of solid dosage forms.2,11,12,14,15,18,20,22,23,25-27,29
Methanol in a binary mobile phase has been reported for SIM de-termination in nanoparticles (specific pharmaceutical dosage form) in the concentration range 20-80 µg mL-1. ACN worldwide shortage
has reached a very high cost in the market between years 2008 and 2009.30 In order to get around this situation, an alternative lower cost
methanolic mobile phase, not only to assay SIM, but also, to determine SIM in dissolution studies was applied for tablets routine analysis.
EXPERIMENTAL
Chemicals and reagents
(RS, lot I0D382, 99.4% purity, Rockville, MD, USA), lovastatin phar-maceutical grade gently donated by Pharma Nostra (lot 07061205A, 99.9% purity, Rio de Janeiro, RJ, Brazil) and locally purchased Zocor®
20 mg tablets samples (Merck Sharp Dohme, Campinas, SP, Brazil) were used. Methanol HPLC grade (Tedia, Fairfield, OH, USA), phosphoric acid 85% (Merck, Darmstadt, Germany), sodium dodecyl sulphate (Pharmacopéia Ativos Magistrais, Barueri, SP, Brazil), so-dium hydroxide (J.T. Baker, Phillipsburg, NJ, USA) and monobasic sodium phosphate (Vetec, Rio de Janeiro, RJ, Brazil) were used as received. Distilled or ultrapurified water (Milli-Q-Plus, Millipore, Bedford, MA, USA) was used when necessary.
Instrumentation
The dissolution studies were performed in a DT80 (Erweka, Heusenstamm, Germany) dissolution system employing paddles (50 rpm) and 0.5% sodium dodecylsulphate (SDS) in 0.01 M monobasic sodium phosphate, final pH 7 ± 0.05 adjusted with 40% w/v sodium hydroxide (900 mL, 37 ± 0.5 °C).2,29 Withdrawn aliquots (with no
media replacement) were filtered through a 0.45 µm membrane and directly injected in the chromatograph.
Separations were performed in a HP1200 quaternary liquid chro-matography system (Agilent, Palo Alto, CA, USA) with automatic injector fitted at 10 µL, ultraviolet diode array detector (UV/DAD) set at λ 238 nm, octylsilane column (C8 and C8e, 250 x 4 mm, 5 µm) at 30 °C (Merck, Darmstadt, Germany) with data acquisition by internal software (Agilent ChemStation version Rev.B.02.01-SR1). Mobile phase consisted of methanol and 0.1% phosphoric acid (80:20 v/v) at flow rate 1.5 mL min-1, with backpressure of circa 125 bar. All
standard and sample solutions were filtered through a 0.45 µm filter membrane (MiniSart RC15 Sartorius, Goettingen, Germany) before injection. Peak area was used for SIM quantitation.
Standard solution preparation
Stock solutions of SIM RS were accurately prepared in methanol (200 µg mL-1) and in the dissolution medium (100 µg mL-1). Diluted
SIM standard solutions at 40 µg mL-1 were prepared in methanol for
assay and at 2, 10, 18, 26, 34 µg mL-1 in the dissolution medium. All
standard solutions were prepared in triplicate.
Sample solution preparation
Powdered tablets (20 units) equivalent to 5, 10, 20 mg SIM were accurately weighed in a 50 mL volumetric flask (triplicate), added of 25 mL methanol and sonicated for 10 min. Final volume was completed with the same diluent. The dispersions were filtered and aliquots of 10.0 mL were transferred to 50 mL flask volumetric to yield final concentrations 20, 40, 80 µg mL-1, respectively.
System suitability was verified by injections (n = 6) of SIM standard solution prepared in methanol (40 µg mL-1) and in
dis-solution medium (22.2 µg mL-1). The relative standard deviation
(%RSD) for SIM peak areas and retention times (tR) were accepted
if less than 1.0 or 2.0% for assay or dissolution test, respectively.31,32
Chromatographic parameters as retention factor (k), theoretical plates (N), tailing factor (Tf) and peak asymmetry (As) were also evaluated. Method validation
Calibration plots were built in two days in the mass range 0.04-0.80 µg by injection of 1, 5, 10, 15, 20 µL of SIM standard so-lution at 40 µg mL-1 in methanol and in the concentration range 2-34
µg mL-1 for SIM solutions in dissolution medium by injection of 10 µL
of standard solutions at 2, 10, 18, 26, 34 µg mL-1. All injections were
in triplicate. The calibration plots behavior, normality and homos-cedasticity (α 0.05) were verified by weighted least squares method using a linear regression model to determine the weights, Shapiro-Wilk and Levene tests, respectively.33 Residues greater or equal than
3.0 were removed by using studentized residuals model. Correlation coefficients, r, were calculated and results were considered significant if correspondent p-value were less than 0.05. All statistical analyses were performed using the R software (R Foundation for Statistical Computing, Vienna, Austria).
Limits of quantitation (LOQ) and detection (LOD) were deter-mined in triplicate (for methanolic solutions only) by successive dilutions of the lowest calibration curve point. The concentration for which the maximum precision remained below the acceptance limit (RSD 2.0%) was evaluated for LOQ. The minimum detectable area in the greatest dilution was considered for LOD.31,34
The method selectivity was evaluated by comparison of SIM chromatogram standard solution in methanol (40 µg mL-1) with that of
tablets excipients mixture (ascorbic acid, citric acid, hydroxypropyl-cellulose, butylated hydroxyanisole, hydroxypropylmethylhydroxypropyl-cellulose, iron oxides, lactose, magnesium stearate, microcrystalline cellulose, starch, talc, titanium dioxide) in methanol. In dissolution medium, SIM standard solutions (22.2 µg mL-1) were compared with that
obtained by addition of a placebo mass, equivalent to one average weight in three dissolution vessels, agitated at 150 rpm for 30 min.32
The intraday and inter-day precision for SIM tablets sample solu-tions (20, 40, 80 µg mL-1 in methanol, triplicate) was performed in three
days.34,35 A different analyst performed the procedure at the third day.
SIM standard solutions (22.2 µg mL-1 in dissolution medium, triplicate)
were used to evaluate intra-day precision. Tablets dissolution test (30 min) inter-day precision was evaluated by different analysts in two days each.32 The results were calculated by the common plot equations.
The standard addition method was employedfor accuracy stu-dies.Sample tablet solution in methanol was prepared as in sample preparation, except that, it was at 15 µg mL-1 (37.5% of working
concentration). SIM standard solution aliquots were added, so that, 50, 100 and 200% of working concentration (40 µg mL-1) were obtained.
The equation %R = [(CT - CA)/CS] x 100 was employed to determine
SIM recovery, in which, CA is concentration in nonspiked solution,
CT is total concentration in spiked solution and CS is concentration
of standard solution. Accuracy in the dissolution medium (900 mL per vessel) was obtained by addition of SIM RS in three different amounts (2, 20, 30 mg) to a tablet placebo mixture, equivalent to one average weight. Each concentration was tested in triplicate.32
Robustness was verified for SIM determination (40 µg mL-1 in
methanol, n = 6), by varying organic solvent ± 2.0%, flow rate ± 0.1 mL min-1 and temperature ± 10 °C. Equivalent SIM standard solutions
(n = 3) were run in the same conditions. For SIM dissolution medium solutions (n = 6), molarity ± 0.005 M, pH ± 0.5 and C8e (endcapped) column were tested. SIM concentrations were calculated by the cali-bration plot equation. All data were evaluated by analysis of variance (ANOVA) in a significance level α 0.05 using R statistical software. In a short term stability study SIM RS methanolic solution (40 µg mL-1) was kept at room controlled temperature (22-24 °C) and
was analyzed after 20 h. Dissolution stability study was evaluated by the addition of 20 mg SIM (one tablet) to dissolution medium (37 °C, 900 mL, 50 rpm, 30 min). This solution (22.2 µg mL-1) was
transferred to vials (n = 2), one kept at room temperature and the other at under refrigeration (2-8 °C). Vials were analyzed every hour during 7 h for comparison. A change less than 2.0% in the response was considered acceptable.34
for additional 15 min at 150 rpm. Aliquots (3 mL) were withdrawn at the time intervals 3, 5, 8, 10, 12, 15, 30, 45, 60 min, without medium replacement. Filtered aliquots were maintained at 2-8 °C previous to injection in the chromatograph. C8e (endcapped) column (250 x 4 mm, 5 µm) was used.
RESULTS AND DISCUSSION
Very few reports describe the use of C8 column to determine SIM in pharmaceutical samples.21-23,27 However, C8 has been chosen
because separation shows a slightly lower peak retention time (tR)
as fair as resolved as in a C18 column under the same conditions. Most reported studies, use isocratic or gradient elution of ternary or binary mobile phases containing acetonitrile (ACN) as organic solvent, in a variable proportion from 60 to 85% v/v, usually with buffer.12,17 Because there is a need to address method validation for
SIM determination and dissolution studies, for which linear con-centration ranges and diluents are usually different, a single feasible isocratic liquid chromatographic method was proposed. Due to ACN shortage and high cost in the market between years 2008 and 2009, an alternative less expensive solvent was desirable.30 Different options
to reduce solvent cost are reported in the literature.36,37 Ribeiro et al.
showed that low-cost ethanol can be a choice of mobile phase organic modifier for many RP-HPLC applications. However, its use is not worldwidely allowed, because of the control regulations in some countries, mainly in USA.36 A great effort has been done in order to
substitute ACN by methanol, what does not require modifications in equipment nor in the column.37
A binary phase, methanol and water, has been reported for SIM quantitation in nanoparticlesand in human plasma.19,38 No report
has described the use of methanol binary phase in reverse column applied to SIM tablets.
Hence, solvent-strength nomograph for reverse-phase HPLC was used to estimate a correspondent methanol percentage necessary to substitute ACN.31 Considering 72.5% as an average ACN percentage
used in the reported mobile phases, a correspondent methanol per-centage should be approximately 80%. In this work, different ratios of methanol and 0.1% phosphoric acid (75:25, 80:20, 85:15, 90:10 v/v) in isocratic elution were evaluated for SIM. The 80:20 and 85:15 mobile phase ratios yielded SIM k values near 2.0 (3.54 and 1.79, respectively) and were used to evaluate the selectivity of SIM and LOV (SIM synthesis route precursor, 40 µg mL-1 of each, in methanol
or 22.2 µg mL-1 in dissolution medium) at room temperature
imme-diately after preparation and five days later. Superior chromatographic separation and resolution between SIM, LOV and their degradation products were observed for mobile phase 80:20 ratio than 85:15 one. In the latter, nevertheless, peaks overlapping were observed for SIM and LOV degradation products in methanol (Figure 2) and for
LOV and SIM degradation products in dissolution medium (Figure 3). Interestingly, it should be noted that the products eluted with gre-ater tR than SIM and LOV in methanol. The presence of methanol may
lead to lactone methanolysis and esterification, what is agreement with previous report.39 On the other hand, the more polar products eluted
at lower tR in dissolution medium because of lactone hydrolyses to the
corresponding acid form in aqueous solutions (pH 7).40 The products
UV/DAD spectra (Figure 4) were identical to SIM and LOV original spectra in both diluents; revealing that the chromophore moiety is not affected by ring opening.41 For all these reasons, the 80:20 v/v ratio
mobile phase (1.5 mL min-1, 30 °C) was selected. Column
temperatu-re, set at 30 ºC helped reducing methanol:aqueous acid mobile phase viscosity, decreasing backpressure, therefore avoiding fluctuations. The backpressure was maintained around 125 bar.
System suitability showed %RSD values for peak area (0.47; 0.10) and tR (0.05; 0.02) less than 1.0% for methanol and dissolution
medium solutions, respectively. The results also demonstrate the sui-tability of the system in terms of column efficiency greater than 2000 (N 5999; 6551), adequate peak shape less than 2.0 (Tf1.13; 1.15) or
asymmetry less than 1.2 (As1.16; 1.19), appropriate SIM peak
reten-tion factor greater than 2.0 (k 2.67; 4.43) for solutions in methanol and dissolution medium, respectively.31,34 No fluctuations in the baseline
was observed during the runs. Hence, the proposed method showed system suitability for SIM determination in either diluent.
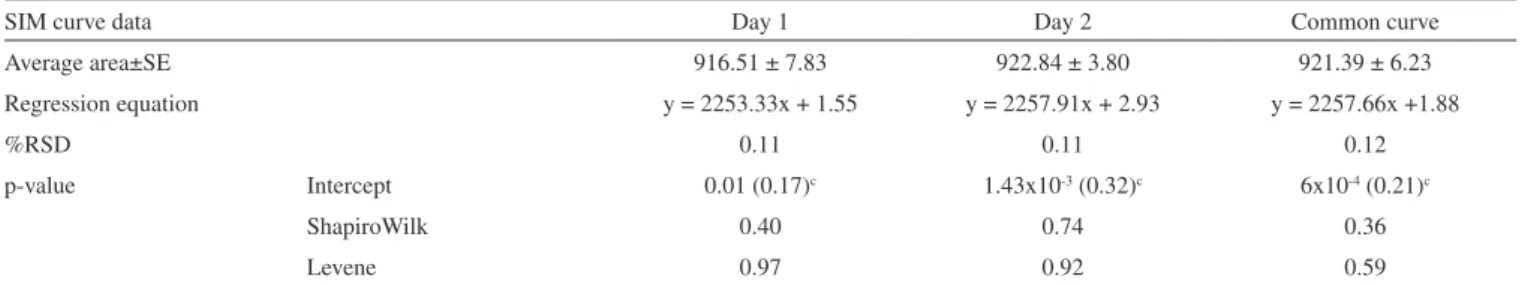
SIM calibration plots were built in both diluents. The simplest mo-del that adequately described the concentration-response relationship was the weighted least squares method using a linear regression model (variances versus mean responses in each concentration) to determine the weights.42 The plots for SIM methanolic (Table 1) or
dissolution medium (Table 2) solutions showed a linear behavior. No residues were removed for methanolic solutions plots, however, the common plot for dissolution medium solutions had two residues (6.6%) removed, less than 22% of the data.43
Figure 2. Chromatograms of SIM and LOV methanolic solution 5 days in room temperature after preparation, using methanol:0.1% phosphoric acid (a) 85:15 v/v and (b) 80:20 v/v as mobile phase, 1.5 mL min-1, C8e 250x4
mm, 5 µm, 30 ºC, 10 µL, l 238 nm
Figure 3. Chromatograms of SIM and LOV solution prepared in dissolution medium (0.5% SDS in monobasic sodium phosphate, pH 7, 0.01 M) after 5 days in room temperature; using methanol:0.1% phosphoric acid (a) 85:15 v/v and (b) 80:20 v/v as mobile phase, 1.5 mL min-1, C8e 250x4 mm, 5 µm,
30 ºC, 10 µL, l 238 nm
Plots in methanol, as well as, in dissolution medium showed no significant parallelism deviation by ANOVA (p-value > 0.05). Common regression plots were significant (p-value < 0.05), correla-tion coefficients (r) were above 0.999 and determinacorrela-tion coefficients (r2) were greater or equal 0.98.32,44 The regression RSD values were
less than 1.0%. Intercept was not statistically different from zero for dissolution medium solutions (p-value > 0.05) and percentage of the intercept relative to 100% analyte level was less than 2.0% for methanolic solutions. 32,44 For both diluents, data analyses followed
adequate normality and homoscedasticity (p-value > 0.05). RSD value found (1.2%) for LOQ was lower than 2.0% for SIM methanolic solutions.34
The method selectivity is demonstrated in Figures 5 and 6 for methanolic and dissolution medium solutions, respectively. Tablet (b) placebo constituents did not exhibit interfering peaks over (a) SIM RS retention time. Tablet (c) placebo added of SIM RS methanolic solutions also did not interfere in (a) SIM RS retention time.
The RSD values for intraday (1.86, 1.34%) and inter-day (2.02, 1.47%) precision were equal or lower than the acceptance limits for methanolic and dissolution medium solutions, as shown in Table 3 and Table 4, respectively.32,35
Accuracy found values ranged from 99.5 to 100.5% for SIM methanolic solutions, attesting the usual range of acceptance for pharmaceutical products (98.0 to 102.0%).35 Dissolution medium
solutions found values (99.1 to 100.4%) ranged between 95.0 and 105.0% for tablets placebo added of 2.0, 20.0 and 30.0 mg of SIM, in accordance with the USP34 criteria.32 These results attest the accuracy.
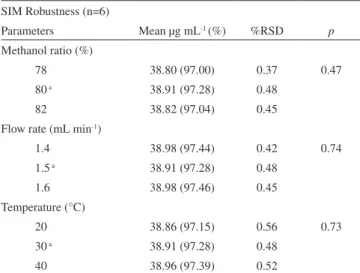
Robustness statistical analysis (Table 5) showed no significant difference (α 0.05) between standardized (nominal) analytical con-ditions and deliberate variations. The method using HPLC can be applied in a temperature range of 20 to 40 °C with no strict column oven control and small variations in flow and organic solvent pro-portion do not strongly affect the results.
For dissolution medium solutions (Table 6), changes in the me-dium molarity showed greater influence (p-value closer to 0.05) than variations in medium pH. Furthermore, the solutions can be analyzed regardless of endcapped (C8e) or not (C8) columns.
A short-term stability data for SIM RS methanolic solution eva-luated after 20 h at 22-24 °C showed a maximum variation of 0.55%. SIM dissolution medium solution kept at 22-24 °C showed variations equal to or greater than 2.0% after 3 h (2.0%) to 7 h (3.4%) standing in room controlled temperature. On the other hand, the maximum variation was 1.1% after 7 h under refrigeration (2-8 °C).34 This
Table 1. Results of adjusted regression model (r > 0.9999)a for SIM determination in methanolic solutions (0.04-0.80 µg, n=3) by HPLCb
SIM curve data Day 1 Day 2 Common curve
Average area±SE 916.51 ± 7.83 922.84 ± 3.80 921.39 ± 6.23
Regression equation y = 2253.33x + 1.55 y = 2257.91x + 2.93 y = 2257.66x +1.88
%RSD 0.11 0.11 0.12
p-value Intercept 0.01 (0.17)c 1.43x10⁻³ (0.32)c 6x10⁻⁴ (0.21)c
ShapiroWilk 0.40 0.74 0.36
Levene 0.97 0.92 0.59
a: p-value < 2.0 x 10⁻¹⁶; b: chromatographic conditions C8 (250 x 4 mm, 5 µm), 30 °C, methanol: 0.1% phosphoric acid 80:20 v/v, 1.5 mL min-1, λ 238 nm; c: intercept percentage relative to 100% analyte level that must be less than 2%.
Table 2. Results of adjusted regression model (r2 > 0.999)a for SIM determination (2-34 µg mL-1, n = 3) in dissolution mediumb by HPLC
SIM curve data Day 1 Day 2 Common curve
Average area±SE 387.77 ± 1.35 386.31 ± 1.41 387.21 ± 1.66
Regression equation y = 21.545x - 0.140 y = 21.453x - 0.178 y = 21.526x - 0.107
%RSD 0.29 0.17 0.29
p-value Intercept 0.97 0.60 0.68
ShapiroWilk 0.44 0.87 0.13
Levene 0.92 0.86 0.86
a: p-value < 2.0x10⁻¹⁶; b: 0.5% SDS in monobasic sodium phosphate (pH 7, 0.01 M); c: conditions as in Table 1.
Figure 5. Chromatograms of (a) simvastatin reference standard, (b) tablets placebo and (c) tablets placebo added of SIM RS in methanol. Chromato-graphic conditions: C8 (250x4 mm, 5 µm) 30 °C, methanol: 0.1% phosphoric acid (80:20 v/v), 1.5 mL min-1, l 238 nm, 10 µL
with pre-washed manganese dioxide) is required after SIM dissolution test, before drug quantitation.2,29
Zocor® rapidly dissolving tablets release profile (Figure 7) was
greater than 85% in 10 min. The RSD precision values between days for time points above 85% drug release (10, 12, 15, 30, 45 min) and below (8 min) were less than 5 and 10%, respectively.32 Time points 3
and 5 min were not considered because of high RSD values (> 20%) found for six units tested each day. These results attest that proposed method is adequate for SIM tablets in vitro release studies. Table 3. HPLC resultsa of precision and accuracy (% R) for SIM tablets in methanol
Conc.
SIM, µg mL-1 mean (%RSD)
Precision Accuracy
Day 1 Day 2 Day 3 Interday % R
(n=3) (n=9) (n=3)
20 19.56 (1.20)b 19.76 (1.65)b 20.25 (1.45)c 19.86 (2.02) 20.10 (0.99) 100.5 40 39.63 (1.86)b 38.77 (1.24)b 38.55 (1.47)c 38.98 (1.84) 39.79 (0.94) 99.5 80 78.01 (0.76)b 77.79 (0.08)b 77.00 (1.70)c 77.60 (1.10) 79.63 (1.30) 99.5 a: conditions as in Table 1; b: analyst I; c: analyst II.
Table 4. HPLC resultsa of precision and accuracy (% R) for SIM tablets in dissolution medium (900 mL, 37 °C, paddles, 50 rpm, 30 min)
SIM, µg mL-1 mean (%RSD)
Precision Accuracy
Day 1 Day 2 Interday % R
(n=6) (n=12) (n=3)
21.82 (1.50)b 21.68 (1.43)b 21.75 (1.44)b 2.20 (1.75) 99.1 21.51 (1.50)c 21.76 (1.32)c 21.63 (1.47)c 22.07 (1.12) 99.3 21.69 (1.45)d 33.45 (2.13) 100.4 a: HPLC conditions and dissolution medium as in Table 1 and Table 2, re-spectively; b: analyst I; c: analyst II; d: average, n=24.
Table 5. HPLC results of robustness for SIM tablets in methanol SIM Robustness (n=6)
Parameters Mean µg mL-1 (%) %RSD p Methanol ratio (%)
78 38.80 (97.00) 0.37 0.47
80 a 38.91 (97.28) 0.48
82 38.82 (97.04) 0.45
Flow rate (mL min-1)
1.4 38.98 (97.44) 0.42 0.74
1.5 a 38.91 (97.28) 0.48
1.6 38.98 (97.46) 0.45
Temperature (°C)
20 38.86 (97.15) 0.56 0.73
30 a 38.91 (97.28) 0.48
40 38.96 (97.39) 0.52
a: standardized (nominal) HPLC conditions C8 (250 x 4 mm, 5 µm), 30 °C, methanol:0.1% phosphoric acid (80:20 v/v), 1.5 mL min-1, UV/DAD λ 238 nm, 10 µL.
Table 6. HPLC results of robustness for SIM tablets in methanol and in dissolution medium
SIM Robustness (n=6)
Parameters Mean µg mL-1(%) %RSD p pH
6.5 a 21.78 (98.00) 1.46 0.86 7.0 a,b 21.82 (98.20) 0.93
7.5 a 21.85 (98.33) 1.35 Medium molarity
0.005 a 21.72 (97.75) 1.05 0.14 0.010 a,b 21.82 (98.20) 0.93
0.015 a 21.51 (96.78) 1.55 C8 column
endcapped b 21.56 (97.04) 1.31 0.10 non-endcapped a,b 21.82 (98.20) 0.93
a: standardized (nominal) HPLC conditions as in Table 5; b: dissolution test nominal conditions: 0.5% SDS in monobasic sodium phosphate (pH 7, 0.01 M), 900 mL, 37 °C, paddles, 50 rpm, 30 min.
fact can be explained by SIM temperature sensitiveness.40 These
results indicate that SIM can be assayed under room temperature in methanolic solutions, as well as, for dissolution test. However, it is recommended that SIM solutions to be kept under refrigeration for release profile studies, which are, usually, longer tests.
Because the release profile is an important stage in the develop-ment and quality monitoring of the pharmaceutical products, C8e (As 1.00, %RSD 0.12) was preferred rather than a C8, (As 1.20, %RSD 0.32), since more symmetric peaks were obtained.31 In addition, a
HPLC method was chosen for SIM tablets dissolution studies due to improved analytical sensitivity and reduced interference from exci-pients, without any sample treatment. Contrastingly, a method using UV spectrophotometric is described in international compendia for SIM tablets monograph, in which a sample preparation (centrifugation
In summary, the proposed RP-HPLC method advantages are the lower cost (50% less than ACN) and the absence of sample treatment after dissolution test compared to the UV method.2,29In addition, it
presented a low total run time (7.4 min) in isocratic elution, high selectivity towards SIM and LOV (SIM synthesis route precursor) degradation products in a wide concentration range (0.04-0.80 µg equivalent to 4-80 µg mL-1), with similar backpressure regarding
ACN use (125 versus 130 bar). Furthermore, a liquid chromatogra-phic method had not yet been applied to SIM tablets using official dissolution test conditions.2,29
CONCLUSION
An alternative validated method using RP-HPLC was successfully applied for SIM assay, as well as, for dissolution test and profile studies in tablets. The method demonstrated to be fast, simple, fea-sible and affordable when challenged for robustness either in assay conditions, especially for temperature, or in dissolution conditions, after buffer molarity and pH variations.
ACKNOWLEDGMENTS
The authors acknowledge Fapemig and CAPES for funding sources.
REFERENCES
1. O’Neil, M. J.; Heckelman, P. E.; Koch, C. B.; Roman, K. J.; Kenny, C. M.; D’Arecca, M. R.; The Merck index: an encyclopedia of chemicals, drugs and biological, 14th ed.; Merck & Company: Whitehouse Station: NJ, 2006.
2. The United States Pharmacopeia, 34th ed., United States Pharmacopeial Convention: Rockville, 2011.
3. Scandinavian Simvastatin Survival Study Group; Lancet 1994, 344,1383.
4. Moghadasian, M. H.; Life Sci. 1999, 65, 1329.
5. Endo, A.; Kuroda, M.; Tisujita, Y.; J. Antibiot. 1976, 29, 1346. 6. Endo, A.; J. Lipid Res. 1992, 33, 1569.
7. Hirama, M.; Iwashita, M.; Tetrahedron Lett. 1983, 24, 1811.
8. Alberts, A. W.; Chen, J.; Kuron, G.; Hunt, V.; Huff, J.; Hoffman, C.; Ro-throck, J.; Lopez, M.; Joshua, H.; Harris, E.; Patchett, A.; Monaghan, R.; Currie, S.; Stapley, E.; Albers-Schonberg, G.; Hensens, O.; Hirshfield, J.; Hoogsteen, K.; Liesch, J.; Springer, J.; Proc. Natl. Acad. Sci. U.S.A. 1980, 77, 3957.
9. Hoffman, W. F.; Alberts, A. W.; Anderson, P. S.; Chen, J. S.; Smith, R. L.; Willard, A. K.; J. Med. Chem. 1986,29, 849.
10. Arayne, M. S.; Sultana, N.; Hussain, F.; Ali, S. A. F.; J. Anal. Chem. 2007, 62, 536.
11. Wang, L.; Asgharnejad, M.; J. Pharm. Biomed. Anal. 2002, 21, 1243. 12. Gomes, F. P.; García, P. L.; Alves, J. M. P.; Singh, A. K.;
Kedor-Hack-mann, E. R. M.; Santoro, M I. R. M.; Lat. Am. J. Pharm. 2009, 28, 261. 13. Polonini, H. C.; Santos, F. C.; Vaz, P. U.; Brandão, M. A. F.; Quim. Nova
2011, 34, 516.
14. Pasha, Md. K.; Muzeeb, S.; Basha, S. J. S.; Shashikumar, D.; Mullangi, R.; Srinivas, N. R.; Biomed. Chromatogr. 2005, 20, 282.
15. Abu-Nameh, E. S. M.; Shawabkeh, R. A.; Ali, A.; J. Anal. Chem. 2006, 61, 63.
16. Godoy, R.; Godoy, C. G.; Diego, M.; Gómez, C.; J. Chil. Chem. Soc. 2004, 49, 289.
17. Grahek, R.; Milivojevic, D.; Bastarda, A.; Kracun, M.; J. Chromatogr., A 2001, 918, 319.
18. Markman, B. E. O.; Rosa, P. C. P.; Koschtschak, M. R. W.; Rev. Saúde Publ. 2010,44, 1055.
19. Ali, H.; Nazzal, S.; J. Pharm. Biomed. Anal. 2009, 49, 950. 20. Basavaiah, K.; Tharpa, K.; Chem. Ind. Chem. Eng. Q 2008, 14, 205. 21. Madan, J.; Thakkar, V.; Dwivedi, A. K.; Singh, S.; J. Scient. Ind. Res.
2007, 66, 371.
22. Vuletic, M.; Cindric, M.; Koruznjak, J. D.; J. Pharm. Biomed. Anal. 2005, 37, 715.
23. Oliveira, M. A.; Yoshida, M. I.; Gomes, E. C. L.; Mussel, W. N.; Vianna-Soares, C. D.; Pianetti, G. A.; Quim. Nova 2010, 33, 1653.
24. Palabiyik, I. M.; Onur, F.; Yardimci, C.; Özaltin, N.; Quim. Nova 2008, 31, 1121.
25. Hefnawy, M.; Al-Omar, M.; Julkhuf, S.; J. Pharm. Biomed. Anal. 2009, 50, 527.
26. Ashfaq, M.; Khan, I. U.; Asghar, M. N.; J. Chil. Chem. Soc. 2008, 53, 1617.
27. Kumar, V.; Shah, R. P.; Singh, S.; J. Pharm. Biomed. Anal. 2008, 47, 508.
28. Srinivasu, M. K.; Raju, A. N.; Reddy, G. Om.; J. Pharm. Biomed. Anal. 2002, 29, 715.
29. British Pharmacopoeia, The Stationery Office: London, vol. 3, 2011. 30. http://chromatographyonline.findanalytichem.com/lcgc/article/
ar-ticleDetail.jsp?id=605650&sk=&date =&pageID=4, accessed February 2012.
31. Snyder, L. R.; Kirkland, J. J.; Glajch, J. L.; Practical HPLC Method Development, 2nd ed., John Wiley: New York, 1997.
32. The United States Pharmacopeia, 34th ed., The dissolution procedure: development and validation <1092> United States Pharmacopeial Convention: Rockville, 2011.
33. Souza, S. V. C.; Junqueira, R. G.; Anal. Chim. Acta 2005, 552, 25. 34. Shabir, G. A.; J. Chromatogr., A 2003, 987, 57.
35. Ermer, J.; J. Pharm. Biomed. Anal. 2001, 24, 755.
36. Ribeiro, R. L. V.; Bottoli, C. B. G.; Collins, K. E.; Collins, C. H.; J. Braz. Chem. Soc. 2004, 15, 300.
37. Lanças, F. M.; Sci. Chromatogr. 2009, 1, 51.
38. Ochiai, H.; Uchiyama, N.; Imagaki, K.; Hata, S.; Kamei, T.; J. Chroma-togr., B: Anal. Technol. Biomed Life Sci. 1997, 694, 211.
39. Yang, D. J.; Hwang, L. S.; J. Chromatogr., A 2006, 1119, 277. 40. Piecha, M.; Sarakha, M.; Trebse, P.; Kocar, D.; Environ. Chem. Lett.
2010, 8, 185.
41. Alvarez-Lueje, A.; Valenzuela, C.; Squella, J. A.; Núnez-Vergara, L. J.; J. AOAC Int. 2005,88, 1631.
42. Rozet, E.; Ceccato, A.; Hubert, C.; Ziemons, E.; Oprean, R.; Rudaz, S.; Boulanger, B.; Hubert, P.; J. Chromatogr., A 2007, 1158, 111. 43. Horwitz, W.; Pure Appl. Chem. 1995,67, 331.