Nota Técnica
*e-mail: [email protected]
DEVELOPMENT AND VALIDATION OF A HIGH PERFORMANCE LIQUID CHROMATOGRAPHIC METHOD FOR DETERMINATION OF ETOPOSIDE IN BIODEGRADABLE POLYMERIC IMPLANTS
Ana Gabriela Reis Solano*
Faculdade de Farmácia, Universidade Federal de São João Del Rei, Rua Sebastião Gonçalves Coelho, 400, 35501-296 Divinópolis – MG / Departamento de Produtos Farmacêuticos, Faculdade de Farmácia, Universidade Federal de Minas Gerais, Av. Pres. Antônio Carlos, 6627, 31270-901 Belo Horizonte – MG, Brasil
Gisele Rodrigues da Silva
Faculdade de Farmácia, Universidade Federal de São João Del Rei, Rua Sebastião Gonçalves Coelho, 400, 35501-296 Divinópolis – MG, Brasil
Silvia Ligório Fialho
Divisão de Desenvolvimento Farmacotécnico, Fundação Ezequiel Dias, Rua Conde Pereira Carneiro, 80, 30510-010 Belo Horizonte – MG, Brasil
Armando da Silva Cunha Júnior e Gérson Antônio Pianetti
Departamento de Produtos Farmacêuticos, Faculdade de Farmácia, Universidade Federal de Minas Gerais, Av. Pres. Antônio Carlos, 6627, 31270-901 Belo Horizonte – MG, Brasil
Recebido em 21/9/11; aceito em 16/1/12; publicado na web em 15/5/12
A method using HPLC-UV was developed and validated for the determination of etoposide incorporated into polycaprolactone implants. The method was carried out in isocratic mode using a C18 column (250 x 4.6 mm; 5 µm), at 25 °C, with acetonitrile and acetic acid 4% (70:30) as mobile phase, a flow rate of 2 mL/min, and UV detection at 285 nm. The method was linear (r2 > 0.99) over the range of 5 to 65 µg/mL, precise (RSD < 5%), accurate (recovery of 98.7%), robust, selective regarding excipient of the sample, and had a quantitation limit equal to 1.76 µg/mL. The validated method can be successfully employed for routine quality control analyses. Keywords: validation; etoposide; poly(ε-caprolactone); intraocular implant.
INTRODUCTION
Etoposide (Figure 1) is a semisynthetic derivative of podophyllo-toxin, a compound extracted from the roots and rhizomes of the plants Podophyllum peltatum and P. emodi.1 It is a cytotoxic drug whose mechanism of action is believed to be the inhibition of topoisomerase II enzyme. Etoposide is widely used in chemotherapy of various solid tumors including lung cancer, testicular tumor, gastric tumor, ovarian cancer, and retinoblastoma.2 However, the systemic administration of anticancer drugs such as etoposide has limited effectiveness in the treatment of solid tumors. As only a small fraction of the total dose of the drug reaches the tumor site and the remainder of the dose is distributed throughout healthy organs and tissues, it causes undesi-rable effects such as alopecia, hepatotoxicity, leukopenia, myelosu-ppression, febrile episodes, gastrointestinal toxicity, nephrotoxicity, and cardiomyopathy.2,3
The treatment of solid tumors through locoregional therapy has been widely studied, and the usage of biodegradable polymeric im-plants containing anticancer drug offers an advantageous alternative. The implants are a sustained drug delivery system that can be inserted in the region where the tumor is located or within the tumor itself. This increases the tumor exposure to drug and also limits systemic toxicity. In addition, the local maintenance of therapeutic levels for a long period of time optimizes the chemotherapy regimen by reducing the number of doses to be administered.3
The implants can be prepared from both biodegradable and non--biodegradable polymers. Nevertheless, biodegradable polymers have been widely used owing to their non-toxic property and biodegra-dability.4 Poly(ε-caprolactone) (PCL), a biodegradable and biocom-patible polymer, has gained considerable attention owing to its high permeability to several drugs and the possibility of a long sustained and controlled drug release rate.5 In an attempt to target the delivery of etoposide for the locoregional treatment of retinoblastoma, a tumor stemming from retinal cells, an etoposide-loaded biodegradable PCL implant has been developed.
Several reports have described methods for quantifying etoposide in different samples. Tang et al.6 determined etoposide-loaded biode-gradable polymeric nanoparticles using the UV-spectrophotometric method at a detection wavelength of 284 nm. However, this method did not provide adequate selectivity for the etoposide, since the drug and its degradation products have the same chromophore.7 Chen and Uckun8 employed high performance liquid chromatography coupled with mass spectrometry (HPLC-MS) for measurement of etoposide in human serum and plasma. Although HPLC-MS provides the selective measurement of this drug over a wide analytical range, this technique does not represent a viable analytical method for quantifying the etoposide in routine quality control analysis.
The official pharmacopoeias present monographs of etoposide raw material, soft capsules and injections.9-11 These compendia des-cribed a gradient high performance liquid chromatography method with ultraviolet detection (HPLC-UV) for assaying etoposide in these products. However, this HPLC-UV method involves a long analysis time for estimating the drug, limiting its application in routine quality control.
Currently, not studies on the quantitative determination of etoposide in drug delivery system containing PCL are available. Thus, the present study is aimed at developing and validating a simple method using chro-matography for the determination of etoposide in polymeric implants. EXPERIMENTAL
Materials and reagents
Poly-ε-caprolactone (PCL) (molecular weight of 14000) was purchased from Sigma-Aldrich Chemicals (USA). Etoposide was offered by Quiral Química (Brazil) and the etoposide chemical re-ference substance was purchased from The United Pharmacopoeia (USA). Ultrapure water was produced by a Milli-Q® purification system (Millipore, USA). Acetonitrile HPLC grade was purchased from Merck® (Brazil). The other solvents and reagents used were of analytical grade.
Instrumentation and chromatographic conditions
The HPLC analyses were carried out on a Thermo Surveyor System (USA) which included a quaternary pump, autosampler, diode array detector (DAD), and ChromQuest 4.2 software. The Ace C18 column (250 x 4.6 mm i.d.; 5 µm particle size) from ACT was used and maintained at 25 °C. The mobile phase comprised acetic acid 4% (v/v) and acetonitrile (70:30), at a flow rate of 2 mL/min. The injection volume was 25 µL and detection was performed at 285 nm. Preparation of implant
PCL was melted at 60 ºC in a water bath and etoposide was tho-roughly dispersed in the polymer melt. The resulting PCL + etoposide (1:1) mass was allowed to cool at room temperature and molded into cylinders at 60 oC.
Preparation of solutions
Standard solution
Approximately 25 mg of etoposide reference standard were accurately weighed and transferred to a 50 mL volumetric flask and dissolved in a mixture of acetic acid 4% (v/v) and acetonitrile (1:1). Subsequently, aliquots of the solution were diluted in phosphate buffered saline (pH 7.4) to obtain the concentrations of 5.00, 20.0, 35.0, 50.0 and 65.0 µg/mL.
Sample solution
Five etoposide-loaded PCL implants were weighed and transfer-red to a 50 mL volumetric flask. An aliquot of 25 mL of acetonitrile was added to ensure complete solubilization, and the volume adjusted with acetic acid 4% (v/v). An aliquot of 15 mL of the solution thus obtained was transferred to a 50 mL volumetric flask and the volume adjusted with phosphate buffered saline (pH 7.4).
Method validation
The method was validated by determining the parameters of
selectivity, calibration curve, precision, accuracy, robustness and quantitation limit.12-16
System suitability
The system suitability solution was prepared daily using 10 mL of etoposide solution at 250 µg/mL in a mixture of acetic acid 4% (v/v) and acetonitrile (1:1) and 0.1 mL of an ethanolic solution of phenolphthalein (1% w/v). To this solution, sodium hydroxide (1 mol/L) was added until the solution turned faintly pink in color. The system suitability solution was kept at rest for 15 min and subse-quently 0.1 mL of acetic acid 4% (v/v) was added. System suitability was determined by injection of the system suitability solution prior to sample analysis. The acceptance criterion was a resolution greater than 1.5 between the two principal peaks of the chromatogram while disregarding any peaks attributed to phenolphthalein.17
Selectivity
In order to prove that the HPLC method was selective, the eto-poside concentration was determined in the implant and in standard solution prepared as described in Standard solution.Selectivity was evaluated by comparing the average concentration of etoposide (n = 6) of the two groups (implant and standard solution) using Student’s t test (α = 0.05). The F test (Snedecor) was applied to evaluate ho-moscedascity.13 Further, a placebo solution (PCL, 35 µg/mL) was prepared in a mixture of phosphate buffered saline (pH 7.4), acetic acid 4% (v/v) and acetonitrile (74:13:13), and assayed using the HPLC method in order to verify whether the excipient of the formulation influenced the analysis method.
Calibration curve
The calibration curve was obtained using five reference stan-dard concentrations (5.00, 20.0, 35.0, 50.0, and 65.0 µg/mL) in 3 independent replicates run in random order. These assays were performed on 2 different days. The calibration curves constructed were assessed using residue analysis (homoscedascity, normality, and independence of residues) and linear regression analysis was done by the ordinal least squares method.18 The analysis of cova-riance (ANCOVA) was used for comparing the calibration curves obtained on different days.19
Precision
The precision of the method was determined based on repeatabili-ty (intra-assay) and intermediate precision (inter-assay). Repeatabilirepeatabili-ty was assessed through the assay of solutions at concentrations of 5.00, 35.0, and 65.0 µg/mL on the same day. The solutions were prepared in triplicate for the incorporation of etoposide in placebo solution (PCL, 35.0 µg/mL). Intermediate precision was verified by evaluating the results on 2 different days.
Accuracy
In order to determine accuracy, standard solutions at concentra-tions of 5.00, 35.0 and 65.0 µg/mL were prepared in triplicate by the incorporation of etoposide reference standard in placebo solution (PCL, 35.0 µg/mL). The solutions were assayed by the HPLC method on 2 different days.
Quantitation limit
The limit of quantitation value (LOQ) is defined as the lowest concentration that can be quantitatively determined with suitable precision and accuracy. The LOQ was calculated directly from the calibration curve and can be expressed as:
where, σ is the standard deviation of the response and b is the slope of the calibration curve.12,16
Robustness
The method proposed by Youden e Steiner was carried out to evaluate robustness.20 Seven analytical parameters were selected and investigated at two levels as indicated by capital letters (nominal va-lues) and lowercase letters (conditions with small variation in nominal values), as shown in Table 1. Eight runs were performed following the experimental design of Youden and Steiner (Table 1) in order to determine the influence of each parameter on the final result.
The sample and standard solutions at working concentration (35.0 µg/mL) and the system suitability solution were injected three times for each combination. For each combination, the results of peak area, retention time, asymmetry, theoretical plates number, resolution and etoposide content in the implants were analyzed.
The results of each experiment were represented by letters ranging from s to z (Table 1). To estimate the effect of each variable on the final result, the difference between the mean of the four values correspon-ding to the capital letters (nominal conditions), and the mean of the four values corresponding to the lowercase letters (altered conditions), was calculated.20 Thus, to evaluate the influence, for example, of wavelength on the final result of the analyses, Equation 2 was used:
(2) The effect of the analytical parameter was considered to be sig-nificant if the value of the difference was greater , where, S is the standard deviation of the 8 results.21
Determination of etoposide in PCL implants
The standard and sample solutions were prepared at working concentration (35.0 µg/mL) as described in Standard and sample solution preparation. The sample solutions (n = 6) were analyzed by the validated HPLC while drug content in the PCL implant was expressed as the percentage of pre-indicated value (50% w/w). RESULTS AND DISCUSSION
The official compendia recommend a method using HPLC with gradient mobile phase for assaying etoposide in raw material, soft capsules and injections.9-11 However, the analytical conditions of the
recommended method are not suitable for quantifying etoposide in biodegradable polymeric implants, mainly due to the long analysis time (between 40 and 50 min) and range of etoposide concentration employed. Thus, an isocratic RP-HPLC method with UV detection was developed for the quantitative determination of etoposide incor-porated into PCL implants.
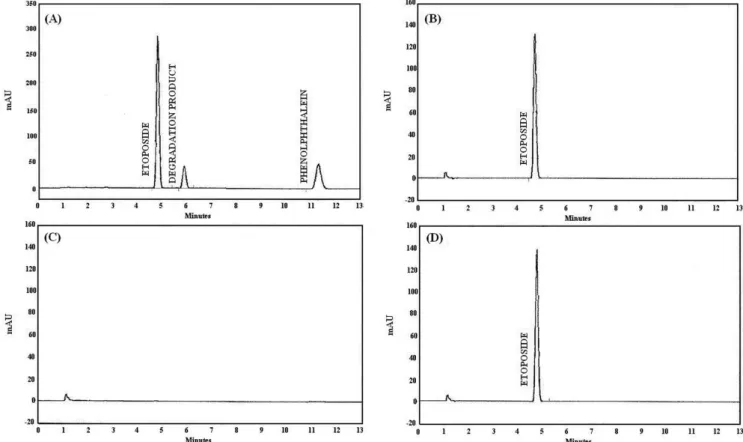
During method development, the acetonitrile proportion in the mobile phase was increased from 27% (v/v) to 30% (v/v) to allow suitable retention time and peak shape of etoposide. Also, good reso-lution (>1.5) between peaks of etoposide and its degradation product under alkaline condition was achieved (Figure 2A).
The wavelength of 285 nm was selected for detection because at this wavelength maximum absorption of etoposide and high selecti-vity were observed owing to the low likelihood of PCL interference in the sample. This fact was confirmed by chromatograms of eto-poside, PCL, and etoposide-loaded PCL implant (Figure 2B-D), in which interference or overlap of the polymer with etoposide response were not observed. In addition, there was no significant difference (p < 0.05) between the average concentrations of standard solution (35.03 ± 0.93 µg/mL) and implant solution (35.04 ± 0.40 µg/mL) as determined by the HPLC method. Considering the previous results, the method developed had adequate selectivity for the determination of etoposide in polymeric implants.
Under the experimental conditions, and within the range of 5.00 to 65.0 µg/mL, the regression between concentration and peak areas was considered significant. The linear model proved to be adequate as it could be shown that the residues followed a normal distribution pattern and were independent while homoscedasiticity was evident and lack of fit was not significant. Two calibration curves were constructed (Table 2) on different days bothof which presented a correlation coefficient (r) higher than 0.99,12 and the comparison indicated no significant difference between the intercepts and slopes. The coefficient of determination (r2) of both curves was higher than 0.99, implying that more than 99% of total variance of the peak areas was explained by the varying etoposide concentration. The limit of quantitation was calculated as 1.76 µg/mL.
Repeatability (intra-assay) and intermediate precision (inter--assays) were expressed as the relative standard deviation (R.S.D.) of a series of measures. On the intra-assay precision analysis, the mean concentration of etoposide (n = 3) was found to be 5.10 µg/mL (R.S.D. = 0.22%), 34.72 µg/mL (R.S.D. = 2.27%), and 64.82 µg/mL (R.S.D. = 1.06%). The mean contents obtained in the intermediate Table 1. Parameters, variation and factorial combination for robustness test studies
Analytical parameter Value (X/x) Factorial combination
1 2 3 4 5 6 7 8
Acetonitrile concentration in mobile phase (% v/v) A a A A A A a a a a 30 32
Acetic acid concentration in mobile phase (% v/v) B b B B b b B B b b 4 4.2
Temperature of sample compartment (oC) C c C c C c C c C c
25 30
Column temperature (oC) D d D D d d d d D D
25 30
Mobile phase flow rate (mL/min) E e E e E e e E e E
2 1.8
Acetonitrile concentration in standard and sample solutions (% v/v) F f F f f F F f f F 13 20
Wavelength (nm) G g G g g G g G G g
285 287
precision were 5.14 µg/mL (R.S.D. = 1.93%), 34.44 µg/mL (R.S.D. = 1.76%), and 64.40 µg/mL (R.S.D. = 1.47%). The R.S.D. values were well below 5% for all levels of concentrations tested, thus indicating appropriate intra and inter-assay precision.12
A accuracy was determined using a recovery test by the addition of etoposide reference standard to placebo solution. The results are given in Table 3.
According to the trueness parameter, there was no evidence indicating the presence of systematic errors in the results obtained
using the HPLC method. By plotting the concentrations determined experimentally versus the theoretical values, a line was obtained. Experimental values were found to be highly similar to the true values, and thus the lines did not deviate, proving the absence of systemic errors.13-15
The method developed had appropriate accuracy as indicated by the values calculated for the β tolerance interval (Figure 3) for each concentration level, which presented a maximum variation of 5%.14 A accuracy is represented by the combination of the random (precision) and systematic (trueness) errors considered in the β tolerance interval calculation. This represents the interval in which β% of the future individual results is expected.14,15
Table 2. Parameters of the calibration curve for etoposide within the range of 5.00 to 65.0 µg/mL
Regression parameter Curve 1 Curve 2 Slope ± standard error 28510 ± 167.8 27290 ± 899.4 Intercept ± standard error -3891 ± 5922 -2835 ± 35930 Coefficient of determination (r2) 0.999 0.996 Coefficient of correlation (r) 1.000 0.993
Number of points 5 5
Table 3. Results of the recovery test (n = 3)
Day Level (µg/mL) Mean recovery ± R.S.D. (%)
1 5.00 101.5 ± 0.2
35.0 98.7 ± 2.2
65.0 99.2 ± 1.1
2 5.00 100.3 ± 1.2
35.0 98.6 ± 2.1
65.0 98.5 ± 0.4
Figure 2. Chromatograms obtained under the experimental conditions. (A) System suitability solution, (B) etoposide standard solution at 35 µg/mL, (C) PCL
solution at 35 µg/mL, (D) etoposide-loaded PCL implant solution
Figure 3. Accuracy profile obtained for the HPLC method. The dashed lines
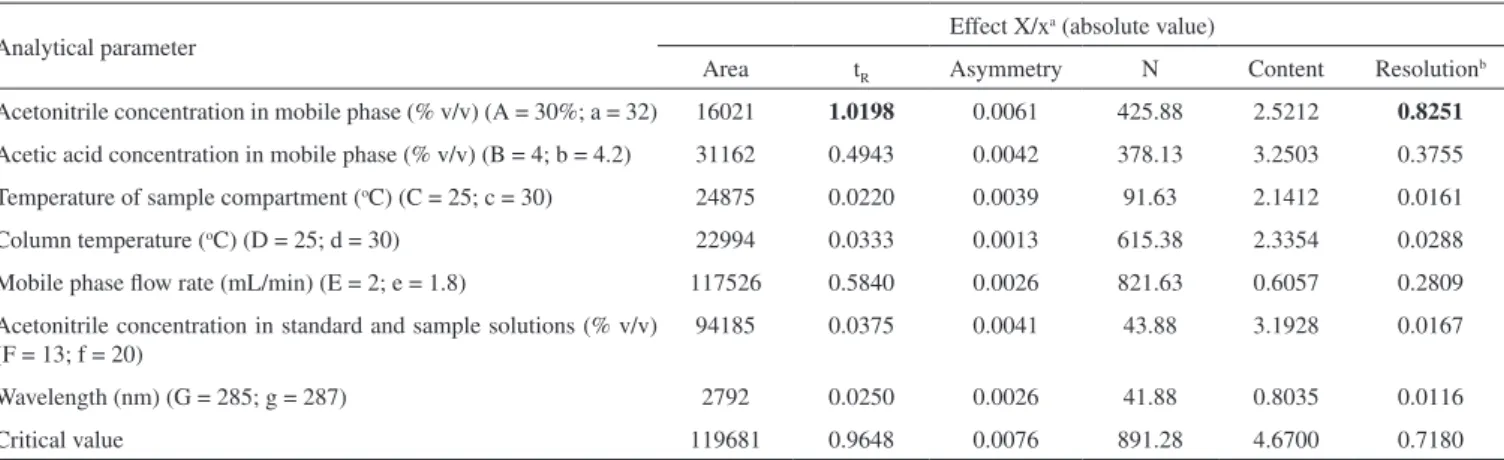
Table 4. Effects of the analytical parameters in area, retention time (tR), asymmetry, theoretical plates number (N), content, and resolution of the HPLC method for etoposide determination in PCL implant
Analytical parameter Effect X/x
a (absolute value)
Area tR Asymmetry N Content Resolution b
Acetonitrile concentration in mobile phase (% v/v) (A = 30%; a = 32) 16021 1.0198 0.0061 425.88 2.5212 0.8251 Acetic acid concentration in mobile phase (% v/v) (B = 4; b = 4.2) 31162 0.4943 0.0042 378.13 3.2503 0.3755 Temperature of sample compartment (oC) (C = 25; c = 30) 24875 0.0220 0.0039 91.63 2.1412 0.0161 Column temperature (oC) (D = 25; d = 30) 22994 0.0333 0.0013 615.38 2.3354 0.0288 Mobile phase flow rate (mL/min) (E = 2; e = 1.8) 117526 0.5840 0.0026 821.63 0.6057 0.2809 Acetonitrile concentration in standard and sample solutions (% v/v)
(F = 13; f = 20)
94185 0.0375 0.0041 43.88 3.1928 0.0167
Wavelength (nm) (G = 285; g = 287) 2792 0.0250 0.0026 41.88 0.8035 0.0116
Critical value 119681 0.9648 0.0076 891.28 4.6700 0.7180
a Difference between average of the values obtained at nominal conditions and average of the values obtained at altered conditions. b Resolution between peaks of etoposide and its degradation product in alkaline condition present in the chromatogram of system suitability solution.
The results obtained on the robustness test are shown in Table 4. The HPLC method appears to be robust regarding most of the variables analyzed, as the difference between results obtained under nominal and modified conditions were lower than the critical value for all analytical parameters studied (Table 4), with the exception of acetonitrile concentration in the mobile phase. The retention time of the etoposide peak and resolution between peaks of the drug and its degradation product were influenced by change in acetonitrile content of mobile phase. The increase in acetonitrile concentration increased the eluent strength of mobile phase and promoted at reduction in retention time of the etoposide peak and in resolution. Thus, this analytical parameter should be carefully controlled.
The proposed method was applied for the analysis of etoposide in PCL implants. The mean episode content incorporated into the polymeric implant was 101.41 ± 1.03% (n = 6) of the pre-indicated value (50% w/w). The etoposide-loaded PCL implants prepared for validation and application of the HPLC method had an average weight of 2.26 ± 0.08 mg, length of 6.34 ± 0.18 mm, and diameter of 0.62 ± 0.02 mm (n = 10).
CONCLUSION
The HPLC method developed proved precise, accurate, robust, selective regarding sample excipient and easy to apply, for the deter-mination of etoposide incorporated into PCL implants. The method is simple and rapid compared to the pharmacopeial methods for es-timating etoposide in bulk material and pharmaceutical formulations whose analysis time is longer than 40 min. The etoposide-loaded PCL implants analyzed by the validated method showed adequate quality and drug content in accordance with the labeled amount.
ACKNOWLEDGEMENTS
The authors would like to thank Quiral Química do Brasil S.A., for the etoposide donation, and CNPq, FAPEMIG and Brazilian Pharmacopoeia, for the financial support.
REFERENCES
1. Shirazi, F. H.; Bahrami, G.; Stewart, D. J.; Tomiak, E.; Delorme, F.; Noel, D.; Goel, R.; J. Pharm. Biomed. Anal. 2001, 25, 353.
2. Hande, K.R.; Eur. J. Cancer 1998, 34, 1514.
3. Weinberg, B. D.; Blanco, E.; Gao, J.; J. Pharm. Sci. 2008, 97, 1681. 4. Eljarrat-Binstock, E.; Pe’er, J.; Domb, A. J.; Pharm. Res. 2010, 27, 530. 5. Woodruff, M. A.; Hutmacher, D. W.; Prog. Polym. Sci. 2010, 35, 1217. 6. Tang, B. C.; Fu, J.; Watkins, D. N.; Hanes, J.; Biomaterials 2010, 31,
339.
7. Beijnen, J. H.; Holthuis, J. J. M.; Kerkdijk, H. G.; Houwen, O. A. G. J.; Paalman, A. C. A.; Bult, A.; Underberg, W. J. M.; Int. J. Pharm. 1988, 41, 169.
8. Chen, C. L.; Uckun, F. M.; J. Chromatogr., B: Anal. Technol. Biomed. Life Sci. 2000, 744, 91.
9. United States Pharmacopoeia; 34th ed., The United States Pharmaco-peial Convention: Rockville, 2011.
10. British pharmacopoeia; Her Majesty’s Stationery Office: London, 2011. 11. http://jpdb.nihs.go.jp/jp15e/, accessed September 2011.
12. Brasil, Agência Nacional de Vigilância Sanitária, Resolução RE n°899, 29/5/2003; Guia para validação de métodos analíticos e bioanalíticos, Diário Oficial da União, Poder Executivo, Brasília, 2003.
13. h t t p : / / w w w. i n m e t r o . g ov. b r / S i d o q / A r q u ivo s / C G C R E / D O Q / DOQCGCRE-8_02.pdf, accessed September 2011.
14. Rozet, E.; Ceccato, A.; Hubert, C.; Ziemons, E.; Oprean, R.; Rudaz, S.; Boulanger, B.; Hubert, P.; J. Chromatogr., A 2007, 1158, 111. 15. Hubert, P.; Nguyen-Huu, J. J.; Boulanger, B.; Chapuzet, E.; Cohen, N.;
Compagnon, P. A.; Dewé, W.; Feinberg, M.; Laurentie, M.; Mercier, N.; Muzard, G.; Valat, L.; Rozet, E.; J. Pharm. Biomed. Anal. 2007, 45, 82. 16. International Conference on Harmonisation – ICH; Topic Q2B validation
of analytical procedures: methodology. ICH Secretariat: Geneva, 1996. 17. http://www.who.int/medicines/publications/pharmacopoeia/en/index.
html, accessed September 2011.
18. Souza, S. V. C.; Junqueira, R. G.; Anal. Chim. Acta 2005, 552, 25. 19. Snedecor, G. W.; Cochran, W. G.; Statistical methods, 8th ed., Jowa State
University: Ames, 1996.
20. Youden, W. J.; Steiner, E. H.; Statistical manual of AOAC - Association of Official Analytical Chemistry, AOAC: Washington, 1975.