Artigo
*e-mail: [email protected]
POTENTIOMETRIC DETERMINATION OF NICKEL (II) ION USING 2-HYDROXY-1-NAPHTHYLIDENE-N -CYANOACETOHYDRAZONE AS ELECTROACTIVE MATERIAL
Harish Kumar Sharmaa,*, Pernita Dograa, Akhilesh Kumar Guptaa and Fardad Koohyarb
aDepartment of Chemistry, M. M. Engineering College, Maharishi Markendeshwer University, Mullana (Ambala), India bDepartment of Chemistry, Faculty of Science, Science and Research Ayatollah Amoli Branch, Islamic Azad University, Amol, Iran
Recebido em 23/01/2014; aceito em 04/06/2014; publicado na web em 22/07/2014
A potentiometric Nickel sensor was prepared using 2-hydroxy-1-naphthylidene-N-cyanoacetohydrazone as electro-active material and epoxy resin as a binding material. A membrane composed of 40% Schiff’s base and 60% epoxy resin exhibited the best performance. The membrane showed excellent response in the concentration range of 0.15 ppm to 0.1 mol L–1 Ni+2 ions with non-Nernstian slope
of 22.0 mV/decade, had a rapid response time (less than 10 s), and can be used for three months without any considerable loss of potential. The sensor was useful within the pH range of 1.3 to 9.6, and was able to discriminate between Ni2+ and a large number
of alkaline earth and transition metal ions. The practical utility of the sensor has been demonstrated by using it successfully as an indicator electrode in the potentiometric titration of Ni2+ with EDTA and oxalic acid.
Keywords: ion selective electrode; Schiff’s base; Ni2+; FIM; potentiometric titration.
INTRODUCTION
Nickel is an element that occurs in the environment at very low levels and is essential to living organisms in small doses, but it can be very dangerous when the maximum tolerable amounts are exceeded.1-3 Nickel is mostly used as an ingredient of steel and other metal products. Also, nickel products such as nickel-based catalysts have an important role in the reactions between organic compounds.4-10
The main source of nickel in aquatic systems is decomposition or degradation of rocks and soil, biological cycles and especially indus-trial processes, and water disposal.11 Nickel sulfide fumes and dust are believed to be carcinogenic and various other nickel compounds may be toxic as well.12,13 Nickel carbonyl, [Ni(CO)
4], is an extremely toxic gas, and is explosive in air.14,15 The toxicity of metal carbonyls is a function of both the toxicity of the metal and the carbonyl’s capacity to give off highly toxic carbon monoxide gas, and this one is no exception. A skin allergy, also known as dermatitis, may be expressed by individuals sensitized to nickel. Nickel is an important cause of contact allergy, partly due to its use in jewelry intended for pierced ears.16 Due to the urgent need for selective monitoring of Ni2+ in many industrial, environmental, and food samples, there have been a number of recent reports in the literature.17-22
A number of methods23-28 such as atomic absorption spectrometry (AAS), atomic absorption spectrometry electrothermal atomization (AAS-ETA), inductively coupled plasma-atomic emission spectros-copy (ICP-AES), and flame photometry can be used for determination of nickel. These methods generally require sample pretreatment and infrastructure backup; therefore, are not very convenient for routine analysis of a large number of environmental samples. Thus, there is a critical need for the development of selective, portable, and inex-pensive diagnostic tools for the determination of nickel. Many optical chemical sensors utilize colored complexes29,30 or redox reagents31,32 immobilized in a suitable matrix.
A potentiometric sensor for determination of the ions in real samples offers interesting advantages such as simplicity, speed, re-latively fast response, low cost, wide linear dynamic range, and ease of preparation and procedures. These characteristics have inevitably
led to the preparation of numerous sensors for several ionic species and the number of available electrodes has increased substantially over the past years. There has been an increased interest in developing such sensors for transition metal ions recently and many reports33-35 have been given on various metal ions like Cr3+, Mn2+, Fe2+, Cu2+, Zn2+, Cd2+, Hg+, etc.
The hydrazones and their metal complexes have many important applications in analytical chemistry and pharmacology.36-38 El-Saied et al. studied the chelating behavior of neutral and deprotonated 2, 6-diacetylpyridinemono-(carbohydrazone)39,40 in some new complex-es of Pd (II), Mn (II), Fe (III), Co (II), Ni (II), Cu (II), and UO2 (IV). Recently, these authors have introduced a cyano group to hydrazone Schiff base compounds, prepared and characterized the complexes derived from 4-formlylantipyrine-N-cyano- acetatehydrazone.
In this work, we developed a Ni2+ ion-selective electrode (ISE) based on 2-hydroxy-1-naphthylidene-N-cyanoacetohydrazone as a suitable ionophore for Ni2+ determination. The sensor has a wide working concentration range and a rapid response time with repro-ducible results and is highly selective.
EXPERIMENTAL
Reagents
Analytical grade transition metal halides including nickel chlo-ride, cobalt chlochlo-ride, cadmium chlochlo-ride, zinc chlochlo-ride, and copper chloride were procured from C.D.H. Chemicals Ltd. India. Analytical grade hydrazine, ethylcyanoacetate, aldehyde, and ethanol were procured from S.D. Fine Chemicals Ltd., India. A solution of nickel chloride was standardized against EDTA solution using xylenol orange as an indicator and hexamine as a buffer. Double-distilled deionized water was used throughout the experiment.
Apparatus
Synthesis of 2-hydroxy-1-naphthylidene-N -cyanoacetohydrazone
2-hydroxy-1-naphthylidene-N-cyanoacetohydrazone was pre-pared according to procedures specified by Saeyda Abou El-Enein et al.40 The sensor was prepared with cyanoacetohydrazide that was synthesized by adding 20 mL (387.1 mmol) of hydrazine hydrate dropwise to 42.6 mL (354.2 mmol) of ethylcyanoacetate, and stirring on an ice bath. After about 5 min, a white precipitate formed which was filtered off, washed several times with ethanol, and dried over P4O10. Yield: 90%, m.p. = 109 °C.
The Schiff’s base, 2-hydroxy-1-naphthylidene-N -cyanoacetohy-drazone was prepared by mixing equimolar amounts of cyanoaceto-hydrazide and the appropriate aldehyde in 50 mL absolute ethanol. The cold mixture was magnetically stirred for an hour. Precipitated products were filtered off, crystallized from ethanol, and dried under vacuum over P4O10. The resulting product is a yellow powder (80% yield) with a melting point of 195 °C.
Distribution studies
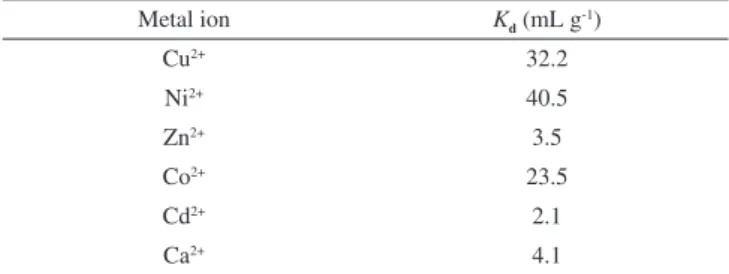
The distribution coefficient (Kd) for Cu2+, Ni2+, Zn2+, Co2+, Cd2+, and Ca2+ was determined in aqueous solutions by keeping 20 mL of distilled water and 0.1 g of a synthesized exchanger overnight in a titration flask. The solution was shaken intermittently to attain equilibrium. The strength of the exchanged metal ion solution was obtained by titrating against 0.01 mol L–1 EDTA (standardized with PbNO3), and the distribution coefficient was determined by using the following equation:
(1)
where I and F are the volumes of EDTA (0.01 mol L–1) consumed by cations before and after equilibrium, respectively, V is the initial volume of the metal ion solution for analysis, and W is the initial dry mass of ion exchanger. Results of the titration and distribution coefficient are given in Table 1.
Preparation of membranes
Membranes were prepared by using varying amounts of epoxy resin as a binding material and 2-hydroxy-1-naphthylidene- N--cyanoacetohydrazone as electro-active material (Table 2). Desired amount of finely powdered exchanger was mixed thoroughly with epoxy resin in varying amounts (w/w) to make a near homogeneous paste that was then spread between the folds of butter paper. Glass plates were kept below and above the paper folds as supports. A pressure of 2.0 kg cm−2 was applied over the glass plates for 24 h and left to dry. The sheet of membrane was then dipped in distilled water to remove the paper from the membrane surface. Prepared membranes were cut in the shape of circular discs (2.0 cm diame-ter) and those with desirable surface qualities were selected for further studies.
EMF measurements
The prepared membranes were glued to one end of a 1.8 cm inner diameter glass tube using epoxy resin and sealed properly. These were then conditioned with 0.1 mol L−1 Ni2+ ion solution for 24 h. The tube was filled with a solution of 0.1 mol L−1 Ni2+ ion solution and immersed in a beaker containing test solutions of varying concentra-tions. A saturated calomel electrode was used as an external reference electrode. The ionic strength of the solutions was maintained with the help of a saturated solution of KCl. Electromotive force (EMF) measurements were carried out using the following cell assembly: Hg-Hg2Cl2(s), KCl (sat.)│0.1 mol L–1 Ni2+ || membrane || test solution│ KCl (sat.), Hg2Cl2 (s)-Hg.
A digital potentiometer (Floura, model-105, India) was used for the potential measurements at 25 ± 0.1 °C. Activities were calculated according to the Debye-Huckel equation.41 Test solutions of Ni2+ were obtained by gradual dilution of 0.1 mol L−1 Ni2+ solution and their potential measurements were made in an un-buffered solution.
Storage of electrodes
Electrodes were stored in distilled water when not in use, and before use were activated by keeping immersed in the 0.1 mol L−1 Ni2+ ion solution for 2 h. Activation with the Ni2+ ion solution com-pensated for any loss of metal ions from the membrane phase that took place during storage in distilled water. Electrodes were then washed thoroughly with distilled water before use.
RESULTS AND DISCUSSION
The distribution coefficient (Kd) values for various metal ions are given in Table 1, which shows that Ni2+ exhibited the highest K
d (40.5 g mL−1) amongst the tested metal ions. Hence, on the basis of distribution studies42, the synthesized Schiff’s base was found to be most selective towards Ni2+ metal ions.
Optimization of membrane composition and calibration curves
The effect of membrane composition on the response of the electrode was studied. Performance parameters including slope of
Table 1. Distribution coefficient, Kd, values (obtained from equation 1) for
various metal ions
Metal ion Kd(mL g-1)
Cu2+ 32.2
Ni2+ 40.5
Zn2+ 3.5
Co2+ 23.5
Cd2+ 2.1
Ca2+ 4.1
Table 2. Optimization of membrane ingredients
Electroactive Material* Electrode No. % electroactive material Slope (mV/decade) Measuring range (mol L−1) Response time (s)
Schiff’s base
Ni-1 50 25 1.2×10⁻⁷ - 1.0×10⁻¹ 30
Ni-2 60 22 6.3×10⁻⁷ - 1.0×10⁻¹ 20
Ni-3 40 22 1.5×10⁻⁷ - 1.0×10⁻¹ 10
the calibration curve, measurement range, and the response time were compared (Table 2) for prepared electrodes. Schiff’s base (40%) electrode with composition and epoxy resin (60%) shows excellent response in the concentration range of 10−7 mol L−1 to 10−1 mol L−1 Ni2+ ion with a non-Nernstian slope of 22.0 mV/decade. This electrode also had a rapid response time of 10 s and was selected for further studies. Potential measurements were made on the selected electrode for different concentrations of Ni2+ ion solutions, and repeated five times to check the reproducibility of the electrode system. A standard deviation of ±1.0 mV was observed for EMFs plotted against log of activities of the nickel ion. Detection limit was calculated according to the IUPAC recommendation43 by finding the point of intersection for the linear portions of the extrapolated linear portions of the ca-libration curves (Figure 1). The sensing behavior of the membranes remains unchanged when the potentials are measured either from low to high or from high to low concentration. The electrode was stored in 0.1 mol L−1 Ni2+ ion solution when not in use to avoid any change in the concentration in membrane phase.
Effects of internal solution concentration
The effect of internal solution on the response of the Ni2+ ion was studied using a 10−1 mol L−1 to 10−3 mol L−1 internal solution concentration for an electrode with Schiff’s base (Table 3). The results show that a variation in concentration of the internal solution does not have a significant effect on the response of the electrode, except for a change in the intercept of the curve as observed by Mittal et al.44 Effect of pH
The influence of pH on the potential response of the electrode was studied at 2 × 10⁻² mol L−1 concentration of external solution over a pH range of 2.0 to 12.0 for the electrode with Schiff’s base (Figure 2). pH was adjusted by introducing small drops of HCl (0.1 mol L−1) or NaOH (0.1 mol L−1) as necessary. The potential of the electrode
is independent of the pH range 1.3 to 9.6; hence, this pH range was chosen as the working pH range for the electrode assembly. Sharp variation (in potential) above pH 9.6 may be due to the formation of hydroxy complexes of nickel due to excessive amounts of added NaOH. A drop in EMF may be attributed to the penetration of OH- ions into the membrane and reaction with metal ions that decreases the ion pairs; thus, decreasing the amount of the electro-active material of the electrode. Variation in EMF below pH 1.3 may be due to protonation of oxygen atoms caused by excessive amounts of added HCl. It may also be due to leaching of the metal ions in acidic media.
Selectivity coefficient and analytical properties of Ni2+ selective
electrodes
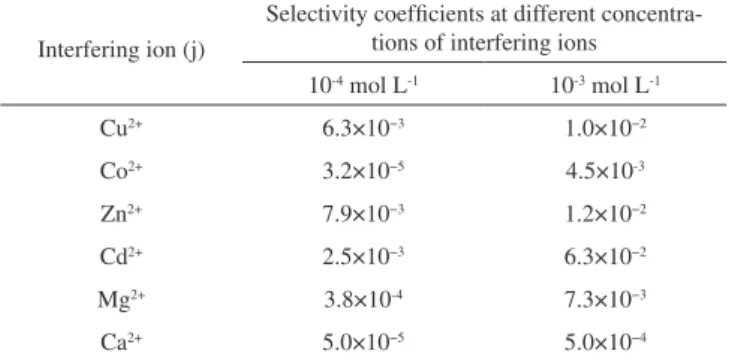
The most characteristic property of a sensor is the capability to discriminate between different substances, which is a function of the selective component. A sensor’s capability to discriminate between ions describes the preference of the membrane sensor for detecting Ni2+ versus an interfering ion. The potentiometric selectivity coeffi-cients of the nickel membrane electrode were evaluated by the fixed interference method (FIM)42-48 at 1 × 10⁻³ mol L−1 and 1 × 10⁻⁴ mol L−1 foreign ion concentrations. According to this method, a calibration curve is drawn for the primary ion with a constant interfering ion background. The linear portion of the curve is extrapolated until it intersects with the second linear part of the curve in the low concen-tration region. The selectivity coefficients are calculated from these two segments of the calibration curve by using the following equation:
(2)
Table 3. Effect of internal solution concentrations on response of Ni2+ ion-selective electrode (ISE) using Schiff’s base
Electro-active Material Schiff’s base (W/w%)
% Composition of membrane* 60 50 40
Internal solution concentration (mol L−1) 0.1 0.01 0.001 0.1 0.01 0.001 0.1 0.01 0.001
Slope (mV/decade) 22.0 25.0 25.0 25.0 28.0 29.0 22.0 25.0 23.0
Response time (s) 20 25 25 30 18 20 10 30 15
Detection limit (M) 6.3×10⁻⁷ 1.5×10⁻⁷ 2.5×10⁻⁷ 1.2×10⁻⁷ 1.9×10⁻⁷ 2.5×10⁻⁷ 1.5×10⁻⁷ 6.3×10⁻⁷ 3.1×10⁻⁷
*For this electrode, binder is epoxy.
Figure 1. Calibration curve for Ni2+ selective electrode using Schiff ’s base
(40%)
Figure 2. Effect of pH on the response of the Ni2+ selective electrode using
where ai and aj are the activities of the primary ion (Ni2+) and inter-fering ion, respectively; and Zi and Zj are the charges of the primary ion (Ni2+) and interfering ion, respectively.
Selectivity coefficient values for various metals are consolidated in Table 4. Results show that for each interfering ion, the selectiv-ity coefficient increases as the molar concentration of interfering ion decreases. The selectivity coefficient pattern clearly indicates that the electrode is efficiently selective to Ni2+. Value of selectivity coefficient equal to 1.0 indicates that the sensor responds equally to primary as well as interfering ions. However, values smaller than 1.0 indicate that the membrane sensor is responding more to the primary ion rather than interfering ions. When the selectivity coefficient is smaller, then the corresponding selectivity order is higher. The values of selectivity coefficient presented in Table 4 show that the selectiv-ity coefficient values for the sensor are much smaller than 1.0 for a number of interfering ions. Therefore, the electrode is highly selective to Ni2+ in solutions containing other metal ions. The electrode also is highly selective to Ni2+ for some solutions containing common alkaline earth and transition metal ions. Therefore, the electrode is highly effective for determining Ni2+ concentrations and can be used for direct potentiometry.
Potentiometric titration
The practical utility of 2-hydroxy-1-naphthylidene-N -cyanoace-tohydrazone membrane sensor was tested by using it as an indicator electrode. The Ni2+–selective electrode was successfully used for the determination of Ni2+ content in water within a pH range of 1.3–9.6. Titration of 20 mL of 10−3 mol L−1 Ni2+ solution was carried out against 5 × 10⁻³ M EDTA and oxalic acid, with the titration curve for the sensor being shown in Figures 3 and 4. Titration curves show a sharp inflection point at the titrant volume corresponding to the end
point, which corresponds to 1:1 complexation between Ni2+- EDTA and Ni2+ - oxalic acid. The sharp inflection point shows that this electrode can be used as an indicator electrode for, or to determine, Ni2+ potentiometrically.
A comparative study of the ISE versus electrodes reported in literature
Performance of the present ISE based on 2-hydroxy-1-na-phthylidene-N-cyanoacetohydrazone is comparable and superior in many ways (such as selectivity, working linear range, response time, and working pH range) to other electrodes reported in the literature (Table 5). Due to the presence of two nitrogen, one
Table 4. Selectivity coefficients for Ni2+- selective electrode based on Schiff’s
base as calculated by FIM method in the presence of various interfering ions
Interfering ion (j)
Selectivity coefficients at different concentra-tions of interfering ions
10-4 mol L-1 10-3 mol L-1
Cu2+ 6.3×10⁻³ 1.0×10⁻²
Co2+ 3.2×10⁻⁵ 4.5×10⁻³
Zn2+ 7.9×10⁻³ 1.2×10⁻²
Cd2+ 2.5×10⁻³ 6.3×10⁻²
Mg2+ 3.8×10⁻⁴ 7.3×10⁻³
Ca2+ 5.0×10⁻⁵ 5.0×10⁻⁴
Figure 4. Potentiometric titration curves with Ni2+ ISE, using Schiff ’s base,
as an indicator electrode in Oxalic Acid titration
Figure 3. Potentiometric titration curves with Ni2+ ISE, using Schiff ’s base,
as an indicator electrode in EDTA titration
Table 5. Comparison studies of the ISE used in this study versus electrodes reported in the literature
Ionophore Slope (mV/decade) Linear Range (mol L−1) Most Important Interfering
ions (log Ksel > −2)
Ref. N1,N2-bis((naphthalen-1-ymethylene)
ethane-1,2-diamine
29.9 5.0×10⁻⁶ - 1.0×10⁻¹ Na+, K+, Ba2+, Co2+, Ag+, Zn2+ 49
N,N’ -bis-(4-dimethylaminobenzylidene)-ben-zene-1,2-diamine
30 2.0×10⁻⁷ - 1.0×10⁻² Tl+, Ag+ 50
N-(2-hydroxybenzyl)-N’
-(2-hydroxybenzylidene)-ethylenediamine and N-(2-hydroxybenzylidene)-Al’-(2- picolyl) ethylenediatmine (II)
30 and 29 6.3×10⁻⁶ - 5.0×10⁻¹
and 3.2×10⁻⁶ - 5.0×10⁻¹
Ag+, Co2+, Hg2+ 51
N-[2-thienylmethilidene]-2-aminoethanol (TNAHE)
29 and 29 1.0×10⁻⁶ - 1.0×10⁻¹ and
1.0×10⁻⁵ - 1.0×10⁻¹
Cd2+ 52
2-hydroxy-1-naphthylidene-N-cyanoacetohy-drazone
22 1.5×10⁻⁷ - 1.0×10⁻¹ Zn2+, Co2+, Co2+, Cd2+, Mg2+,
Ca2+
cyano and one hydroxyl groups in 2-hydroxy-1-naphthylidene -N-cyanoacetohydrazone, the ISE examined in this study can make complexes with soft metal ions such as Ni2+.
Lifetime of electrode
Potential measurements were recorded regularly over a period of time to determine that the operative lifetime of the sensors is 3 months. The electrode was kept immersed in 0.1 mol L–1 Ni2+ solution when not in use.
CONCLUSION
2-hydroxy-1-naphthylidene-N-cyanoacetohydrazone can be suc-cessfully used as electro-active materials for making a Ni2+ selective membrane electrode. The electrode has reasonably good lifetime, detection limit, pH range, and selectivity coefficient; therefore, it can also be used as indicator electrode.
REFERENCES
1. Wuana, R. A.; Okieimen, F. E.; ISRN Ecol. 2011, 2011, Article ID 402647, 1.
2. Igbum, O. G.; Asemave, K.; Nwadinigwe, C. A.; Akaasah N. Y.; Int. J. Sci. Res. 2013, 2, 463.
3. Barreto, W. J.; Barreto, S. R. G.; Scarminio, I. S.; Ishikawa, D. N.; Fátima, M.; Proença, S. M. V. B.; Quim. Nova. 2010,33, 109. 4. Manuale, D. L.; Betti, C.; Yori, A. J. M. J. C.; Quim. Nova. 2010,33,
1231.
5. Habashi, F.; Journal of Mining and Environment2011, 2, 17. 6. Zachariae, C.; Sørensen, A.; McNamee, P.; Grey, J.; Wooder, M.; Menné,
T.;Contact Dermatitis2004, 50, 138.
7. Montgomery, J.; Angew. Chem., Int. Ed. 2004, 43, 3890.
8. Coll, R.; Salvadó, J.; Farriol, X.; Montané, D.; Fuel Process. Technol.
2001, 74, 19.
9. Huang, L.; Xie, J.; Chen, R.; Chu, D.; Chu, W.; Hsu, A. T.; Int. J. Hy-drogen Energy, 2008, 33, 7448.
10. Connor, E. F.; Younkin, T. R.; Henderson, J. I.; Waltman, A. W.; Grubbs, R. H.; Chem. Commun. 2003, 18, 2272.
11. Metals and their Compounds in the Environment; Merian, E., ed.; VCH: New York, 1991.
12. Dunnick, J. K.; Elwell, M. R.; Radovsky, A. E.; Benson, J. M.; Hahn, F. F.; Nikula, K. J.; Barr, E. B.; Hobbs, C. H.; Cancer Res.1995, 55, 5251. 13. Keith, L.; Lindsay, M. G.; David, N.; Detmar, B.; Nickel Compounds in Ullmann’s Encyclopedia of Industrial Chemistry, Wiley-VCH: Wein-heim, 2005.
14. Barceloux, D. G.; Barceloux, D.; Clin. Toxicol. 1999, 37, 239. 15. Thyssen, J. P., Linneberg, A.; Menné, T.; Johansen, J. D.; Contact
Der-matitis2007, 57, 287.
16. Nestle, O.; Speidel, H.; Speidel, M. O.; Nat. 2002, 419, 132.
17. Gupta, V. K.; Jain, A. K.; Ishtaiwi, Z.; Langb, H.; Maheshwari, G.; Talanta2007, 803, 73.
18. Rao, G. N.; Srivastava, S.; Srivastava, S. K.; Talanta1996, 43, 1821. 19. Gupta, V. K.; Jain, A. K.; Singh, L. P.; Khurana, U.; Anal. Chim. Acta
1997, 355, 33.
20. Jain, A. K.; Gupta, V. K.; Singh, R. D.; Khurana, U.; Singh, L. P.; Sens. Actuators, B.1997, 40, 15.
21. Gupta, V. K.; Prasad, R.; Kumar, P.; Mangla, R.; Anal. Chim. Acta2000, 27, 19.
22. Mazloum M.; Niassary, M. S.; K.Amini, M.; Sens. Actuators, B.2002, 82, 259.
23. Fries, J.; Etrost, G. H.; Organic Reagents for Trace Analysis, E. Merck: Darmstadt, 1977.
24. Haasw, O.; Klarre, M.; Broaekaert, J. A. C.; Krengel, K.; Analyst. 1998, 123, 1219.
25. Magalhaes, C. E. C.; Krug, F. J.; Fostier, A. H.; Berndt, H.; J. Anal. At. Spectrom. 1997, 12, 1231.
26. Potts, L. W.; Quantitative Analysis. Theory and Practice, Harper and Row: New York, 1987.
27. Rudner, P. C.; De Torres, A. G.; Pav´on, J. M. C.; Castellon, E. R.; J. Anal. At. Spectrom. 1998, 13, 243.
28. Madden, J. E.; Cardwell, T. J.; Cattrall, R. W.; Deady, L. W.; Anal. Chim. Acta1996, 319, 129.
29. Cov, L. C.; Canrdwell, T. J.; Cattral, R. W.; Kolev, S. D.; In Proceeding of the 12th Conference of Eurosensors, Southampton, UK, 1998. 30. Oehme, I.; Prattes, S.; Wolfbeis, O. S.; Mohr, G. J.; Talanta1998, 47,
595.
31. Newcombe, D. T.; Cardwell, T. J.; Cattrall, R. W.; Kolev, S. D.; Anal. Chim. Acta 1999, 401, 137.
32. Newcombe, D. T.; Cardwell, T. J.; Cattrall, R. W.; Kolev, S. D.; Lab. Rob. Autom. 2000, 12, 200.
33. Ganjali, M. R.; Salavati-Niasari, M.; Yousefi, M.; Anal. Lett. 2003, 36, 2735.
34. Ganjali, M. R.; Salavati-Niasari, M.; Mizaniand, F.; Javanbakht, M.; Anal. Sci. 2003, 19, 235.
35. Gupta, V. K.; Jain, A. K.; Maheshwari, G.; Talanta2007, 72, 49. 36. Jayasree, S.; Arvindakshan, K. K.; J. Indian Chem. Soc. 1994, 71, 97. 37. Parashar, R. K.; Sharma, R. C.; Inorg. Chem. Acta1988, 151, 201. 38. Arguelles, M. C. R.; Ferrari, M. B.; Bisceglie, F.; Plizzi, C.; Pelosi, G.;
Pinelli, S.; Sassi, M.; J. Inorg. Biochem. 2004, 98, 313.
39. El-Saied, F. A.; Ayad, I. M.; Issa, R. M.; Aly, S. A.; Pol. J. Chem. 2001, 75, 773.
40. Abou El-Enein, S; El-Saied, F. A.; Emam, S. M.; Ell-Salamony, M. A.; Spectrochim. Acta, Part A2008, 971, 421.
41. Bakker, E.; Electroanalysis1997, 9, 7.
42. Mittal, S. K.; Sharma, H. K.; Kumar, S. K. A.; React. Funct. Polym.
2006, 66, 1174.
43. Umezawa, Y.; Umezawa, K.; Sato, H.; Pure Appl. Chem. 1995, 67, 507. 44. Mittal, S. K.; Sharma, H. K.; Kumar, S. K. A.; Sensors2004, 4, 125. 45. Bakker, E.; Pretsch, E.; Bühlmann, P.; Anal. Chem. 2000, 72,1127. 46. Mittal, S. K.; Kumar, S. K. A.; Sharma, H. K.; J. Chem.2010, 7, 849. 47. Mazloum-Ardakani,M.; Pourhakkak, P.; Salavati-Niasari, M.; Karimi,
M. A.; Mashhadizadeh, M. H.; J. Braz. Chem. Soc.2011, 22, 30. 48. Belhamel, K.; Ludwig, R.; Benamor, M.; Microchim. Acta2005, 149,
145.
49. Kumar, K. G.; Poduval, R.; Augustine, P.; John, S.; Saraswathyamma, B. A.; Anal. Sci.2006, 22, 1333.
50. Mashhadizadeh, M. H.; Sheikhshoaie, I.; Saeid-Nia, S.; Sens. Actuators, B2003, 94, 241.
51. Jain, A. K.; Gupta, V. K.; Ganeshpure, P. A.; Raisoni, J. R.; Anal. Chim. Acta2005, 553, 177.