Nota Técnica
*e-mail: [email protected]
UV DETERMINATION OF EPINEPHRINE, URIC ACID, AND ACETAMINOPHEN IN PHARMACEUTICAL FORMULATIONS AND SOME HUMAN BODY FLUIDS USING MULTIVARIATE CALIBRATION
Hanieh Montaseria,*, Habibollah Khajehsharifia and Saeed Yousefinejadb aDepartment of Chemistry, Yasouj University, 75914-353, Yasouj, Iran bInstitute of Biochemistry and Biophysics, University of Tehran, Tehran, Iran
Recebido em 03/02/2014; aceito em 18/05/2014; publicado na web em 22/07/2014
In this work, a spectrophotometric methodology was applied in order to determine epinephrine (EP), uric acid (UA), and acetaminophen (AC) in pharmaceutical formulations and spiked human serum, plasma, and urine by using a multivariate approach. Multivariate calibration methods such as partial least squares (PLS) methods and its derivates were used to obtain a model for simultaneous determination of EP, UA and AC with good figures of merit and mixture design was in the range of 1.8–35.3, 1.7–16.8, and 1.5–12.1 µg mL−1. The 2nd derivate PLS showed recoveries of 95.3–103.3, 93.3–104.0, and 94.0–105.5 µg mL−1 for EP, UA, and
AC, respectively.
Keyword: ternary mixture; simultaneous determination; multivariate analysis.
INTRODUCTION
Epinephrine (EP), known as adrenaline, is a hormone that belongs to the family of excitatory chemical neurotransmitters,1 and it mainly
exists in the cationic form in biological fluids.1,2 EP plays a very
important role in the function of the central nervous system (CNS), renal, hormonal, and cardiovascular system,3 as well as increases
heart rate, contracts blood vessels, and dilates air passage, and it participates in the fight-or-flight response of the sympathetic nervous system.4 Accurate and selective measurements of catecholamines such
as dopamine, epinephrine, norepinephrine (NEP), and serotonin (SE) in biological samples are important for both clinical diagnoses and pathological studies of some diseases.5
Uric acid or urate (UA) is produced by xanthine oxidase from xanthine and hypoxanthine, which in turn are produced from purine. UA is more toxic to tissue than either xanthine or hypoxanthine and is released in hypoxic conditions.6 In humans and higher primates,
UA is the final oxidation (breakdown) product of purine (guanine and adenine) metabolism and is excreted in urine. Over half the antioxi-dant capacity of blood plasma comes from UA,7 and about 70% of
daily UA disposal occurs via the kidneys; moreover, in 5%-25% of humans, impaired renal (kidney) excretion leads to hyperuricaemia.8
Abnormal levels of UA concentration leads to several diseases, such as hyperuricaemia, gout,9,10 leukemia, pneumonia,9 and Lesch–Nyhan
syndrome.11 Note that the normal concentration of UA in the blood
is 120-450 µmol L−1 and in urine about 2 µmol L−1.12-14
Paracetamol or acetaminophen (AC) is an acylated aromatic am-ide that was first introduced by Von Mering in 1893 as an antipyretic/ analgesic medicine. AC unlike other common analgesics, such as as-pirin and ibuprofen, has relatively little anti–inflammatory activity. As a result, it is not considered to be a non–steroidal anti–inflammatory drug (NSAID). Acute overdoses of paracetamol can cause potentially fatal liver damage, and in some individuals, a normal dose can cause the same, but the risk can be heightened by alcohol consumption. Recent studies suggest that excessive doses and/or excessively high plasma concentrations of AC may be associated with
hepatotoxic-ity.15-18 Therefore, understanding the pharmacokinetic properties of
AC in humans can be valuable for preventing clinical toxicity.
Spectroscopy is a simple analytical method for quantitative analy-sis, but the method is not selective and requires that analytes in a given sample have different spectrum with low overlap. Complex spectra can be resolved by simultaneous determinations using derivative techniques and chemometric methods, which avoids time-consuming separation. Derivative techniques have proven to be very useful in the resolution of binary and ternary mixtures, whereas multivari-ate calibration has been found to be the method of choice for more complex mixtures.19 Moreover, chemometric-assisted
spectropho-tometry is a combination of chemometrics and analytical chemistry that increases the signal-to-noise (S/N) ratio, improves selectivity of determination, optimizes experimental condition, increases analytical operation efficiency, and provides much more scientific information than conventional spectrophotometry.20-22
Chemometric algorithms for performing regression, including partial least squares (PLS) and principal component regression (PCR), are designed to avoid problems associated with noise and correlations in the data. Because the regression algorithms are based on factor analysis, the entire group of known measurements is consi-dered simultaneously, and information about correlations among the variables is automatically built into the calibration model.23 The first
derivate PLS is commonly used to eliminate baseline offset variations within a set of spectra and the 2nd derivate PLS eliminates both the
offset and slope. Irrespective of the order, both derivatives lead to an increased spectral resolution at the expense of a decreased signal-to--noise ratio.24,25 These methods allow for calibration to be performed
by ignoring the concentration of all other components except the analyte of interest, and they do not require any derivatization, prior separation, or sample pretreatment.
In the present work, original PLS and its derivates have been used to develop sensitive and selective procedures for the simultaneous determination of ternary mixtures composed of EP, UA, and AC. Note that AC can be considered as a narcotic drug that can be prescribed to all patients. In some cases, patients having high concentrations of UA in their bloodstream may suffer from an infarction that requires an EP injection. Catecholamine drugs are used to treat hypertension, bronchial asthma, and organic heart disease, and they are used in cardiac surgery and myocardial infarction.26 Therefore, simultaneous
EXPERIMENTAL
Materials
Apparatus and software
Electronic absorption measurements were carried out on a Jasco v-570 spectrophotometer (slit width of 1.0 nm, scan rate of 2000 cm/min) using 1.00 cm quartz cells. The measurements for pH were performed by a Metrohm 692 pH meter using a combined electrode. All spectra were digitized and stored at wavelengths from 220 to 320 nm in steps of 1 nm, and then transferred in TXT format to a Pentium 4, 2.4 GHz computer using MATLAB software, version 7.6.0 (The Math Works). PLS, 1st, and 2nd derivate PLS were conducted in the
PLS Tool box (Eigenvector Company, version 2.1). Derivative spectra were obtained with a quadratic Savitzky–Golay algorithm with 11 convolution points.
Reagents and solutions
All chemicals used were of analytical reagent grade, and throu-ghout the experiments, doubly distilled water was used. UA and EP were purchased from Merck, New Jersey, America, while AC and trichloroacetic acid were supplied from Darou Pakhsh, Tehran, Iran and Fluka, Buchs, Switzerland, respectively. The AC tablets and EP ampoule were purchased from GlaxoSmithKline, Dungarvan Ltd., Ireland and Darou Pakhsh Tehran, Iran, respectively. The stock solu-tions of UA and EP were prepared by addition of 2–3 drops of 1.0 mol L−1 KOH (Merck) to appropriate volumes of doubly distilled water.
AC was also prepared in doubly distilled water (without addition of KOH). An aqueous buffer solution (pH = 7.0, 0.1 mol L−1) was
pre-pared by weighing and dissolving adequate amounts of KH2PO4 in
doubly distilled water, and the pH was adjusted using NaOH (Merck, New Jersey, America). The serum, plasma, and urine samples were prepared by spiking serum, plasma, and urine from humans with appropriate amounts from the stock solutions of EP, UA, and AC. Procedure
Single component calibration
To determine the linear dynamic range (LDR) for each com-ponent, different volumes of stock solution (0.01 mol L−1) of each
component were added to 10 mL volumetric flask and diluted with a buffer solution (pH = 7.0). The electronic absorption spectra were recorded over the range of 220-320 nm. Maximum absorption of EP, UA, and AC were at the wavelength of 283, 292, and 243 nm, respectively. The LDR for each component was obtained by plotting absorbance versus concentration (Table 1).
Standard calibration and prediction sets
A mixture designed for three components was used for the cali-bration set to provide good prediction in the PLS approach with 36 samples as shown in Table 2. 7 mixtures was randomly designed as prediction set and their concentrations were chosen in the range of calibration concentration but were not identity to the concentration of calibration mixtures. On the other hand, the maximum absorbance of the standard solutions should not exceed the maximum absorbance
reading of the instrument (i.e., should not be overloaded). The stan-dard solutions (calibration and prediction sets) were prepared in 10.0 mL volumetric flasks by adding appropriate amounts of each stock solution and diluted using a buffer solution (pH = 7.0). Finally, the absorption spectra of the solutions were recorded between 220 and 320 nm against a blank buffer.
Sample preparation
Serum and plasma sample
The serum or plasma samples were homogenized. For the de-proteinization, 1 mL of 24% w/v trichloroacetic acid was added to 1 mL of serum or plasma, and after 15 min, the resultant mixture was centrifuged at 3000 rpm.27 The pH of the supernatant solution
was adjusted to pH of 7.0 using an NaOH solution. Subsequently, , appropriate amount of the EP, UA, and AC stock solutions were added to 0.5 mL of the prepared serum or plasma, and then filled to the final volume (10 mL) with a buffer solution to obtain the desired concentration. Electronic absorption spectra were recorded in the range of 220–320 nm.
Urine sample
Urine samples were diluted 1:3 with doubly distilled water. Cell debris and particulate matter were removed from the urine using low-speed centrifugation (for 5 min at 1500 rpm).28 Then, NaOH
solution was added to the supernatant until its final pH value was equal to 7.0. Moreover, appropriate amounts from EP, UA, and AC
Table 1. Parameters for Univariate calibration curves
Analyte λ max
LDR (µg mL-1)
Regression co-efficient (R2)
D.L (µg mL-1)
AC UA EP
243 292 283
1.5-12.1 1.7-16.8 1.8-35.3
0.997 0.998 0.999
1.2×10⁻²
4.5×10⁻³
2.0×10⁻²
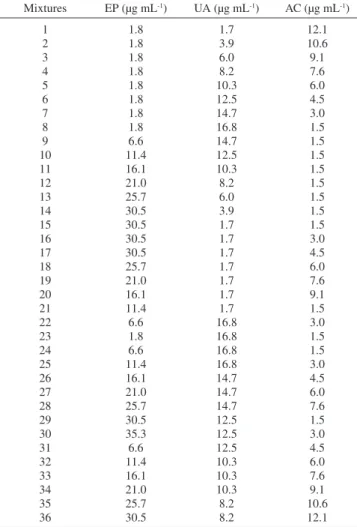
Table 2. Concentration data of mixtures that used in the calibration set for
the determination of EP, UA and AC
Mixtures EP (µg mL-1) UA (µg mL-1) AC (µg mL-1)
1 2 3 4 5 6 7 8 9 10 11 12 13 14 15 16 17 18 19 20 21 22 23 24 25 26 27 28 29 30 31 32 33 34 35 36
1.8 1.8 1.8 1.8 1.8 1.8 1.8 1.8 6.6 11.4 16.1 21.0 25.7 30.5 30.5 30.5 30.5 25.7 21.0 16.1 11.4 6.6 1.8 6.6 11.4 16.1 21.0 25.7 30.5 35.3 6.6 11.4 16.1 21.0 25.7 30.5
1.7 3.9 6.0 8.2 10.3 12.5 14.7 16.8 14.7 12.5 10.3 8.2 6.0 3.9 1.7 1.7 1.7 1.7 1.7 1.7 1.7 16.8 16.8 16.8 16.8 14.7 14.7 14.7 12.5 12.5 12.5 10.3 10.3 10.3 8.2 8.2
stock solutions were added to 0.5 mL of the final prepared urine, and the volume was made up to 10 mL. Electronic absorption spectrum of the solution was recorded in the range of 220–320 nm.
EP ampoule sample
The EP injection solution (specified content of EP is 1.0 mg mL−1)
was diluted to 250 mL by adding doubly distilled water. Different capacities of diluted solutions were transferred into a series of 10 mL volumetric flasks and diluted with a buffer solution.29 The
stan-dard addition method was used for analyzing the EP sample and the electronic absorption spectrum of the solution was recorded in the range of 220–320 nm.
Acetaminophen tablet sample
Ten tablets of AC were powdered by a mortar, and a weight equivalent to that of one tablet (0.5933 g) was dissolved in 50 mL of buffer solution. After 30 min of stirring and 15 min standing in the dark, the solutions were filtered in a 50 mL volumetric flask. Then, 1 mL of the solution was poured into a 25 mL volumetric flask and diluted with a buffer solution.30 The standard addition method was
used for analyzing the AC sample, and the electronic absorption spectrum of the solution was recorded in the range of 220-320 nm. RESULT AND DISCUSSION
Electronic absorption spectra
The electronic absorption spectra of EP, UA, and AC are sho-wn in Figure 1. Mixtures of EP, UA and AC are not feasible using conventional calibration procedure without prior separation because these compounds generate broad overlapping spectra. Therefore, multivariate calibration was conducted for ternary mixtures of EP, UA, and AC. Spectra were recorded in the region between 220 and 320 nm (1.0 nm steps) owing to overloading of the absorption values when there is a mixture of compounds and a low order of LDR. Note that the validation, artificial and unknown samples were analyzed using the same procedure.
Univariate estimation of linear dynamic range of analytes
Optimal measurement conditions were established for simulta-neous determination using the univariate method that estimates the
linear dynamic range of each analyte. Individual calibration curves, absorbance versus analyte concentration, were constructed with several points (and 3 replicates for each point). The linear regres-sion equation was A = 0.0633CAC − 0.005 (R
2 = 0.997) for the AC
calibration graph in the range of 1.5–12.1 µg mL−1, while the linear
regression equations were A = 0.042CUA − 0.025 (R
2 = 0.998) and
A = 0.015CEP − 0.0043 (R
2 = 0.999) for the concentration ranges of
1.7–16.8 (UA) and 1.8-35.3 µg mL−1 (EP), respectively.
Multivariate calibration and prediction
Multivariate calibration methods require a suitable experimental design for the standard calibration set to be a good predictor. In this study, the mixture design was used for experimental design and original PLS, and 1st and 2nd derivate PLS models were constructed
for calibration data sets. A calibration set included 36 calibration samples containing 1.8-35.3, 1.7-16.8, and 1.5-12.1 µg mL−1 of EP,
UA, and AC, respectively, (Table 2) and seven prepared mixtures were not consistent with the previous set were used as an independent test (Table 3). It is noted that the concentration of analytes in the calibration samples must be orthogonal to give the most informa-tion from the analytical system. The multivariate figures of merit (LOD, LOQ, and sensitivity) for three components were calculated using net analyte signal (NAS) calculation,31-33 and are shown in
Table 4.
Selection of the optimum number of factors for original PLS, 1st,
and 2nd derivate PLS
The correct number of loading vectors to be used for modeling the data was determined using a cross validation calculation for all the samples in the training set. It was performed to calculate the prediction residual error sum of squares (PRESS), which is defined in the following Equation (1).
(1)
where Ci is the reference concentration for the i
th sample and Ĉ i
represents the estimated concentration. One sample is eliminated at a time in the cross validation model. PLS calibration was performed on 35 calibration spectra, after which the concentration of the sample (not included in the calibration process) was evaluated. This process was repeated 36 times and each sample was not included in one of the calibration runs. The concentration of each sample was then predicted and compared with the known concentration of the three components in the reference sample.34 One reasonable choice for the
optimum number of factors would be the number that results in the minimum PRESS. Since there are a finite number of samples in the training set, in many cases, the minimum PRESS value causes over fitting for unknown samples that were not included in the model. A solution to this problem was suggested by Haaland et al. in which the PRESS values for all previous factors were compared with the PRESS value at the minimum.35
The F-statistical test can be used to determine the significance of PRESS values greater than the minimum. The maximum number of factors used to calculate the optimum PRESS were selected, and the optimum number of factors obtained by the PLS model on original and derivative data are summarized in Table 5. In all cases (PLS and derivatives), the number of optimum factors were selected according to PRESS values and their F-ratio probabilities using plots of PRESS vs. number of factors (these plots are not shown).
Statistical parameters
Generally, to evaluate the predictive ability of a multivariate Figure 1. Absorbance spectra of Epinephrine (12.0 mg L-1), Uric Acid (12.0
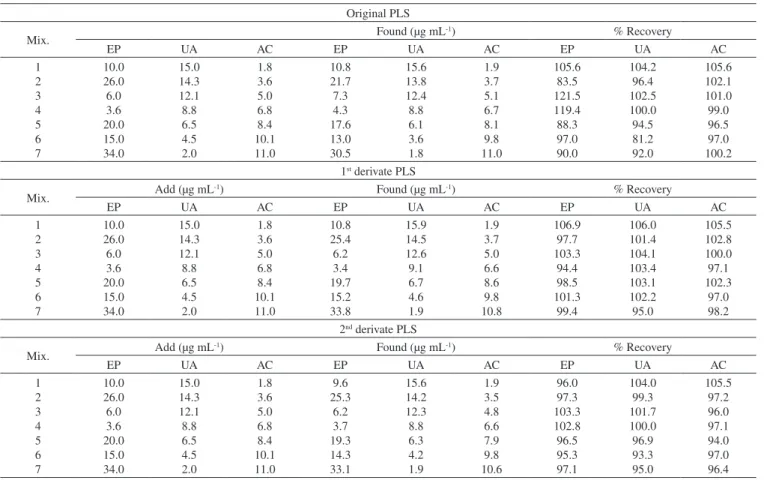
Table 3. Added and found results of the synthetic of EP, UA and AC
Original PLS
Mix. Found (µg mL
-1) % Recovery
EP UA AC EP UA AC EP UA AC
1 2 3 4 5 6 7 10.0 26.0 6.0 3.6 20.0 15.0 34.0 15.0 14.3 12.1 8.8 6.5 4.5 2.0 1.8 3.6 5.0 6.8 8.4 10.1 11.0 10.8 21.7 7.3 4.3 17.6 13.0 30.5 15.6 13.8 12.4 8.8 6.1 3.6 1.8 1.9 3.7 5.1 6.7 8.1 9.8 11.0 105.6 83.5 121.5 119.4 88.3 97.0 90.0 104.2 96.4 102.5 100.0 94.5 81.2 92.0 105.6 102.1 101.0 99.0 96.5 97.0 100.2 1st derivate PLS
Mix. Add (µg mL
-1) Found (µg mL-1) % Recovery
EP UA AC EP UA AC EP UA AC
1 2 3 4 5 6 7 10.0 26.0 6.0 3.6 20.0 15.0 34.0 15.0 14.3 12.1 8.8 6.5 4.5 2.0 1.8 3.6 5.0 6.8 8.4 10.1 11.0 10.8 25.4 6.2 3.4 19.7 15.2 33.8 15.9 14.5 12.6 9.1 6.7 4.6 1.9 1.9 3.7 5.0 6.6 8.6 9.8 10.8 106.9 97.7 103.3 94.4 98.5 101.3 99.4 106.0 101.4 104.1 103.4 103.1 102.2 95.0 105.5 102.8 100.0 97.1 102.3 97.0 98.2 2nd derivate PLS
Mix. Add (µg mL
-1) Found (µg mL-1) % Recovery
EP UA AC EP UA AC EP UA AC
1 2 3 4 5 6 7 10.0 26.0 6.0 3.6 20.0 15.0 34.0 15.0 14.3 12.1 8.8 6.5 4.5 2.0 1.8 3.6 5.0 6.8 8.4 10.1 11.0 9.6 25.3 6.2 3.7 19.3 14.3 33.1 15.6 14.2 12.3 8.8 6.3 4.2 1.9 1.9 3.5 4.8 6.6 7.9 9.8 10.6 96.0 97.3 103.3 102.8 96.5 95.3 97.1 104.0 99.3 101.7 100.0 96.9 93.3 95.0 105.5 97.2 96.0 97.1 94.0 97.0 96.4
Table 4. Multivariate figures of merit† for AC, UA and EP
Analyte SEN (µg mL−1) LOD (µg mL−1) LOQ (µg mL−1)
AC UA EP 0.187 0.051 0.015 0.064 0.235 0.780 0.214 0.783 2.599
† SEN (sensitivity), LOD (limit of detection), LOQ (limit of quantitation)
Table 5. Statistical parameters of the optimized models based on PLS and
its derivatives
Method Analyte NPC PRESS RMSEP %RSEP
PLS EP UA AC 4.0 6.0 8.0 1.08 2.99 4.44 0.39 0.65 0.25 5.45 6.45 1.46
1st derivate
EP UA AC 5.0 5.0 7.0 4.56 1.45 9.48 0.81 0.46 0.37 12.10 4.34 2.31
2nd derivate
EP UA AC 6.0 4.0 5.0 3.54 1.34 5.93 0.71 0.44 0.29 10.50 4.28 1.76
calibration model, the root mean square error of prediction (RMSEP) and relative standard error of prediction (%RSEP) are used.
(2)
(3)
where Cpred is the predicted concentration in the sample, Cobs is the
observed value of the concentration in the sample, and n is the number of samples in the validation set. The RMSEP and RSEP% values calculated for three components by original PLS, 1st, and 2nd derivate
PLS methods are given in Table 5, which is the criterion of accuracy using actual (true) and predicted values, and the smallest values indicated better models. The comparison of the results obtained for original PLS, 1st, and 2nd derivate PLS models indicated that PRESS
values for three components, especially EP, used in all models were close to each other; however, the 2nd derivate PLS was simpler than
original PLS and 1st derivate PLS because of lower number of latent
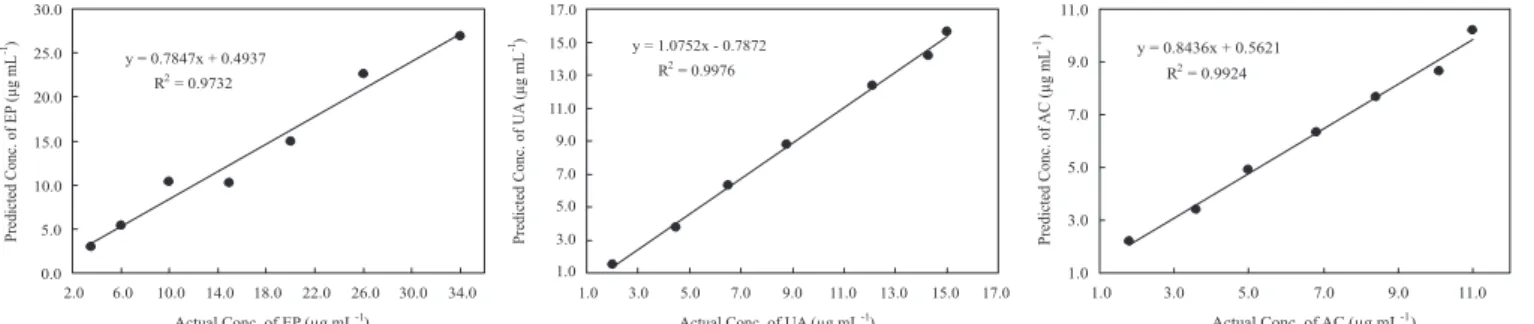
variables (especially for UA and EP). Plots of predicted concentration versus actual concentration for EP, UA, and AC by 2nd derivate PLS
are shown in Figure 2. The correlation coefficients obtained for the 2nd derivate model was better than the original PLS and 1st derivate
models. Thus, 2nd derivate PLS presents better prediction abilities
when compared with other models. Applications
Determination of EP, UA, and AC spiked in real samples
The three proposed methods were applied for the simultaneous determination of three analytes in real samples. Predicted values and recovery percentage obtained by 2nd derivate models for EP, UA, and
AC in real samples are shown in Table 6. Recovery was quantified and no significant differences were observed between the amounts obtained from this method and the labeled amounts.
Analysis of pharmaceutical formulations
Two commercial pharmaceutical formulations were analyzed by original PLS, 1st, and 2nd derivate PLS, which are shown in Table 7,
Table 6. Recoveries of EP, UA and AC in spiked real samples by 2nd derivate PLS
Urine samples Added (µg mL-1) Found (µg mL-1) %Recovery
Mixtures EP UA AC EP UA AC EP UA AC
U1 U2 U3 U4 U5
32.0 25.0 18.0 9.0 2.5
15.4 1.5 11.1
3.2 9.4
1.6 2.3 6.1 9.2 11.8
32.7 25.2 17.8 9.0 2.5
15.4 1.5 11.1
3.2 9.5
1.6 2.3 6.0 9.4 11.6
102.2 100.8 98.7 100.3
99.7
99.8 100.6
99.8 99.3 101.3
102.9 99.2 98.5 102.2
98.4
Serum samples Added (µg mL-1) Found (µg mL-1) %Recovery
Mixtures EP UA AC EP UA AC EP UA AC
S1 S2 S3 S4 S5
32.0 25.0 18.0 9.0 2.5
15.4 1.5 11.1
3.2 9.4
1.6 2.3 6.1 9.2 11.8
32.2 25.7 18.3 9.0 2.5
15.3 1.5 11.2
3.2 9.5
1.6 2.3 6.0 9.3 11.6
100.7 102.6 101.6 100.1 100.8
99.3 102.5 100.7 101.2 100.7
101.5 101.4 99.0 100.9 98.6 Plasma samples Added (µg mL-1) Found (µg mL-1) %Recovery
Mixtures EP UA AC EP UA AC EP UA AC
P1 P2 P3 P4 P5
32.0 25.0 18.0 9.0 2.5
15.4 1.5 11.1
3.2 9.4
1.6 2.3 6.1 9.2 11.8
32.0 25.3 18.0 9.2 2.5
15.2 1.5 11.1
3.2 9.2
1.6 2.4 6.2 9.4 11.6
100.1 101.0 99.8 102.6 100.1
98.6 98.3 100.3
98.9 98.0
100.5 103.0 101.6 102.2 98.5 Figure 2. Plots of predicted concentration vs. actual concentration of EP, UA and AC by 2nd derivate PLS
Table 7. Application of optimized models on the pharmaceuticals
EP ampoule Add (µg mL-1) Found (µg mL
-1) %Recovery ± % RSD
Original PLS 1st derivate 2nd derivate Original PLS 1st derivate 2nd derivate
1 2 3 4
3.0 10.5 26.6 32.4
2.9 10.2 25.8 31.5
2.8 10.0 28.0 30.5
2.98 10.8 26.4 31.8
96.7±1.2 97.1±4.2 97.0±0.7 97.2±3.9
99.0±1.7 94.6±4.8 105.2±1.8
94.0±1.2
99.4±1.5 102.9±1.7
99.2±3.4 98.1±2.7 AC tablet Add (µg mL-1) Found (µg mL
-1) %Recovery ± % RSD
Original PLS 1st derivate 2nd derivate Original PLS 1st derivate 2nd derivate
1 2 3 4
2.3 5.4 8.1 10.5
2.2 5.3 7.9 10.4
2.5 5.1 8.4 10.1
2.29 5.2 8.2 10.3
95.3±5.1 98.1±4.0 98.2±3.2 99.3±3.7
106.6±6.2 94.0±1.1 104.3±5.1
96.6±2.1
99.4±2.9 97.0±3.4 101.5±3.6
98.0±4.1
PLS was a better predictor of real samples than the original PLS and 1st derivate methods, as illustrated by comparison of relative standard
deviation and recovery percentage for the three methods. Four replica-te measurements were used to replica-test the precision of the methods. The better R.S.D. values and recoveries were obtained with acceptable error for all assayed samples with 2nd derivate PLS. Consequently, 2nd
derivate PLS performs better than other methods because the second derivate PLS method can improve the signal-to-noise ratio. CONCLUSIONS
This research indicates that the 2nd derivate PLS is the best model
for the simultaneous determination of ternary mixtures of EP, UA, and AC that cannot be resolved by ordinary spectrophotometric
methods. Ensuring methods are simple and precise, and they do not need prior concentration or extraction steps to prevent the loss of analytes. Furthermore, the method was successfully applied to the determination of analytes in real and pharmaceutical samples with excellent sensitivity and without the need for elaborate and tedious sample preparation steps. Satisfactory results demonstrate the utility of these procedures for the simultaneous determination of EP, UA, and AC in serum, plasma, and urine from patients using these medicines.
ACKNOWLEDGEMENTS
REFERENCES
1. Shen, T.; Wang, J. Y.; Zhao, B. D.; Biochemistry, Higher Education Press: Beijing, 1986.
2. Xue, Q. M.; Physiological and Pathological Chemistry of Nervous System, Science Press: Beijing, 1978, p. 102.
3. Cooper, J. R.; Bloom, F. E.; Roth, R. H.; The Biochemical Basis of Neuropharmacology. Oxford University Press: Oxford, 1982. 4. Cannon, W. B.; Am. J. Physiol. 1929, 89, 84.
5. Moraes, F. C.; Golinelli, Diego L. C.; Mascaro, Lucia H.; Machado, Sergio A. S.; Sens. Actuators, B2010, 148, 492.
6. Baillie, J. K.; Bates, M. G.; Thompson, A. A.; Wang, W. S.; Partridge, R. W.; Schnopp, M. F.; Simpson, A.; Galliver-Slaon, F.; Maxwell, S. R.; Webb, D. J.; Chest. 2007, 131, 1473.
7. Maxwell, S. R. J.; Thompson, H.; Sandler, D.; Leguen, C.; Baxter, M. A.; Thorpe, G. H. G.; Jones, A. F.; Barnett, A. H.; Eur. J. Clin. Invest.
1997, 27, 484.
8. Vitart, V.; Rudan, I.; Heyward, C.; Gray, N. K.; Floyd, J.; Palmer, C. N. A.; Knott, S. A.; Kolcic, I.; Polasek, O.; Graessler, J.; Wilson, J. F.; Marinaki, A.; Riches, P.; Shu, X.; Janicijevic, B.; Smolej-Narancic, N.; Gorgoni, B.; Morgan, J.; Campbell, S.; Biloglav, Z.; Barac-Lauc, L.; Pericic, M.; Klaric, I. M.; Zgaga, L.; Skaric-Juric, T.; Wild, S. H.; Richardson, W. A.; Hohenstein, P.; Kimber, C. H.; Tenesa, A.; Donnelly, L. A.; Fairbanks, L. D.; Aringer, M.; McKeigue, P. M.; Ralston, S. H.; Morris, A. D.; Rudan, P.; Hastie, N. D.; Campbell, H.; Wright, A. F.; Nat. Genet. 2008, 40, 437.
9. Miland, E.; Ordieres, A. J. M.; Blanco, P. T.; Smyth, M. R.; Fagain, C. O.; Talanta. 1996, 43, 785.
10. Shi, K.; Shiu, K. K.; Electroanal. 2001, 13, 1319.
11. Luo, Y. C.; Do, J. S.; Liu, C. C.; Biosens. Bioelectron. 2006, 22, 482. 12. Dryhurst, G.; Electrochemistry of biological molecules, Academic Press:
New York, 1977.
13. Haper, H.; A review of physiological chemistry, Lange Medical: Los Altos, 1977.
14. Jacobs, D. S.; Demott, W. R.; Grady, H. J.; Horvat, R. T.; Huestis, D. W.; Kaster, B. L.; Laboratory Test Handbook, Lexi-Comp: New York, 1996. 15. Ameer, B.; Greenblatt, D. J.; Ann. Intern. Med.1997, 87, 202. 16. Barker, J. D.; Decarle, D. J.; Anuras, S.; Ann. Intern. Med.1977, 87,
299.
17. Black, M.; Gastroenterology1980, 78, 382. 18. Koch-Weser, J.; New Engl. J. Med. 1976, 295, 1297. 19. Haaland, D. M.; Thomas, E. V.; Anal. Chem. 1988, 60, 1193. 20. Fang, G. Z.; Liu, N.; Anal. Chim. Acta2001, 445, 245.
21. Cámara, M. S.; Mastandrea, C.; Goicoechea, H. C.; J. Biochem. Biophys. Methods2005, 64, 153.
22. Culzoni, M. J.; De Zan, M. M.; Robles, J. C.; J. Pharm. Biomed. Anal.
2005, 39, 1068.
23. Nagaraj, V. K.; Rajshree, M.; Anal. Sci. 2007, 23, 445.
24. Pizarro, C.; Esteban-Díez, I.; Nistal, A. J.; Ganzález-Sáiz, J. M.; Anal. Chim. Acta2004, 509, 217.
25. de Moura, J. I.; Moita, G. C.; Quim. Nova 2012, 35, 627.
26. Webster, R.; Jordan, C.; Neurotransmitters Drugs and Disease, Black-well: Oxford, 1989.
27. Goicoechea, H. C.; Olivieri, A. C.; Munoz de La pena, A.; Anal. Chim. Acta1999, 384, 95.
28. Thongboonkerd, V.; Songtawee, N.; Kanalaya, R.; Chutipongtanate, S.; Anal. Bioanal. Chem. 2006, 384, 964.
29. Beitollahi, H.; Mazloum Ardakani, M.; Ganjipour, B.; Naeimi, H.; Bio-sens. Bioelectron. 2008, 24, 362.
30. Samadi-Maybodi, A.; Hassani Nejad-Darzi, S. K.; Spectrochim. Acta A.
2010, 75, 1270.
31. Hemmateenejad, B.; Yousefinejad, S.; Anal. Bioanal. Chem.2009, 394, 1965.
32. Yousefinejad, S.; Hemmateenejad, B.; Drug Test. Anal. 2012, 4, 507. 33. Lorber, A.; Anal. Chem.1986, 58, 1167.
34. Kaur, K.; Malik, A. K.; Singh, B.; Godarzi, M.; Thai J. Pharm. Sci.
2009, 33, 123.