Perceived health in the
Portuguese population aged
≥
35
Perceção de saúde na população
portuguesa
≥
35 anos
I Departamento de Ciências Complementares.
Escola Superior de Tecnologia da Saúde de Coimbra. Coimbra, Portugal
II Instituto de Higiene e Medicina Social.
Faculdade de Medicina. Universidade de Coimbra. Coimbra, Portugal
Correspondence: João Paulo de Figueiredo
Rua 5 de Outubro, São Martinho do Bispo 3046-854 Coimbra, Portugal
E-mail: jpigueiredo@estescoimbra.pt
Received: 11/14/2013 Approved: 2/26/2014
Article available from: www.scielo.br/rsp
ABSTRACT
OBJECTIVE:
To evaluate the exploratory relationship between determinants
of health, life satisfaction, locus of control, attitudes and behaviors and health
related quality of life in an adult population.
METHODS:
Observational study (analytical and cross-sectional) with a
quantitative methodological basis. The sample was composed oy 1,214
inhabitants aged ≥ 35 in 31 civil parishes in the County of Coimbra, Portugal,
2011-2012. An anonymous and voluntary health survey was conducted,
which collected the following information: demographic, clinical record,
health and lifestyle behaviors; health related quality of life (Medical
Outcomes Study, Short Form-36); health locus of control; survey of health
attitudes and behavior, and quality of life index. Pearson’s Linear Correlation,
t-Student, Wilcoxon-Mann-Whitney; One-way ANOVA; Brown-Forsythe’s
F; Kruskal-Wallis; Multiple Comparisons: Tukey (HSD), Games-Howell and
Conover were used in the statistical analysis.
RESULTS: Health related quality of life was shown to be lower in females,
in older age groups, in obese/overweight individuals, widows, unassisted,
those living alone, living in rural/suburban areas, those who did not work
and with a medium-low socioeconomic level. Respondents with poor/very
poor self-perceived health (p < 0.0001), with chronic disease (p < 0.0001),
who consumed < 3 meals per day (p ≤ 0.01), who were sedentary, who
slept ≤ 6 h/day and had smoked for several years revealed the worst health
results. Health related quality of life was positively related with a bigger
internal locus, with better health attitudes and behaviors (physical exercise,
health and nutritional care, length of dependence) and with different areas
of life satisfaction.
CONCLUSIONS:
Better health related quality of life was associated with
certain social, psychological, family and health characteristics, a satisfactory
lifestyle, better socioeconomic conditions and a good internal locus of control
over health attitudes and behaviors.
DESCRIPTORS:
Health Status. Diagnostic Self Evaluation. Lifestyle.
Health Behavior. Quality of Life Health Knowledge, Attitudes,
Practice. Cross-Sectional Studies.
João Paulo de Figueiredo
ISociety today is undergoing constant transformation
(economic, political and social) and every day
indi-viduals are exposed to determinants that can inluence
their well-being, health and quality of life. It’s neces
-sary to invest in health promotion in order to reduce
the effects of certain factors responsible for morbidity
and mortality.
11,15Health and disease determinants are
developments or events that produce health
altera-tions in a speciic clinical situation. In the life cycle of
populations, there has always been a constant seeking
after health and well-being, to the detriment of disease.
However, there are intrinsic (biological personal, immu
-nological and genetic) factors which determine the
individual’s susceptibility to contracting disease, and
RESUMO
OBJETIVO:
Analisar a relação entre determinantes de saúde, satisfação com
a vida, locus de controlo, atitudes e comportamentos com a qualidade de vida
relacionada à saúde numa população adulta.
MÉTODOS:
Estudo observacional (analítico-transversal) com base metodológica
quantitativa. A amostra foi de 1.214 habitantes ≥ 35 anos de 31 freguesias do
Concelho de Coimbra, Portugal, 2011-2012. Foi realizado inquérito de saúde
anónimo e voluntário com as seguintes informações: demográica, inventário
clínico, comportamentos de saúde e estilos de vida; qualidade de vida relacionada
à saúde (
Medical Outcomes Study, Short Form
-36); locus de controlo da saúde;
questionário de atitudes e comportamentos de saúde e índice de qualidade de vida.
Para análise estatística foram utilizados os métodos: Correlação Linear de Pearson;
t-Student; Wilcoxon-Mann-Whitney; ANOVA a um Fator; F de Brown-Forsythe;
Kruskal-Wallis; Comparações Múltiplas: Tukey HSD, Games-Howell e Conover.
RESULTADOS:
A qualidade de vida relacionada à saúde esteve diminuída no
sexo feminino, nos grupos etários mais avançados, nos indivíduos com excesso
de peso/obesidade, baixas habilitações, viúvos, sozinhos, residentes no meio
rural/suburbano, inativos proissionalmente e estatuto socioeconómico médio
baixo. Expressaram piores indices de saúde: os inquiridos com autoperceção
de saúde de mau/muito mau (p < 0,0001), na presença de doença crónica, a
sua frequência (p < 0,0001), que consumiam < 3 refeições diárias (p ≤ 0,01),
os sedentários, os que dormiam ≤ 6 h/dia; e os com maior número de anos
de tabagismo. A qualidade de vida relacionada à saúde esteve positivamente
associada com maior locus de controlo interno, melhores atitudes e
comportamentos de saúde (atividade física, cuidados alimentares e de saúde,
duração da dependência) e com diferentes áreas de satisfação com a vida.
CONCLUSÕES: Determinadas características sociais e psicológicas, familiares
e de saúde, estilos de vida adequados, melhores condições socioeconómicas,
bom locus de controlo interno sobre a saúde e atitudes e comportamentos
evidenciaram melhor qualidade de vida relacionada à saúde.
DESCRITORES:
Nível de Saúde. Autoavaliação Diagnóstica. Estilo de
Vida. Comportamentos Saudáveis. Qualidade de Vida. Conhecimentos,
Atitudes e Prática em Saúde. Estudos Transversais.
INTRODUCTION
extrinsic factors (environmental, behavioral, physical
and social habits, among others) that compete to expose
the individual to it.
11Health related quality of life (HRQL) is a generic indi
-cator of the state of health, integrating physical,
psycho-logical and social components. It enables the state of
health to be characterized and predicted, relating it to
different indicators.
6Evaluating HRQL goes beyond an
objective medical clinical evaluation. It emphasizes the
individual’s subjective perception of their own health.
It is becoming increasingly common to evaluate
indi-viduals’ health behavior and control (locus of control)
21health.
12The greater the individual’s level of personal
control and capacity to decide about their own health
(internal locus), the greater their satisfaction with
HRQL. This condition will be inversely proportional
to health related developments depending on “luck” or
“powerful others” (external locus).
25Quality of life as
an indicator of satisfaction with life seeks to understand
how certain areas of life, valued by the individual, can
inluence the conditions of their health.
3The aim of this study was to analyze the relationship
between health determinants, satisfaction with life,
the locus of control and health related attitudes and
behavior in an adult population.
METHODS
This was an observational study, of a cross-sectional
analytical nature, with a population aged ≥ 35 in the
County of Coimbra, totaling 143,396 residents in
31 parishes.
aThe selection strategy was incomplete
(sample) and the observation unit was the individuals.
The test for stratiied samples
16was used,
control-ling the population parameter of “perceived state of
health” (
), total number of residents of the County
(
N
),
atotal number of residents per stratum (parish) (
w
i
)
awith random error of (
d
2/Z
2= 0.05) and a 95% level of
conidence. The inal sample was 1,214 interviewees.
The study was based on collecting data using a health
survey (self-reporting, anonymous and voluntary).
The survey used was adapted from the IV
Inquérito
Nacional de Saúde
b(IV National Health Survey), the
result of various pre-tests with the population. The
responses to the respective pre-tests led to some
ques-tions, words and terms being reformulated, the format
being altered, redundant content eliminated and the
topics being reorganized. A team of interviewers was
trained to administer the questionnaire to the
popu-lation. The survey included health indicators
(demo-graphic data, clinical inventory, health and lifestyle
behavior) and indices seeking to capture, measure and
qualify the state of health.
Perceived state of health on the MOS SF-36 Medical
Outcomes Study, Short Form-36, Health Survey
4,5,ais
described in eight health dimensions: Physical health
measures (PHM), which include: physical functioning,
physical performance and pain, which measure the
limi-tations in performing activities of daily living,
inca-pacity to execute everyday tasks due to physical
prob-lems and evaluate the severity of pain and resulting
limitations;
4Mental health measures
(MHM) including:
social functioning, emotional performance and mental
health. Social functioning and emotional performance
evaluated perceived limitations/disabilities attributable
to personal and emotional problems; mental health
included anxiety, depression, loss of
emotional/behav-ioral control and psychological well-being;
4Sensitive
measures and physical and mental results included:
individual’s vitality associated to energy levels and
fatigue and general health with regards a holistic
perception of health associated with current situation,
resistance to disease and healthy aspect. Regarding the
score (for each dimension): the “0” minimum value
(worst perception) and the “100” maximum value (best
perception of health).
The health locus of control was constructed, adapted
and validated for Portuguese.
20The scale was
struc-tured of 14 items, resulting in two dimensions: locus
of control and powerful others. The highest score
in the locus control dimension corresponded to the
premise that health largely depends on our own
control. The highest score for powerful others
indi-cated that health is controlled by doctors and other
health care professionals.
20To conirm the author’s
decisions regarding validation, factorial analysis
was used to analyze the principal components. This
solution produced two components (dimensions)
estimated using the Orthogonal Varimax Rotation:
the irst dimension explained 24.3% of the total vari
-ance; the second explained 17.2% of total variance
(41.5% of common variance). Of the 14 items, eight
belonged to the irst dimension (locus of control) and
six to the second (powerful others). In the evaluation
of internal consistency, the Cronbach’s alpha statis
-tics were 0.763 for the irst dimension and 0.697 for
the second.
The Health Attitudes and Behavior Questionnaire
(HABQ), adapted and validated for Portuguese (list
of classiication containing 28 items), summarizes
behavior related to health and disease.
21Final classii
-cation varies between 28 and 140 points and the higher
the score the greater the health protective behavior. The
inventory in made up of ive categories: physical exer
-cise (pe); 2) nutrition (n); 3) self-care (sc); 4) motor
safety; 5) drug or substance use.
21This is not a scale but
rather an inventory and does not assume a close
rela-tionship between the items. However, Pais Ribeiro
20suggested estimating internal consistency. In the
phys-ical exercise category (three items with Cronbach’s
Alpha of 0.683); nutrition (ive items with Cronbach’s
Alpha of 0.784); AC (11 items with Cronbach’s Alpha
of 0.643); motor safety (three items with Cronbach’s
Alpha of 0.447); drug or substance use (six items with
Cronbach’s Alpha of 0.512). The Cronbach’s Alpha
values estimated in the study were slightly higher than
those obtained by Pais Ribeiro.
21The quality of life index, geriatric version (III), is
formed of 33 items (common to all validated versions
and adapted for Portuguese) forming four domains:
health and functionality; psychological and spiritual;
and social, economic and family.
14Factorial analysis
was used to analyze the principal components using
the Orthogonal Varimax Rotation to validate the four
dimensions. The irst dimension explained 24.3% of
total variance; the second 8.0%, the third 4.7% and the
fourth 4.2% (58.3% of common variance). Regarding
internal consistency: health and functionality (13 items
with Cronbach’s Alpha of 0.901); spiritual and psycho
-logical (seven items with Cronbach’s Alpha of 0.894);
social and economic (eight items with Cronbach’s
Alpha of 0.832); family (ive items with Cronbach’s
Alpha of 0.835). Items with higher values had a greater
impact on the result (satisfaction with different areas of
life) than those with lower values.
3,14The instruments
were chosen for their precision, conciseness and ease
of use and evaluation.
24Anthropometric data such as height (m) (according
to the identity document); weight (kg) (according to
the subject’s perception, referring to the most recent
time they weighed themselves and maintaining the
same physical condition; body mass index (BMI)
c(underweight: < 18.50 kg/m
2, normal weight: 18.50
kg/m
2to 24.99 kg/m
2, overweight: 25.00 kg/m
2to
29.99 kg/m
2, obese: ≥ 30.00 kg/m
2); waist and neck
circumference measured using a tape measure. For
men, risk of obesity according to waist circumference
was ≤ 102 cm, normal risk and > 102 cm high risk,
and for women ≤ 88 cm was normal risk and > 88 cm
high risk.
13Chronic disease identiied
bwere re-grouped
according the 10
threvision of the International
Classiication of Disease (ICD).
Re-codified variables were: parishes classified as
predominantly rural areas; predominantly urban
areas and moderately urban areas.
dProfession was
deined according to the Portuguese Classiication of
Profession
eand social class (adapted Graffer Scale) was
deined as class I (high), class II (upper middle), class
III (middle), class IV (lower middle) and class V (low).
The following tests were used: the Student-t test for
independent samples; the Wilcoxon-Mann-Whitney
Test; the ANOVA test for one factor; the
Brown-Forsythe F Test; the Tukey Multiple Comparisons
Test; the Kruskal-Wallis Test; the Conover Multiple
Comparisons Test and Pearson’s Coeficient of Linear
Correlation. When r < 0.2, correlation was very low;
[0.2
−
0.39] low correlation; [0.4
−
0.69] moderate
correlation; [0.70
−
0.89] high correlation; [0.9
−
1.0]
very high correlation.
24The statistical interpretation
was conducted based on a level of signiicance of p ≤
0.05 with a 95% conidence interval.
IBM SPSS Statistics and MedCalc Statistical Software
was used.
The study was approved by the Ethics Commission
of the
Faculdade de Medicina da Universidade de
Coimbra
(Record 04-CE-09, 2009). Participants signed
an informed consent form.
RESULTS
The majority of inhabitants in the study were female
and lived in parishes classiied as predominantly
urban; 40.3% were aged 35-45 and 31.5% 45-55
years old; 25.0% had higher education and 23.2%
secondary education. The majority of interviewees
were Portuguese, Caucasian, married or in a stable
relationship, cohabited, had religious beliefs but were
not practicing, owned their own home and were middle
class. With regards profession, 76.6% were working,
of whom 87.5% had a permanent contract. The average
length of retirement was 10 years (SD = 7.48 years)
and unemployment of two years (SD = 3.39 years).
Around 47.1% classiied their health as “good” and
38.2% as “reasonable”; 78.1% considered it approx
-imately the same as one year before. Mean height
and weight were 1.65 m (SD = 0.08 m) and 71.65 kg
(SD = 12.83 kg). Mean waist and neck circumfer
-ence were 90.93 cm (SD = 15.50 cm) and 36.96 cm
(SD = 5.51 cm), respectively.
The majority was overweight or obese and used
the health center or hospital for health care; 61.2%
reported that they had not been to a doctor in the
preceding three months. The location of the most
recent appointment was the health center (62.0%)
or the GP (72.1%). The majority had consulted a
health care professional or received health care in the
preceding 12 months. The majority reported being in
the habit of controlling arterial tension and cholesterol
and 25.5% had had a lu vaccination.
Those who smoked, 20.8%, had been smoking for 25.6
years, on average (SD = 9.14 years) and ex-smokers
for 20.0 (SD = 11.0 years); 43.4% said they had
regularly or occasionally drunk alcohol for 31.5
years (SD = 11.97 years). The majority was seden
-tary, slept between seven and eight hours/day, had a
Mediterranean diet, had between three and ive meals
a day, never changed their eating habits, drank less
than one liter of water/day and worked a 35-40 hour
c World Health Organization. Global Database on Body Mass Index: an interactive surveillance tool for monitoring nutrition transition.
Geneva; 2006 [cited 2013 May]. Available from: http://apps.who.int/bmi/index.jsp?introPage=intro_3.htm
d Portugal. Secção Permanente de Coordenação Estatística. 8ª Deliberação 2717/2009, de 6 de Agosto de 2009. Revisão da tipologia de áreas
urbanas. Diario da Republica, 2ª Serie, n. 188, 28 set 2009; p.39246.
week; 34.1% spent their working day “standing and
walking, also walking up stairs and lifting objects”,
32.1% spend most of their time “sitting down”.
The most representative group from the Portuguese
Classiication of Profession was “services” (19.9%),
a group that includes salesmen and those who work
in personal services, care and similar areas, those who
work in protection/security an “unqualiied” indi
-viduals (18.4%) encompassing those who worked
as cleaners, agricultural workers, animal, forest and
ishery workers, extraction industries, construction,
industry and transport, among others. Of the 38.6%
of individuals who reported having chronic disease,
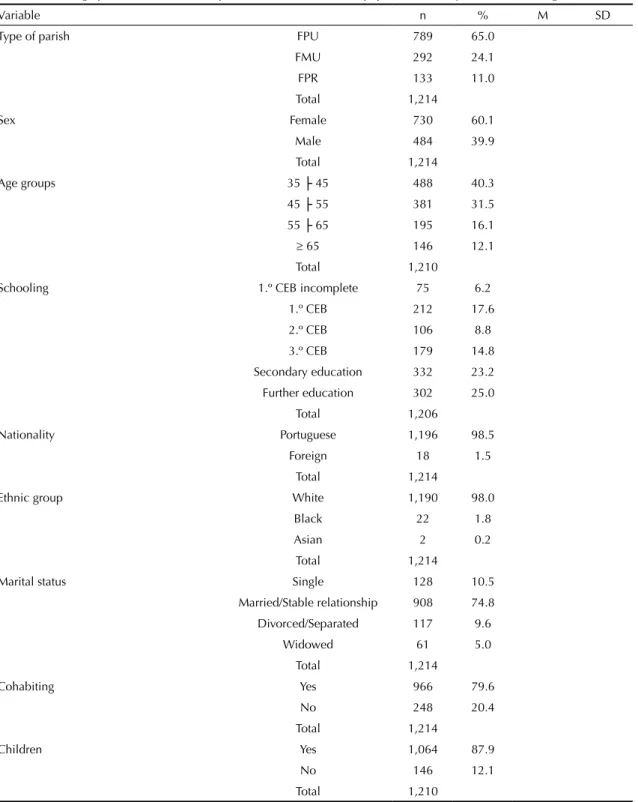
70.9% had one or two (Table 1).
Table 1. Socio-biographical characterization, proile and health care of the population. County of Coimbra, Portugal, 2011-2012.
Variable n % M SD
Type of parish FPU 789 65.0
FMU 292 24.1
FPR 133 11.0
Total 1,214
Sex Female 730 60.1
Male 484 39.9
Total 1,214
Age groups 35 ├ 45 488 40.3
45 ├ 55 381 31.5
55 ├ 65 195 16.1
≥ 65 146 12.1
Total 1,210
Schooling 1.º CEB incomplete 75 6.2
1.º CEB 212 17.6
2.º CEB 106 8.8
3.º CEB 179 14.8
Secondary education 332 23.2 Further education 302 25.0
Total 1,206
Nationality Portuguese 1,196 98.5
Foreign 18 1.5
Total 1,214
Ethnic group White 1,190 98.0
Black 22 1.8
Asian 2 0.2
Total 1,214
Marital status Single 128 10.5
Married/Stable relationship 908 74.8
Divorced/Separated 117 9.6
Widowed 61 5.0
Total 1,214
Cohabiting Yes 966 79.6
No 248 20.4
Total 1,214
Children Yes 1,064 87.9
No 146 12.1
Total 1,210
Continuation
Number of children 1 401 38.0
2 502 47.6
≥ 3 152 14.4
Total 1,055
Religion Yes 1,095 90.4
No 117 9.7
Total 1,212
If religious Practicing 384 36.2
Non-practicing 678 63.8
Total 1,062
Current residence status Homeowner 907 75.7
Mortgaged 291 24.3
Total 1,198
Type of residence House 700 59.4
Apartment 479 40.6
Total 1,179
Professional situation Active 930 76.6
Non-active 284 23.4
Total 1,214
Type of contract Permanent 802 87.6
Temporary 114 12.4
Total 916
Social class Class I 100 12.1
Class II 247 29.7
Class III 421 50.6
Class IV 64 7.7
Total 832
Retired Length (years) 9.8 7.5
Unemployed Length (years) 2.3 3.4
Self-perceived general state of health Very good 103 8.9
Good 543 47.1
Reasonable 441 38.2
Poor/Very poor 54 4.7
No opinion 12 1.0
Total 1,153
Describe your current state of general health compared with one year agoa
Much better 19 1.6
Some improvement 74 6.1
Approximately the same 946 78.1
A little worse 160 13.2
Much worse 13 1.1
Total 1,212
Anthropometric data Height (m) 1,169 1.65 0.1
Weight (kg) 1,160 71.7 12.8
BMI (kg/m2) 1,159 26.2 3.8
PC (cm) 901 90.9 15.5
Neck circumference (cm) 884 37.0 5.5
Continuation
Body mass index Underweight 4 0.3
Normal weight 458 39.5
Overweight 526 45.4
Obese 171 14.8
Total 1,159
Health centera Yes 959 84.8
No 172 15.2
Total 1,131
Hospitala Yes 564 49.9
No 567 50.1
Total 1,131
Private health carea Yes 196 17.3
No 935 82.7
Total 1,131
Othera Yes 5 0.4
No 1,126 99.6
Total 1,131
Visit doctor ≤ 3 months Yes 471 38.8
No 743 61.2
Total 1,214
Type of consultation GP 835 72.1
Specialty 323 27.9
Yes 1,158
Sick leaveb Yes 14 1.2
No 1,136 98.8
Total 1,150
Feeling illb Yes 267 22.0
No 947 78.0
Total 1,214
Requested prescription or testsb Yes 184 15.2
No 1,030 84.8
Total 1,214
Other reasonb Yes 740 61.0
No 474 39.0
Total 1,214
Visit dentist... Yes 1,115 91.8
No 99 8.2
Total 1,214
Consulted dentist ≤ 12 months Yes 736 66.2
No 375 33.8
Total 1,111
Flu vaccination Yes 310 25.5
No 875 72.1
Don’t remember 29 2.4
Total 1,214
Measured blood pressure Yes 898 75.5
No 283 23.8
Don’t remember 8 0.7
Total 1,189
Continuation
Cholesterol Yes 681 57.8
No 484 41.1
Don’t remember 14 1.2
Total 1,179
Smoking Smoker 250 20.8
Ex-smoker 173 14.4
Non smoker 780 64.8
Total 1,203
Length of habit Smoker 25.6 9.1
Ex-smoker 20.0 10.3
Started smoking (age) Smoker 17.5 4.6
Ex-smoker 17.4 4.7
Alcohol intake Yes 522 43.4
No 646 53.7
Ex-consumer 34 2.8
Total 1,202
Alcohol intake (years) Consumer 31.5 12.0
Ex-consumer 21.8 16.5
Age started drinking Consumer 18.0 3.8
Ex-consumer 19.1 7.7
Physical exercise Yes 332 27.7
No 866 72.3
Total 1,198
Hours of sleep per night < 7 285 24.0
7 to 8 797 67.2
> 8 104 8.8
Total 1,186
Hours worked per week < 35 49 5.4
35 to 40 612 67.4
> 40 247 27.2
Total 908
Type of work a_1) Option 294 32.1
b_2) Option 250 27.3
c_3) Option 312 34.1
d_4) Option 37 4.0
e_5) Option 22 2.4
Total 915
Portuguese classiication of professions (PCP) a_ 49 5.7
b_ 135 15.7
c_ 103 12.0
d_ 125 14.5
e_ 172 20.0
f_ 9 1.0
g_ 87 10.1
h_ 23 2.7
i_ 159 18.5
Total 862
Continuation
Type of diet Mediterranean 990 83.5
Vegetarian 17 1.4
Macrobiotic 10 0.8
Fast-food 2 0.2
Mixed 45 3.8
Don’t know 122 10.2
Total 1,186
Nº meals per day < 3 49 4.1
3 to 5 1,094 90.9
≥ 6 60 5.0
Total 1,203
Eating out No 351 29.7
Yes 832 70.3
Total 1,183
Changed eating habits Yes 194 16.4
No 986 83.6
Total 1,180
Glasses of water/day Don’t remember 36 3.2
< 5 683 60.0
5 to 7 334 29.3
8 to 10 73 6.4
11 13 1.1
Total 1,139
Chronic disease Yes 468 38.6
No 746 61.4
Total 1,214
Frequency of chronic disease 1 to 2 332 70.9
3 to 4 91 19.4
≥ 5 45 9.6
Total 468
FPU: predominantly urban parish; FMU: moderately urban parish; FPR: predominantly rural parish; a) SF-36 Scale item; BMI: body mass index; PC: waist circumference
Type of activity at work: a_1) mostly seated; b_2) standing and walking, without other physical activity; c_3) standing and walking, but also climbing stairs and lifting objects; d_4) Hard physical activity; e_5) standing and walking, but also climbing stairs and lifting objects. Hard physical activity;
Portuguese Classiication of Professions: a: Representatives of the Legislative and Executive Bodies, Oficers, Directors and Executive Managers; b: Technicians and Intellectual and Scientiic Activities; c: Mid-level Technicians and Professionals; d: Administrative personnel; e: Personal Services, Safety and Security Workers and Salespeople; f: Farmers and Skilled Workers, Agriculture, Fisheries and Forestry; g: Skilled Industry and Construction Workers and Craftsmen; h: Equipment and Machinery Operators and assemblers; i: Unskilled workers.
a Usually rely on health services for health care. b Main reason for most recent consultation.
Behavioral performance was significantly lower in
women and they also showed greater disability and
expressed more discomfort in activities of daily living
compared with males regarding PHM. A similar pattern
was observed in the ≥ 65 and 55-65 years old age groups
compared with younger individuals. The interviewees
with lower educational achievement had worse results
for physical health than those with more schooling. The
health indices were better in those who were single and
those who were married/ in a stable relationship than
those who were widowed. There was a similar pattern for
those who lived alone. Regarding MHM, females, those
aged ≥ 55, those with low levels of educational attain
-ment and individuals who were widowed or living alone
had worse health indices, with the exception of present
or absent fathers (p > 0.05). The well-being of females,
those with low schooling, widows and those with a father
had less energy in the general health and vitality measure.
Those living in areas which were predominantly urban,
those living in apartments and who paid monthly had
better HRQL than those who lived in predominantly rural
and moderately urban areas, those who lived in houses
and those who owned their own homes. Those with a
religion had worse physical functioning (p = 0.016) and
mental health (p = 0.037) compared with those who had
no religion. Those who were practicing had worse HRQL
compared with non-practicing individuals. Low levels
of HRQL were found in those who were inactive, and a
similar pattern was found in those whose employment
was precarious regarding physical performance, pain
and vitality, with the exception of physical functioning
(p = 0.450) and general health (p = 0.421).The lower
middle class has a greater health deicit in terms of phys
-ical function (p = 0.002) and general health (p < 0.0001).
However, MHM and vitality did not differ according to
social class (Table 2).
Those who perceived their own health as reasonable,
poor/very poor had worse HRQL. Those who were
overweight and obese had lower HRQL at the physical
level, and there was a similar pattern regarding waist
circumference (presence of risk). Obese individuals had
similar mean values for social function (p = 0.100), but
worse performance for emotional and mental health
compared with the other BMI groups. Being obese or
overweight showed worse general health and vitality
indices and there was a similar pattern regarding
waist circumference, with the exception of vitality
(p = 0.082). Those who consumed three to ive or more
meals a day had better PHM, MHM and general health.
Regular/occasional alcohol drinkers perceived their
physical function to be better, with the exception of
physical performance (p = 0.081) and pain (p = 0.139).
Concerning mental health, consumers revealed better
emotional (p = 0.024) and mental health (p = 0.008)
compared with those who did not drink, with the
exception of social function and vitality. Signiicantly
poorer health conditions were observed in smokers
and ex-smokers who had smoked for a long time. This
pattern was not present in MHM. Individuals who were
sedentary, who slept ≤ 6h or fewer had worse HRQL.
Those who had seen a doctor in the preceding three
months (health care) had a signiicant physical and
mental health deicit, although the type of appointment
(General/Specialty) was not a differentiator. Those who
had taken prescribed medication in the preceding two
weeks had worse PHM and mental health (p = 0.032),
with the exception of social function and emotional
performance. Those who had taken non-prescription
medicine did not differ with regards HRQL measures.
The physical functioning, physical performance and
pain of those who had had a doctor’s, dentist’s or other
appointment did not differ from those who had not
seen any of those professionals (p > 0.05). However,
the former indicated better quality of life in terms of
mental and general health and vitality. Those who
reported having seen a health professional in the ≤ 12
months tended to have worse HRQL indices compared
with those whose last consultation had been more than
12 months before. Worse HRQL was observed, in the
majority of indices, in those who had had a
mammo-gram or a lu vaccination and those who controlled high
blood pressure and cholesterol (Table 3).
The most prevalent chronic diseases were: arterial
hypertension (15.5%), rheumatic diseases (11.2%),
depression (8.8%), allergies and rhinitis (7.7%). HRQL
indices were worse in the presence of a chronic disease
and its frequency were evaluated (Table 4).
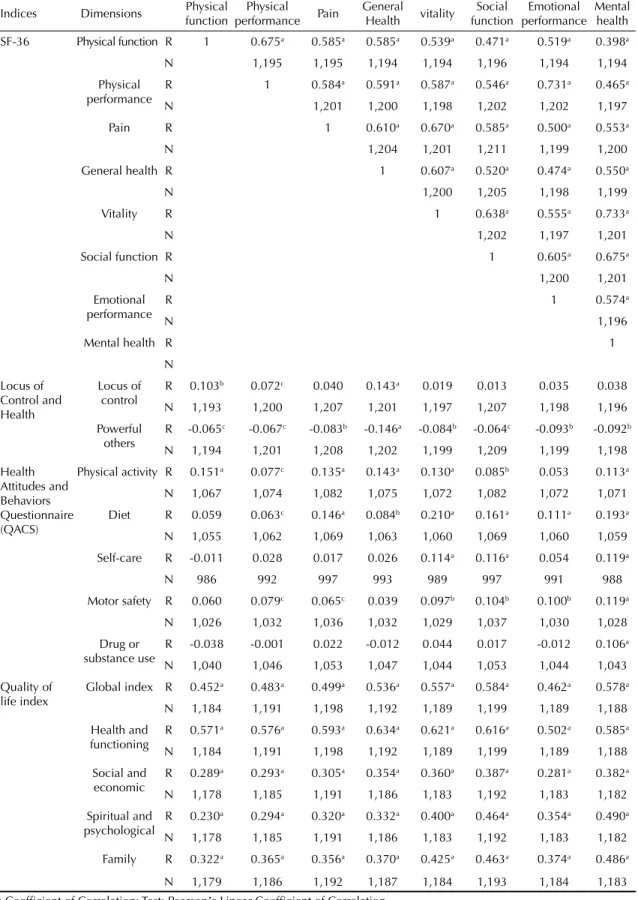
Those with worse physical health conditions had a
proportionally worse state of mental health, a lower
indices for general health and vitality and
vice-versa
when the inter-relationship between the different
measures and HRQL was evaluated. Those who consid
-ered that their health depended on their personal health
behavior (locus of control) had better indices of
phys-ical functioning, physphys-ical performance and general
health, although not of MHM. However, those who
believed that their health depended more on external
entities (powerful others) had worse HRQL indices.
As for the HABQ, those who sought a better physical
condition (physical exercise) and took more care with
their diet (nutrition) had higher indices of HRQL. A
pattern of positive correlation was observed with the
development of better preventative behavior (self-care)
and avoided accidents/injuries (motor safety) in terms
of measures of mental health. Lower dependence on
chemical substances (e.g., drugs) correlated positively
with mental health. As for the quality of life index, the
more satisied the individual was with life in general
(general index), health and functionality, social
relation-ships and economic conditions (social and economic),
belief and psychological well-being (spiritual and
psychological) and family support (family) the higher
the indices were for HRQL (Table 5).
DISCUSSION
The majority of the different indicators/indices
moni-tored (personal, clinical, health behavior, life styles and
satisfaction with life) were shown to have signiicant
impact on the HRQL of our inhabitants.
The personal characteristic with the greatest impact on
HRQL was the biological factor, gender. Thus, as in the
literature, women tend to be the group with the highest
rates of morbility and worse HRQL in both physical
and mental terms.
7,17They also make more use of health
care.
4,7Age was shown to be an important marker in
understanding a population’s HRQL.
4HRQL deterio
Per
cei
ved health in the P
ortuguese population
Figueiredo JP & Cardoso SM
Physical dimension
Physical functioning Physical performance Pain General health
n M SD p n M SD p n M SD p n M SD p
Female 719 82.4 20.8 < 0.0001b 725 82.6 22.9 0.003b 727 67.4 24.3 < 0.0001b 726 60.7 18.4 0.01b
Male 478 87.7 19.9 479 86.4 21.6 484 74.7 23.3 479 63.4 17.2
Aged 35├ 45 487 92.8 13.2 <0.0001a 487 91.8 15.9 < 0.0001a 487 78.2 22.1 < 0.0001c 485 68.1 15.5 < 0.0001a
Aged 45├ 55 374 86.7 15.6 378 86.8 18.4 380 69.5 22.9 379 62.3 16.5
Aged 55├ 65 189 78.6 19.8 191 78.0 23.0 194 66.1 23.7 193 57.4 17.9
Aged ≥ 65 143 58.2 3.2 144 58.9 29.3 146 51.9 23.0 144 45.2 17.8
1.º CEB inc. 73 54.1 31.2 < 0.0001d 73 56.9 30.9 < 0.0001d 75 50.2 24.6 < 0.0001c 75 42.2 17.2 < 0.0001c
1.º CEB 207 76.9 23.3 208 80.1 24.4 212 66.3 24.0 209 55.3 16.9
2.º CEB 101 83.2 18.6 103 84.4 19.1 106 65.8 21.7 105 58.9 15.9
3.º CEB 179 87.8 16.8 179 86.3 19.8 177 72.9 22.4 178 62.4 15.7
Secondary 331 89.2 16.1 331 87.6 20.4 332 72.3 24.3 331 65.3 17.6
Further 298 90.5 13.7 302 88.3 18.1 301 76.1 22.5 300 67.9 16.3
Single 127 92.0 12.0 < 0.0001d 127 91.3 16.1 < 0.0001d 127 78.2 21.4 < 0.0001a 125 66.7 16.3 < 0.0001c
M/SR 896 85.0 19.8 901 84.8 22.1 906 70.0 24.2 904 61.8 17.8
D/S 116 86.0 19.6 117 83.1 20.8 117 73.2 22.4 117 63.8 16.9
Widowed 58 57.2 29.0 59 61.0 27.9 61 52.1 21.1 59 47.0 18.3
Yes V.C. 954 85.4 19.6 0.127e 959 85.0 21.8 0.012e 964 70.4 24.1 0.793b 961 62.2 17.8 0.103b
No V.C. 243 81.1 24.3 245 80.8 24.6 247 69.9 24.4 244 60.1 18.8
Children − Yes 1,048 83.7 20.9 < 0.0001e 1,054 83.6 22.5 0.002e 1,062 69.3 24.2 < 0.0001e 1,057 61.2 17.9 0.005b
Children − No 146 90.4 17.9 146 88.3 21.3 145 77.2 22.5 144 65.8 18.4
FPU 779 87.0 17.6 < 0.0001d 784 86.5 20.2 < 0.0001c 787 73.5 23.1 < 0.0001c 785 63.6 16.9 < 0.0001c
FMU 286 79.8 25.6 287 80.2 25.6 291 66.2 24.7 287 60.0 18.9
FPR 132 79.7 22.9 133 78.8 25.6 133 60.4 24.8 133 54.9 19.9
House 690 82.0 21.9 < 0.0001e 695 81.8 23.8 < 0.0001e 698 67.7 24.5 < 0.0001e 695 60.2 18.8 < 0.0001e
Apartment 475 88.8 16.8 476 88.2 19.1 478 74.8 22.5 476 64.4 16.1
417
Mortgage 289 90.1 15.2 290 90.4 16.5 291 78.6 18.4 290 65.1 13.1
Rel. Yes 1,078 83.9 21.2 0.016e 1,085 83.9 22.8 0.909e 1,092 70.1 24.5 0.229b 1,086 61.5 18.3 0.093b
Rel. No 117 89.6 14.1 117 86.6 18.3 117 72.2 20.7 117 63.9 14.3
Practicing 378 78.7 23.3 < 0.0001e 383 79.1 24.4 < 0.0001e 383 64.5 24.9 < 0.0001b 383 57.0 19.7 < 0.0001b
Not practicing 670 86.9 19.2 671 86.6 21.3 676 73.4 23.6 671 64.0 16.8
Inactive 279 68.5 27.9 < 0.0001e 281 67.0 28.6 < 0.0001e 283 59.1 25.1 < 0.0001e 281 51.0 19.8 < 0.0001b
Active 918 89.4 14.8 923 89.3 17.1 928 73.7 22.8 924 65.0 16.0
T.D. 114 87.7 15.7 0.450e 114 84.4 18.4 < 0.0001e 113 70.4 21.2 0.026e 114 63.9 16.4 0.421b
T.I. 792 89.6 14.7 797 90.1 16.6 801 74.5 22.7 796 65.2 16.0
Class Ia 99 90.2 15.3 0.002d 100 89.7 17.2 0.722d 100 76.5 22.9 0.559c 100 70.4 16.2 < 0.0001c
Class II 243 89.3 14.6 246 88.7 17.9 246 72.8 23.9 244 64.8 17.2
Class III 414 90.1 14.6 415 90.0 16.5 420 73.7 22.2 418 64.8 15.4
Class IV 64 86.1 13.7 64 87.9 17.3 64 72.4 22.1 64 59.0 12.9
Mental dimension
Vitality Social functioning Emotional performance Mental health
n M SD p n M SD p n M SD p n M SD p
Female 725 62.6 21.9 < 0.0001b 728 80.2 21.9 < 0.0001b 724 85.0 21.7 0.006b 725 73.3 20.7 < 0.0001b
Male 477 70.3 20.6 484 85.5 19.0 478 88.3 19.8 476 79.2 17.4
Aged 35├ 45 486 71.6 19.9 < 0.0001a 487 86.8 19.1 < 0.0001a 487 90.8 17.3 < 0.0001a 486 79.7 17.5 < 0.0001a
Aged 45├ 55 377 66.0 19.9 381 82.6 20.2 377 88.8 17.6 377 76.1 18.3
Aged 55├ 65 190 60.9 22.9 194 78.9 21.2 190 81.3 22.8 190 70.7 22.6
Aged ≥ 65 145 51.7 21.3 146 71.3 23.2 144 71.2 28.7 144 68.2 21.3
1.º CEB inc. 74 45.7 24.1 < 0.0001a 75 68.5 24.9 < 0.0001d 73 66.8 27.4 < 0.0001d 72 63.2 23.4 < 0.0001d
1.º CEB 207 63.3 23.7 212 81.3 21.1 207 85.1 23.5 207 73.9 20.5
2.º CEB 105 63.1 18.7 106 81.7 19.4 103 87.2 19.6 104 74.9 17.8
3.º CEB 178 66.7 20.2 178 84.2 20.0 179 87.5 20.0 178 76.3 19.3
Secondary 330 69.1 20.9 332 84.0 21.3 330 87.8 19.8 330 77.1 19.9
Further 300 69.0 18.7 301 83.9 20.0 302 89.3 16.8 300 78.5 17.0
Per
cei
ved health in the P
ortuguese population
Figueiredo JP & Cardoso SM
M/SR 899 66.0 21.6 907 83.7 20.5 899 87.1 20.4 898 76.0 19.6
D/S 117 66.3 21.1 117 80.2 20.3 117 82.4 22.5 117 72.9 19.8
Widowed 60 52.1 21.2 61 65.0 24.2 59 74.3 26.5 60 68.9 21.2
Yes V.C. 957 66.4 21.5 0.018e 965 83.7 20.3 < 0.0001e 957 87.2 20.4 0.003e 956 76.3 19.6 0.014e
No V.C. 245 62.9 21.8 247 76.8 22.4 245 82.9 22.9 245 73.2 19.5
Children – Yes 1,053 65.2 21.7 0.032e 1,063 82.3 20.9 0.669e 1,052 86.0 21.1 0.170e 1,052 75.3 19.9 0.065e
Children – No 145 69.3 20.7 145 82.2 20.9 146 88.7 19.7 145 79.0 16.9
FPU 783 67.9 21.4 < 0.0001c 788 83.3 20.4 0.038c 782 87.9 19.5 0.004d 782 77.2 19.3 < 0.0001c
FMU 286 64.5 19.9 291 81.3 22.3 287 83.4 23.3 286 73.9 19.8
FPR 133 55.2 22.6 133 78.6 20.9 133 83.2 23.3 133 70.4 20.0
House 691 64.0 21.5 < 0.0001e 698 81.0 21.6 0.005e 693 85.0 22.0 0.01e 690 74.2 20.1 < 0.0001e
Apartment 478 68.8 20.9 479 84.8 19.1 476 88.8 18.7 478 78.4 18.0
H-P 896 63.5 21.7 < 0.0001e 905 81.3 21.5 0.003e 896 84.8 21.9 < 0.0001e 895 73.8 20.0 < 0.0001e
Mortgage 290 72.7 19.7 291 85.6 18.7 290 91.3 16.6 290 81.8 16.6
Rel. Yes 1,083 65.8 21.7 0.519b 1,093 82.5 21.1 0.058e 1,083 86.1 21.4 0.549e 1,082 75.3 19.9 0.037b
Rel. No 117 64.5 19.9 117 80.2 19.2 117 87.8 17.1 1,117 78.6 15.4
Practicing 382 60.3 21.0 < 0.0001b 383 79.7 21.2 0.001b 382 83.5 22.3 < 0.0001e 382 72.3 20.4 < 0.0001b
Not practicing 670 69.0 21.4 677 84.1 20.9 670 87.7 20.7 669 77.4 19.2
Inactive 282 55.4 22.9 < 0.0001b 283 73.5 23.0 < 0.0001e 281 74.4 26.8 < 0.0001e 281 67.5 21.7 <0.0001e
Active 920 68.8 20.1 929 85.0 19.5 921 89.9 17.4 920 78.1 18.3
T.D. 114 64.1 18.7 0.007b 114 81.0 18.5 < 0.001e 113 85.3 17.8 < 0.0001e 114 75.0 16.9 0.004e
T.I. 793 69.5 20.2 801 85.5 19.6 796 90.7 17.1 793 78.6 18.4
Class Ia 99 69.0 19.4 0.742c 100 82.5 21.1 0.313d 100 89.5 15.8 0.074d 99 78.5 16.6 0.066d
Class II 244 68.1 19.6 246 85.4 19.4 244 87.3 20.3 244 76.0 19.4
Class III 415 69.8 20.7 421 86.1 19.3 415 91.2 16.3 415 79.4 18.7
Class IV 64 70.2 21.7 64 85.9 20.5 64 90.9 16.6 64 78.4 19.8
M: mean; SD: standard deviation; 1º cycle EB inc.: 1º cycle of elementary education incomplete; M/SR: Married/stable relationship; D/S: Divorced/Separated; Yes V.C.: yes cohabit; No V.C.: not cohabiting; FPU: predominantly urban parish; FMU: moderately urban parish; FPR: predominantly rural parish; H-P: homeowner; Rel. Yes: religion yes; Rel. No: religion no; a) Social class – Graffar scale; T.D.: temporary; T.I.: permanent
419
Physical functioning Physical performance Pain General health
n M SD p n M SD p n M SD p n M SD p
M.B. 103 96.3 7.3 < 0.0001c 103 97.0 8.7 < 0.0001c 103 88.2 16.9 < 0.0001c 103 82.2 11.7 < 0.0001a
B. 540 92.7 11.7 543 92.8 13.4 541 79.5 18.4 541 69.8 11.7
R. 433 76.6 21.7 435 75.0 23.8 440 59.4 22.4 437 51.8 14.3
M.M.M. 51 45.1 24.8 53 48.5 29.5 54 38.2 24.2 53 29.2 13.9
Underweight 4 97.5 2.9 < 0.0001c 4 95.3 9.4 < 0.0001c 4 84.0 19.1 < 0.0001c 4 72.0 10.8 < 0.0001c
Normal 452 87.3 19.3 455 86.9 2.4 456 73.8 23.4 453 64.4 17.9
Overweight 517 84.2 20.0 522 84.0 21.8 525 68.8 24.1 523 60.9 17.4
Obese 170 76.0 25.0 169 75.8 27.5 171 64.2 25.3 171 57.6 18.8
Normala 551 85.6 20.2 < 0.0001d 554 84.3 21.0 < 0.0001d 558 69.7 23.7 < 0.0001b 553 62.1 18.0 < 0.0001b
High risk 339 77.2 23.5 339 77.5 26.3 341 63.6 25.3 341 57.2 18.5
< 3 meals 49 78.6 25.9 0.161c 49 79.7 27.9 0.734c 49 63.1 30.5 0.212c 49 60.0 21.4 0.567c
3 to 5 meals 1,078 84.7 20.6 1,086 84.3 22.1 1,091 70.7 23.7 1,085 61.7 17.7
≥ 6 meals 60 85.6 16.4 59 84.9 22.1 60 67.9 24.7 60 64.4 20.4
Alc. Yes 515 86.3 19.6 0.001d 517 85.0 22.4 0.081d 521 71.4 23.5 0.139d 519 63.1 16.8 0.022b
Alc. No 670 83.0 21.5 675 83.3 22.4 678 69.3 24.5 674 60.7 18.8
Years smoking 246 -0.199 0.002e 246 -0.136 0.033e 247 -0.127 0.046e 245 -0.139 0.030e
Years ex-smoker 160 -0.224 0.004e 164 -0.232 0.003e 165 -0.323 < 0.001e 164 -0.237 0.002e
A.F. – Yes 328 90.4 15.8 < 0.0001d 329 88.2 19.8 < 0.0001d 331 76.6 23.5 < 0.0001d 328 67.2 16.8 < 0.0001d
A.F. – No 855 82.3 21.8 861 82.7 23.1 864 67.9 23.8 862 59.8 18.0
< 7 h/da 283 80.9 21.8 < 0.0001c 284 77.9 24.4 < 0.0001c 282 62.4 24.4 < 0.0001c 281 58.1 19.6 < 0.0001c
7 to 8 h/day 786 86.4 19.1 791 86.5 20.8 797 72.7 23.5 793 63.2 17.2
> 8 h/day 102 79.7 26.5 103 82.5 25.6 104 73.5 23.5 104 60.5 18.5
Vis.M – No 468 89.1 18.1 < 0.0001d 468 88.7 19.2 < 0.0001d 471 78.0 21.5 < 0.0001d 468 66.9 16.1 < 0.0001d
Vis.M – Yes 729 81.5 21.7 736 81.2 23.8 740 65.3 24.4 737 58.5 18.4
T.C. – CG 501 80.8 22.3 0.326d 506 81.0 23.7 0.754d 509 65.8 24.1 0.344d 509 58.6 18.1 0.811b
T.C – Esp 226 83.0 20.1 228 81.3 24.2 229 64.0 25.0 226 58.3 19.2
C.M.R –Yes 523 81.9 21.7 < 0.0001d 528 82.1 23.6 0.005d 529 66.2 24.7 < 0.0001d 527 59.9 18.5 0.001b
C.M.R – No 649 86.6 19.6 652 85.9 21.1 658 73.7 22.8 654 63.3 17.3
Per
cei
ved health in the P
ortuguese population
Figueiredo JP & Cardoso SM
C.M.N.R No 849 84.7 20.6 852 84.3 22.4 858 70.6 23.9 855 61.4 18.1
C.D. Yes 1,100 84.7 20.4 0.314d 1,106 84.2 22.5 0.520d 1,113 70.5 24.2 0.214b 1,107 62.1 17.9 0.036b
C.D. No 97 82.0 23.0 98 83.4 22.0 98 67.4 23.7 98 58.1 17.5
C.D.b Yes 724 85.2 19.6 0.997d 728 84.2 22.0 0.410d 734 69.9 24.6 0.202d 729 62.9 18.2 0.104d
C.D. No 372 84.0 21.8 374 84.1 23.5 375 71.8 23.4 374 60.7 17.6
Mam. Yes 506 80.9 20.6 < 0.0001d 513 81.8 22.6 0.007d 512 65.4 24.5 < 0.0001d 513 59.4 18.4 0.001b
Mam. No 201 87.4 19.0 200 85.9 21.5 203 72.8 22.6 201 64.7 17.5
Citol. Yes 436 83.9 17.9 0.902d 441 83.3 20.9 0.888d 441 65.1 24.3 0.005d 441 61.7 18.4 0.271d
Citol. No 227 80.4 24.6 228 81.3 25.3 230 70.1 24.5 229 59.2 18.3
Vacina Yes 305 76.5 25.7 < 0.0001d 307 75.8 27.7 < 0.0001d 310 61.4 26.1 < 0.0001d 308 54.9 20.9 < 0.0001d
Vacina No 863 87.6 17.4 868 87.3 19.2 872 73.6 22.6 868 64.5 16.0
CTA – Yes 886 83.0 21.5 < 0.0001d 891 82.9 23.2 < 0.0001d 896 69.2 24.3 0.007d 893 60.7 18.5 0.001d
CTA – No 281 89.4 17.2 282 89.0 18.5 282 74.0 22.8 281 65.2 15.7
Coles. – Yes 666 81.9 20.9 < 0.0001d 673 80.1 23.5 < 0.0001d 679 66.2 23.9 < 0.0001d 675 59.0 19.1 < 0.0001d
Coles. – No 484 88.5 18.8 484 90.4 18.4 483 76.2 22.8 483 65.8 15.4
Mental dimension
M.B. 103 78.3 15.2 < 0.0001a 103 93.1 13.0 < 0.0001c 103 95.9 9.5 < 0.0001c 103 86.3 12.7 < 0.0001a
B. 538 74.4 17.0 542 88.9 16.5 542 92.8 14.2 538 82.2 15.0
R. 440 55.9 20.5 440 75.0 21.2 435 79.2 23.6 437 68.0 20.7
M.M.M. 54 39.1 19.7 54 60.9 26.7 53 61.8 28.7 52 54.0 22.0
Underweight 4 72.5 9.6 < 0.0001c 4 87.5 10.2 0.100c 4 100.0 0.0 0.001c 4 80.5 7.7 0.024c
Eutrophic 453 68.6 20.8 456 83.4 21.4 454 88.2 19.5 453 77.2 19.6
Overweight 521 64.6 21.6 526 82.0 20.4 521 86.4 20.4 520 75.3 19.3
Obesity 170 60.3 22.6 171 80. 6 20.1 169 80.1 25.6 170 72.8 19.7
Normala 555 63.5 20.1 0.082b 559 81.1 20.1 0.133b 554 85.4 20.7 0.275d 554 74.2 19.0 0.321d
High risk 340 60.9 22.7 341 78.9 22.2 339 83.1 23.0 340 72.9 20.6
< 3 Meals 49 56.2 24.9 0.013c 49 70.6 25.0 0.001c 49 82.1 21.4 0.015c 49 64.9 22.7 0.002c
3 a 5 Meals 1,083 66.0 21.3 1,092 82.7 20.7 1,084 86.2 21.2 1,082 76.1 19.4
≥ 6 Meals 60 68.1 21.4 60 84.4 18.8 59 92.9 14.5 60 77.9 15.1
Alc. Yes 516 67.3 20.8 0.062d 521 84.1 18.5 0.110d 515 88.0 19.6 0.024d 515 77.8 17.7 0.008d
Alc. No 674 64.4 22.0 679 80.8 22.6 675 84.9 21.9 674 74.0 20.8
421
Years ex-smoker 162 -0.157 0.046e 165 -0.264 0.001e 163 -0.140 0.074e 161 -0.091 0.253e
A.F. – Yes 329 71.9 20.1 < 0.0001d 331 85.2 20.6 < 0.0001d 329 89.3 19.8 < 0.0001d 329 79.9 18.9 < 0.0001d
A.F. – No 859 63.4 21.6 865 81.2 21.0 859 85.3 21.2 858 74.1 19.6
< 7 h/daya 282 58.6 22.0 < 0.0001c 283 75.9 23.0 < 0.0001c 283 80.1 23.7 < 0.0001c 282 68.8 21.0 < 0.0001c
7 a 8 h/day 791 67.9 20.7 797 84.5 19.7 791 88.4 19.3 790 77.9 18.5
> 8 h/day 102 68.7 22.3 104 82.7 21.9 102 86.6 23.0 102 78.2 20.2
Vis.M – No 467 70.6 19.8 < 0.0001d 471 86.4 18.8 < 0.0001d 468 89.6 17.8 < 0.0001d 467 79.1 17.1 < 0.0001d
Vis.M – Yes 735 62.7 22.1 741 79.6 21.8 734 84.2 22.6 734 73.5 20.8
T.C. – CG 507 62.6 22.3 0.883b 510 80.4 21.1 0.206d 504 84.6 22.0 0.437d 506 74.1 20.9 0.156d
T.C – Esp 226 62.3 21.7 229 77.8 23.1 228 83.0 23.8 226 72.0 20.5
C.M.R –Yes 528 63.2 21.8 < 0.0001b 529 81.2 21.5 0.084d 527 86.1 20.5 0.196d 527 74.3 20.3 0.032d
C.M.R – No 650 67.8 21.2 659 83.3 20.3 651 86.7 21.2 650 76.9 18.8
C.M.N.R Yes 323 65.5 20.7 0.647d 324 81.6 20.9 0.317d 324 86.2 19.7 0.579d 323 75.7 19.2 0.655d
C.M.N.R No 852 65.8 21.9 859 82.8 20.8 850 86.4 21.4 851 75.9 19.7
C.D. Yes 1,106 66.1 21.6 0.026b 1,114 82.6 21.1 0.008d 1,105 86.5 20.9 0.040d 1,105 76.1 19.6 0.002d
C.D. No 96 61.0 20.3 98 78.8 18.5 97 83.3 21.9 96 70.6 19.4
C.D.b Yes 728 65.1 21.2 0.005d 735 81.9 21.2 0.037d 727 86.5 20.2 0.220d 727 75.3 19.8 0.035d
C.D. No 374 68.1 22.3 375 84.1 20.8 374 86.8 22.2 374 77.7 19.1
Mam. Yes 511 61.5 21.8 0.012b 513 79.4 22.1 0.041d 512 84.6 21.5 0.324d 511 72.4 21.8 0.059d
Mam. No 202 66.1 21.3 203 83.13 20.3 200 86.2 21.4 202 76.1 18.7
Citol. Yes 441 60.4 20.3 0.004d 442 78.80 21.7 0.029d 440 84.6 20.8 0.430d 441 71.7 19.8 0.006d
Citol. No 228 64.6 23.7 230 82.0 21.7 228 84.4 23.6 228 74.7 21.4
Vacina Yes 307 60.8 23.3 < 0.0001d 310 77.0 23.2 < 0.0001d 307 80.5 26.0 < 0.0001d 307 71.1 22.2 < 0.0001d
Vacina No 866 67.6 20.6 873 84. 5 19.6 866 88.5 18.4 865 77.4 18.2
CTA – Yes 889 65.5 22.1 0.955d 897 82.2 21.1 0.638d 890 85.5 21.6 0.019d 888 75.7 20.0 0.491d
CTA – No 282 66.5 19.3 282 83.2 20.0 281 89.5 18.1 282 75.7 18.4
Coles. – Yes 671 61.9 21.1 < 0.0001d 679 79.8 21.1 < 0.0001d 672 83.6 22.1 < 0.0001d 670 73.2 20.1 < 0.0001d
Coles. – No 484 70.9 20.5 484 86.4 19.3 483 90.5 18.3 484 79.1 18.0
M: mean; SD: standard deviation; r: Pearson’s correlation; perception of general health: M.B.: very good; B.: good; R.: reasonable; M.M.M: poor or very poor; a) waist circumference; meals per day: < 3 Ref.: fewer than three; 3 to 5 meals; 6 meals; Alcohol consumption: Alc. Yes: Alcohol consumption; Alc. No: doesn’t drink; Years smoking: Nº of years smoking; Years ex-smoking: Nº of years smoking; Physical activity: A.F. Yes (Does physical activity); A.F. No (doesn’t do physical activity); a) hours of sleep; Vis.M.: visited doctor in last 3 months; T.P.-CG: type of consultation (General Practitioner); T.P.-Esp: type of consultation (specialty); C.M.R.: Took prescription medicine in last two weeks; C.M.N.R.: took non- prescription medicine in last two weeks; C.D: Dentist consultation, stomatologist...; C.Db): If consulted a dentist, stomatologist, in last 12 months; Mam.: mammography: Cito: Cytology; Vaccine: Flu vaccination; CTA: control blood pressure; Coles: Control cholesterol
Per
cei
ved health in the P
ortuguese population
Figueiredo JP & Cardoso SM
Physical function Physical performance Pain General Health
n n M SD p n M SD p n M SD p n M SD p
Aus. CD 737 90.1 15.4 < 0.0001b 742 90.0 17.1 < 0.0001b 743 77.9 20.9 < 0.0001b 740 67.1 14.7 < 0.0001b
Pres. CD 460 75.5 24.5 462 74.8 26.4 468 58.2 24.0 465 53.3 19.5
1 to 2 CD 330 81.9 20.4 < 0.0001d 330 80.8 22.6 < 0.0001d 332 64.1 22.8 < 0.0001c 332 57.7 17.4 < 0.0001c
3 to 4 CD 87 63.6 26.6 89 66.2 28.7 91 47.9 21.1 89 48.0 20.6
≥ 5 CD 43 50.2 24.2 43 46.1 25.0 45 34.9 16.9 44 31.6 14.7
1. Yes 51 49 60.8 25.7 < 0.0001b 50 62.6 29.8 < 0.0001b 51 50.4 23.8 < 0.0001a 50 43.7 18.7
No 1,163 1,148 85.5 19.8 1,154 85.0 21.6 1,160 71.1 23.8 1,155 62.6 17.5 < 0.0001a
2. Yes 24 22 65.2 30.2 0.001b 23 72.3 24.6 < 0.0001b 24 57.5 23.4 0.009a 24 53.8 22.5
No 1,190 1,175 84.9 20.3 1,181 84.3 22.3 1,187 70.5 24.1 1,181 61.9 17.9 0.093a
3. Yes 188 180 70.3 25.8 < 0.0001b 182 70.3 27.3 < 0.0001b 188 56.2 23.4 < 0.0001a 185 50.0 19.0
No 1,026 1,017 87.0 18.5 1,022 86.6 20.5 1,023 72.9 23.4 1,020 63.9 16.9 < 0.0001a
4. Yes 33 32 59.2 29.0 < 0.0001b 32 55.9 28.6 < 0.0001b 33 36.8 19.5 < 0.0001a 32 38.4 21.9
No 1,181 1,165 85.2 19.9 1,172 84.9 21.7 1,178 71.2 23.6 1,173 62.4 17.4 < 0.0001a
5. Yes 136 131 62.8 28.2 < 0.0001b 133 61.9 29.5 < 0.0001b 136 45.0 21.6 < 0.0001a 134 44.2 21.5
No 1,078 1,066 87.2 17.8 1,071 86.9 19.7 1,075 73.5 22.5 1,071 64.0 16.2 < 0.0001a
6. Yes 43 41 59.4 25.8 < 0.0001b 41 60.1 28.7 0.023b 43 42.9 20.8 < 0.0001b 42 37.3 19.1
No 1,171 1,156 85.4 19.9 1,163 85.0 21.7 1,163 71.3 23.7 1,163 62.7 17.3 < 0.0001a
7. Yes 10 9 64.4 26.5 0.006b 9 70.1 26.5 0.001b 10 58.0 16.4 0.066b 9 51.6 23.9
No 1,204 1,188 84.7 20.6 1,195 84.2 22.4 1,021 70.4 24.2 1,196 61.8 17.9 0.087a
8. Yes 30 29 75.2 20.8 0.002b 30 70.0 27.1 0.002b 30 54.0 24.6 < 0.0001a 30 50.1 17.0
No 1,184 1,168 84.7 20.6 1,174 84.5 22.2 1,181 70.7 23.9 1,175 62.1 17.9 < 0.0001a
9. Yes 44 44 74.1 25.6 0.002b 44 73.7 27.0 0.001b 44 58.1 24.7 0.001b 44 49.8 18.2
No 1,170 1,153 84.9 20.4 1,160 84.5 22.1 1,167 70.7 23.9 1,161 62.2 17.8 < 0.0001a
10. Yes 6 6 54.2 31.5 0.014b 6 33.3 34.8 < 0.0001b 6 35.0 16.2 < 0.0001b 6 28.3 12.5
No 1,208 1,191 84.7 20.5 1,198 84.4 22.1 1,205 70.5 24.0 1,199 61.9 17.8 < 0.0001a
11. Yes 16 16 49.4 21.1 < 0.0001b 16 47.3 25.7 0.003b 16 32.5 18.5 < 0.0001a 16 33.9 19.7
No 1,198 1,181 85.0 20.2 1,188 84.6 21.9 1,195 70.8 23.8 1,189 62.1 17.7 < 0.0001a
12. Yes 3 3 41.7 10.4 0.007b 3 22.9 25.3 < 0.0001b 3 42.7 35.8 0.120b 3 40.7 31.0
No 1,211 1,194 84.6 20.6 1,201 84.3 22.2 1,208 70.3 24.1 1,202 61.8 17.9 0.174b
423
No 1,201 1,185 84.8 20.4 1,192 84.4 22.2 1,198 70.5 23.9 1,192 62.1 17.8
14. Yes 11 10 56.5 27.9 0.001b 10 60.6 31.3 < 0.0001b 11 42.3 11.5 < 0.0001b 10 47.4 13.6 0.011a
No 1,203 1,187 84.7 20.4 1,194 84.3 22.2 1,200 70.5 24.1 1,195 61.9 17.9
15. Yes 34 34 68.5 28.8 < 0.0001b 34 69.5 28.7 < 0.0001b 34 52.9 24.5 < 0.0001a 34 55.0 20.5 0.025a
No 1,180 1,163 85.0 20.2 1,170 84.5 22.1 1,177 70.8 23.9 1,171 62.0 17.9
16. Yes 107 104 75.3 22.7 < 0.0001b 105 67.7 26.1 0.016b 107 48.7 22.1 < 0.0001b 106 47.7 20.6 < 0.0001a
No 1,107 1,093 85.4 20.3 1,099 85.7 21.4 1,104 72.4 23.3 1,099 63.1 17.1
17. Yes 8 8 47.5 31.6 0.001b 8 57.8 35.2 < 0.0001b 8 52.3 23.7 0.034a 8 53.9 22.0 0.213a
No 1,206 1,189 84.8 20.4 1,196 84.3 22.2 1,203 70.4 24.1 1,197 61.8 17.9
18. No 33 1,164 85.2 19.9 < 0.0001b 1,171 84.8 21.7 0.008 1,178 70.8 23.9 < 0.0001b 1,172 62.3 17.6 < 0.0001a
Yes 1,181 33 59.1 30.4 33 60.6 33.2 33 52.2 23.4 33 42.2 20.9
19. No 94 1,105 85.0 20.4 < 0.0001b 1,112 84.7 21.9 < 0.0001b 1,117 71.1 23.8 < 0.0001b 1,112 62.2 17.6 0.012a
Yes 1,120 925 78.5 23.0 92 76.8 27.3 94 60.6 25.9 93 56.5 20.9
20. No 66 1,131 85.0 20.5 < 0.0001b 1,138 84.6 22.3 0.009b 1,145 71.0 23.9 < 0.0001a 1,139 62.4 17.6 < 0.0001a
Yes 1,148 66 75.6 22.0 66 76.5 22.8 66 58.2 24.4 66 50.4 20.4
Mental dimension
Aus. CD 738 71.5 19.2 < 0.0001b 744 86.7 17.9 < 0.0001b 742 90.1 17.4 < 0.0001b 738 80.3 16.4 < 0.0001b
Pres. CD 464 56.4 21.9 468 75.3 23.4 460 80.1 24.7 463 68.3 21.9
1 to 2 CD 330 60.7 21.0 < 0.0001c 332 78.3 22.0 < 0.0001c 328 83.9 22.4 < 0.0001d 330 71.8 20.8 < 0.0001c
3 to 4 CD 89 49.5 19.9 91 71.8 23.4 89 75.3 25.9 88 63.2 21.8
≥ 5 CD 45 38.6 20.1 45 59.7 26.1 43 61.1 27.6 45 52.8 23.0
1. Yes 51 49 51.0 22.8 < 0.0001a 51 72.6 23.9 0.001b 49 73.3 28.8 < 0.0001b 49 65.8 23.7 0.002b
No 1,163 1,153 66.3 21.3 1,161 82.7 20.7 1,153 86.8 20.4 1,152 76.1 19.3
2. Yes 24 24 63.8 17.2 0.440b 24 77.6 23.9 0.267b 23 78.3 27.0 0.092b 23 73.9 26.6 0.664b
No 1,190 1,178 65.7 21.6 1,188 82.4 20.9 1,179 86.4 20.9 1,178 75.7 19.5
3. Yes 188 184 53.6 21.0 < 0.0001a 188 74.7 23.1 < 0.0001b 181 80.3 24.1 < 0.0001b 183 67.4 20.6 < 0.0001a
No 1,026 1,018 67.9 20.9 1,024 83.7 20.2 1,021 87.3 20.2 1,018 77.1 19.1
4. Yes 33 33 42.1 25.6 < 0.0001a 33 63.3 28.8 < 0.0001a 32 66.7 28.2 < 0.0001b 33 56.2 23.8 < 0.0001a
No 1,181 1,169 66.3 21.1 1,179 82.8 20.4 1,170 86.8 20.5 1,168 76.2 19.2
5. Yes 136 135 48.3 22.6 < 0.0001a 136 69.6 24.7 < 0.0001b 133 71.8 27.1 < 0.0001b 134 61.5 23.4 < 0.0001a
No 1,078 1,067 67.9 20.4 1,076 83.9 19.9 1,069 88.1 19.4 1,067 77.4 18.0