Sustainability of Brazilian iscal policy, once again:
corrective policy response over time
Viviane Luporini
Professora - Instituto de Economia - Universidade Federal do Rio de Janeiro (UFRJ) Endereço: Avenida Pasteur, 250 – Sala 103 - Urca - Rio de Janeiro/RJ - Brasil CEP: 22290-240 - E-mail: [email protected]
Recebido em 03 de junho de 2013. Aceito em 16 de dezembro de 2013.
Resumo
O artigo revisita a questão da sustentabilidade da política fiscal brasileira analisando as respostas fiscais do governo a alterações na razão dívida-PIB, com vistas a avaliar qual tem sido a resposta fiscal média do governo brasileiro, e como essa resposta fiscal tem variado ao longo do tempo. Utilizando dados mensais e controlando para variações no produto e participação relativa de títulos indexados, estimamos funções de reação sequenciais com uma janela móvel de 12 observações. Os resultados indicam que a política fiscal no período foi sustentável, com uma resposta fiscal média do governo consolidado de 0.096 pontos percentuais no superávit primário para um aumento de um ponto percentual na relação dívida-PIB. Verificamos ainda que a função de reação tornou-se mais estável, porém menos sensível a aumentos da relação dívida/PIB após o ano de 2000 e assumiu uma tendência declinante após 2006.
Palavras-Chave
Função de reação fiscal. Sustentabilidade fiscal. Brasil.
Abstract
This paper estimates a fiscal reaction function for Brazil and investigates how the government´s fiscal reaction has changed over time when controlling for cyclical va-riations in output and the relative participation of indexed debt. Using monthly data since 1991, we estimate a rolling reaction function with a one observation step and a sample-window of 12 observations. Our results indicate that the government´s fiscal response has been such that a one percent increase in the debt-GDP ratio can be asso-ciated to an average increase in the primary surplus of approximately 0.096% over GDP or 9.6 basis points; the government´s fiscal reaction has become more stable but less responsive to the debt-income level after 2000 and assumed a declining trend after 2006.
Keywords
Fiscal reaction function. Fiscal sustainability. Brazil.
JEL Classiication H62. H63. E62.
1. Introduction
Most of the applied literature on fiscal sustainability are based on the econometric implications of a government following an intertem-porally balanced budget constraint. Compliance or not to the budget constraint is usually tested as a cointegrating relationship between revenues and interest-inclusive government expenditures or, equi-valently, as a mean-reverting process for the debt-GDP ratio series. Articles by Hamilton and Flavin (1986), Trehan and Walsh (1991), Wilcox (1989), Hakkio and Rush (1991), Ahmed and Rogers (1995), Uctum and Wickens (2000), amongst others, have all analyzed sus-tainability in this fashion. For Brazil, following the international li-terature, Rocha (1995), Tanner (1995), Luporini (2000), Issler and Lima (2000), all tested sustainability through the econometric pro-perties of the debt, revenue and expenditure series, supporting sus-tainability. More recently, Bicalho (2005) finded that Brazilian fiscal policy was sustainable for the period 1997-2004, while Giambiagi and Ronci (2004) concluded for an unsustainable policy between 1995 and 2002. Using a probabilistic approach, Mendoza and Oviedo (2004), Garcia and Rigobon (2004), Tanner and Samake (2008), and Luporini and Licha (2009) also gave evidence of a fiscally sustainable public debt for Brazil.
Bohn (2007) shows, however, that an intertemporally balanced bud-get imposes very weak econometric restriction on the series of debt or revenues and expenditures. In proving his bold statements, Bohn shows how a broader class of stochastic processes may comply with an intertemporally balanced budget and yet violate mostly used condi-tions for sustainability, namely stationarity and cointegration. A more promising approach would be, according to the author, analyzing fis-cal sustainability through a fisfis-cal reaction function. Earlier, Uctum, Thurston and Uctum (2006) applied the usual econometric implica-tions of an intertemporally balanced budget (mainly unit root tests) to G7 and some Asian and Latin American countries (but not Brazil) and showed how sensitive these results could be to the inclusion (or not) of structural breaks in the tendency of the debt and deficit series, and how fiscal reaction functions could be used as a more appropriate instrument to analyze fiscal sustainability.
Luporini (2002), De Mello (2005), Lima and Simonassi (2005), and more recently, Mendonça , Santos and Sachsida (2009) and Simonassi (2013) have estimated fiscal reaction functions for Brazil. Mendonça, Santos and Sachsida, used a Markov switching model over the period 1995-2007 and found that Brazilian fiscal policy was more responsive to accumulating debt prior to the year 2000. Simonassi (2013) identifies two endogenous breaks on the Brazilian fiscal reaction function, in 1994 and in 2003. This paper also esti-mates a fiscal reaction function for Brazil, but we further investigate the evolution of the fiscal reaction function, analyzing how the go-vernment´s fiscal reaction has changed over time when controlling for cyclical variations in output and the relative participation of
floa-ting rate indexed debt. By analyzing the fiscal response through time
using a rolling sample window of 12 months, we hope to identify changes in the fiscal behavior of Brazilian authorities that may not be readily captured by the empirical approaches previously used for Brazilian data. Specifically, we pose ourselves two questions:
a) What has been the average fiscal response of the Brazilian government to variations in its public debt?
b) How has the Brazilian fiscal response behaved over time?
Our results indicate that the government´s fiscal response has been such that a 1 percent increase in the debt-GDP ratio can be associa-ted to an average increase in the primary surplus of approximately 0.096% over GDP or 9.6 basis points, the government´s fiscal reac-tion has become more stable but less responsive to the debt-income level after 2000 and assumed a declining trend after 2006.
The article is organized as follows. Section 2 presents the gover-nment´s budget constraint, the problems for assessing fiscal sus-tainability and present the fiscal reaction function. The results for the corrective policy responses by the Brazilian government and its evolution through time are presented in section 3. Section 4 con-cludes the article.
2. The government´s budget constraint and Bohn´s iscal reaction function
The theory of government finance states that a fiscal policy is fis-cally sustainable when the government follows an intertemporally balanced budget. In the absence of monetary financing and shocks, the government’s budget constraint in real terms and as a ratio to income can be written as:
(1)
where,
b is the par value of the stock of government debt;
gand t are net of interest government expenditures and tax
re-venue, respectively;
r is the ex post after-tax real rate of interest;
kis the growth rate of income.
As the budget constraint above indicates, the evolution of the debt-income ratio depends mainly on the primary deficit (g – t) and on the product of the accumulated debt-income ratio and the diffe-rence between the rate of interest paid on government’s securities and the growth rate of the economy. If the difference is positive, the government needs a primary surplus to keep the debt/income ratio from rising; if it is negative, the debt/income ratio may be stable even in the presence of some level of primary deficit.1
Assuming no growth and a constant interest rate just for mathema-tical simplicity, applying forward substitution to the budget cons-traint, taking expectations as of time t and applying the limit gives the well-known no-Ponzi scheme condition:
(2)
As we know, the no-Ponzi condition indicates that the government is neither borrowing without collateral nor accumulating excess re-venues that could be used to improve general welfare. Sustainability thus requires that the government debt be offset by expected future primary surpluses of equal present-value.
Empirically, the no-Ponzi condition has been tested in one of two ways: as a cointegrating relationship between revenues and interest inclusive government expenditures or, equivalently, as a mean-rever-ting process for the debt/income ratio series [Hamilton and Flavin (1986), Trehan and Walsh (1988), Wilcox (1989), Hakkio and Rush (1991), Ahmed and Rogers (1995), Uctum and Wickens (2000), amongst others].2
In a stochastic environment, the real return on government bonds commonly used as a discount rate will actually depend on how the overall level of government debt is distributed across states of nature. 3
Bohn (2007) argues that, although mathematically correct, the results used in most empirical work on sustainability restrict the class of admissible alternative stochastic processes “in a way that rules out higher-order integration” [Bohn, (2007) p. 1838]. In fact, the author shows that if the debt series is integrated of any finite order, for any finite m ≥ 0 , it will satisfy the transversality or no-Ponzi condition (equation 2) as long as the real interest rate (net of growth rate in the case above) is positive. This implies that any finite order of integration is compatible with the intertemporal
2 For analysis of the Brazilian case, see for example Rocha (1995), Tanner (1995), Issler and
Lima (1997), Luporini (2000). For a probabilistic treatment of the sustainability of the Brazilian public debt see Mendoza and Oviedo (2004), Tanner and Samake (2008), and Luporini and Licha (2009).
budget constraint. This is so because the discounting factor in (2) is exponential in n while the conditional expectation of an integrated variable of order m will be, at most, a polynomial of order m on the time horizon n. As exponential growth is known to dominate poly-nomial growth of any order, the discount factor in (2) will asymp-totically dominate the expected value of debt. As a result, with a positive real (net of growth) interest rate, the discount factor will tend to zero as n rises and the intertemporal budget constraint will be satisfied for any order of integration of the debt series.
Empirically his proposition means that one should not conclude for compliance or not to the no-Ponzi condition based on unit root and cointegration tests. Yet, a non-stationary debt means that the series does not have an upper bound, which clearly has economic impli-cations for the government´s credibility and its debt management conditions. For instance, Greenlaw, Hamilton, Hooper and Mishkin (2013) have recently developed a model to show how high debt/GDP levels can make governments vulnerable to adverse feedback effects from the higher interest rates required by security holders.
2.1. The iscal reaction function
Given the possible shortcomings of the unit root and cointegration sustainability tests, Bohn (1998, 2005) thus proposes a simple linear fiscal reaction function that ensures sustainability in a variety of stochastic situations. The function consists of searching for evidence of corrective action by the government in response to changes in its debt-income ratio:
(3)
where, st and bt-1 stand for the primary surplus and debt-income
ratios. The “error term” is bounded as a share of income and re-presents other determinants of fiscal surplus.
shock that results in an increase in the debt-income ratio, regardless of its nature, leads eventually to an increase in the primary surplus, ensuring compliance to an intertemporal budget constraint and thus fiscal sustainability.
In order to understand the relationship between the fiscal reaction function and the government´s budget constraint, we may rewrite (1) as:
(4)
where st = tt – gt defines the primary surplus. Combining equation
(4) with the reaction function (3), we may establish a relationship between the government´s fiscal policy and the behavior of the de-bt-income ratio:
(5)
The conditions for debt management depend on what is expected for the debt/income ratio over time. Assuming particular values for the real interest rate (rt = r*) and the economy´s growth rate (kt = k*)
and taking expectations as of time t on (5):
(5')
That is, economic agents will expect the debt-income ratio to rise compared to the previous observed debt-income ratio when , implying . On the other hand, when , implying , agents will expect the debt-income ratio to decline in relation to the previous observed le-vel, improving conditions for debt management. Stabilizing expecta-tions about the debt-income ratio requires that or
and fiscal policy must be such that the fiscal response to a debt increment has to be greater, on average, than the real rate at which the debt-income itself is growing (r – k). In other words, the fiscal reaction has to overcome the positive difference between the real rate of return paid on government securities and the eco-nomy´s growth rate.4
4 This is provided that the economy is operating on the dynamically efficient region. In fact,
3. Corrective policy responses by the Brazilian government
Fiscal sustainability will be analyzed by the relationship between the primary surplus and the debt-income ratio for the consolidated public sector. The evolution of these data for Brazil is presented in Figure 1.
-2 0 2 4 6 8
20 30 40 50 60 70
1992 1994 1996 1998 2000 2002 2004 2006 2008 2010
Surplus Debt Primary Surplus and Net Debt (% of GDP), 1991- 2011
Consolidated Public Sector
Source: Central Bank of Brazil
The primary result indicates surpluses for most of the period ana-lyzed. Between 1991 and the Real Plan of June 1994, the primary result averaged 2.9% of GDP but the fiscal stance deteriorated be-tween 1995 and 1998. As prices stabilized after 1994, the possibil-ity of reducing real government expenditures through inflation to balance the budget was no longer possible and bad budget practices were uncovered. Until 1994, because revenues were price-indexed while expenditures were not, simply delaying payments could help improving the budget. Also during this period, the so-called hid-den liabilities began to be properly included in the government´s accounts, contributing to the deterioration of its fiscal stance.
legislation (Complementary Laws 82/95 and 96/99, known as “Lei Camata” I and II, respectively), already established ceilings on go-vernment payroll (60% of net revenues), the Fiscal Responsibility Law extended the purposes of the “Lei de Diretrizes Orçamentárias” (LDO), which now includes detailed fiscal amendments: “Anexo de Metas Fiscais” and “Anexo de Riscos Fiscais”. The “Anexos” establish targets for the primary surplus and net debt of the consolidated pu-blic sector, based on expected figures for the growth rate of GDP, nominal interest rates and the Real/US Dollar exchange rate for the current and two subsequent fiscal years, and establish criteria to limit expenditures in the event of fiscal revenues being lower than originally expected so that fiscal equilibrium can be guaranteed.
That is, with the Fiscal Responsibility Law (LRF), the budget pro-posed annually by the government (federal and local) in the “Lei Orçamentária Anual” (LOA) must follow not only the priorities established by the “Lei de Diretrizes Orçamentárias” (LDO), but also the fiscal limits established by the LRF. This represented a change in the fiscal regime and resulted in a persistent downward trend for the debt/GDP level since 2002.
This benign evolution of the debt-income level was temporarily in-terrupted by the international crisis of 2008. The effects of the crisis on the overall growth rate of Brazil were relatively mild un-til 2011, in spite of the poor performance of the industrial sector, as active fiscal policy by the federal government kept consumption afloat.
In order to assess fiscal sustainability, we will search for a systematic relationship between the primary surplus and the debt-income ratio by estimating the following regression equation:
(6)
where Xjt is a set of j = 2,…,m control variables that may also influen-ce the government´s surplus, such as the business cycle and debt management actions by the Treasury.
when the government acts counter-cyclically increasing its budget deficits during economic recessions while saving up during periods of economic growth. Empirically, a measure of the economic cycle (ygap) is added to the fiscal reaction function as a control variable. We should expect a positive coefficient if the government follows a tax smoothing policy.
A second control variable (index) used in the estimations is the per-centage of government securities formally indexed to the baseline interest rate, the Selic rate. For a given debt-income level, the higher the relative participation of indexed securities in the total debt, the lower the market´s appetite for securities sold at a discount (nominal securities). This would in turn require a higher fiscal response by the government in order to increase fiscal credibility and improve the conditions for debt management.
For the fiscal policy, as previously discussed, the government may be considered fiscally sustainable if the coefficient on the debt-income ratio, , is strictly positive. We will first investigate the average fiscal response followed by the Brazilian government during the period and then we will investigate how it has changed over time. A time-varying fiscal response has the advantage of allowing for possible changes in fiscal regime without having to establish, endogenously or exogenously, specific periods for structural breaks.
The method of estimation depends on the stochastic nature of the data. The output gap, calculated as deviations of output from a ho-drick-prescott filter, and the relative participation of indexed securi-ties on total debt are stationary by construction. Results for unit root tests are presented in Table 1.
Table 1: Unit Root and Stationarity Tests a/
Variable ADFb/ ADF-GLS KPSS
st I(1) I(1) I(0)
bt I(1) I(1) I(1)
a/ ADF (Augmented Dickey-Fuller) and ADF-GLS (Generalized Augmented Dickey-fuller Test); KPSS (Kwiatkowski, Phillips, Schmidt and Shin, 1992, stationarity test).
The unit root tests indicate that both the primary surplus and the net public debt may have stochastic trends (are integrated of order 1). As such, the search for a sustainable relationship between the primary surplus and the public debt will rely on a possible cointegrating vector relating these two fiscal variables. Cointegration tests are presented in Table 2.
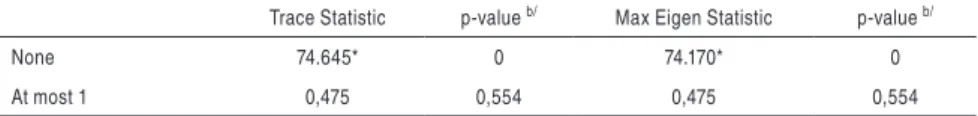
Table 2: Cointegration tests a/
Trace Statistic p-value b/ Max Eigen Statistic p-value b/
None 74.645* 0 74.170* 0
At most 1 0,475 0,554 0,475 0,554
a/ s and b endogenous, allowing for a constant term in the cointegrating vector and VAR. No exogenous variables included to control for possible bias in the results as critical values assume no exogenous variables.
b/ MacKinnon, Haug and Michelis (1999) p-values, Eviews- version 7.1.
As Table 2 indicates, both the trace and maximum eigenvalue cointe-gration tests reject the null of no cointecointe-gration and do not reject the presence of one cointegrating relation between the primary surplus and the debt-income ratio.
When the variables are cointegrated, the coefficients may be esti-mated using a system of equations (vector error correction model proposed by Johansen, 1991) or a single equation model (Banerjee, Dolado, Galbraith, and Hendry, 1993). Johansen´s method departs from a vector auto regression system (VAR) and jointly estimates both the cointegrating vector (the long run relation between the va-riables) and the parameters of the error correction vector (temporary deviations from the long run relation); as such, Johansen´s method is asymptotically more efficient than single equation methods. But VAR systems are known for their sensitivity to alternative specifi-cation and instability in finite samples, which makes single equation models more attractive in finite sample contexts.
a) The average iscal response of the Brazilian government
As discussed previously, a fiscally sustainable policy implies a posi-tive coefficient on the debt-income ratio indicating correcposi-tive mea-sures in the primary surplus. What has been the average fiscal res-ponse by the Brazilian government to variations in the debt-income ratio over the period 1991 through 2011?
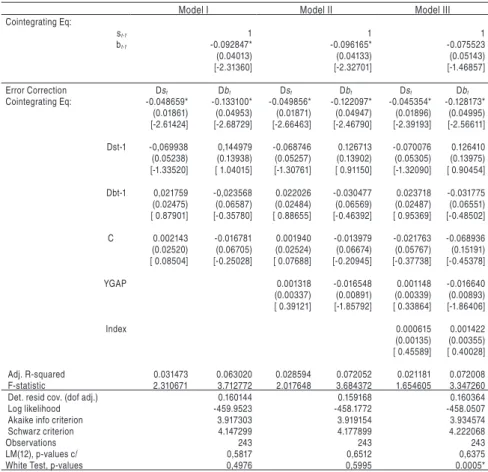
To answer this question we estimate the cointegrating vector implied by equation (6) using both, the Johansen´s method (the vector error correction model), and the uniequational method (results not repor-ted). The results for the cointegrating vector are reported in Table 3 below. The results for the long-run relationship between the fiscal variables as shown in the cointegrating equation ( ) indica-te a positive and sysindica-tematic response of the primary surplus to the debt-income ratio, suggesting a sustainable fiscal policy. According to Models I and II, a 1 percent increase in the debt-GDP ratio can be associated with an average increase in the primary surplus of appro-ximately 0.09% of GDP. Coefficients are positive and statistically significant.
In Model III, the percentage of government securities formally in-dexed to the baseline interest rate, (index), is included as a control variable. As discussed earlier, the higher the relative participation of indexed securities, the lower the market´s willingness to hold nominal securities, and the higher should be the government´s fiscal response. Results for Model III do not suggest that indexed securi-ties have been important for the fiscal reaction function or to the short-term dynamics of the primary surplus as a ratio to income as the cointegration coefficient, as well as the coefficient on the index variable, are not statistically significant.
primary surplus in the next period so that its value tends to return to its long term estimated equilibrium.
Similarly, if a shock induces a surplus below the long-term rela-tionship with the debt-income ratio, there will be a compensating positive change in the surplus-income ratio. In fact, one percentage point deviation from the estimated long-term surplus-debt relation induces, approximately, a 0.05 percentage point correction in the primary surplus. Cyclical variations in output (Models II and III) and the relative participation of indexed securities (Model III) were not statistically significant.
Table 3: Vector Error Correction Estimates a/d/
Model I Model II Model III
Cointegrating Eq:
st-1 1 1 1
bt-1 -0.092847* -0.096165* -0.075523
(0.04013) (0.04133) (0.05143) [-2.31360] [-2.32701] [-1.46857]
Error Correction Dst Dbt Dst Dbt Dst Dbt
Cointegrating Eq: -0.048659* -0.133100* -0.049856* -0.122097* -0.045354* -0.128173* (0.01861) (0.04953) (0.01871) (0.04947) (0.01896) (0.04995) [-2.61424] [-2.68729] [-2.66463] [-2.46790] [-2.39193] [-2.56611]
Dst-1 -0,069938 0,144979 -0.068746 0.126713 -0.070076 0.126410 (0.05238) (0.13938) (0.05257) (0.13902) (0.05305) (0.13975) [-1.33520] [ 1.04015] [-1.30761] [ 0.91150] [-1.32090] [ 0.90454]
Dbt-1 0,021759 -0,023568 0.022026 -0.030477 0.023718 -0.031775 (0.02475) (0.06587) (0.02484) (0.06569) (0.02487) (0.06551) [ 0.87901] [-0.35780] [ 0.88655] [-0.46392] [ 0.95369] [-0.48502]
C 0.002143 -0.016781 0.001940 -0.013979 -0.021763 -0.068936 (0.02520) (0.06705) (0.02524) (0.06674) (0.05767) (0.15191) [ 0.08504] [-0.25028] [ 0.07688] [-0.20945] [-0.37738] [-0.45378]
YGAP 0.001318 -0.016548 0.001148 -0.016640 (0.00337) (0.00891) (0.00339) (0.00893) [ 0.39121] [-1.85792] [ 0.33864] [-1.86406]
Index 0.000615 0.001422
(0.00135) (0.00355) [ 0.45589] [ 0.40028]
Adj. R-squared 0.031473 0.063020 0.028594 0.072052 0.021181 0.072008 F-statistic 2.310671 3.712772 2.017648 3.684372 1.654605 3.347260 Det. resid cov. (dof adj.) 0.160144 0.159168 0.160364
Log likelihood -459.9523 -458.1772 -458.0507
Akaike info criterion 3.917303 3.919154 3.934574
Schwarz criterion 4.147299 4.177899 4.222068
Observations 243 243 243
LM(12), p-values c/ 0,5817 0,6512 0,6375
White Test, p-values 0,4976 0,5995 0.0005*
a/ Estimation assumed a constant term in the VAR system; Dummies (2001m12, 2002m11, 1991m12) included to control for Central Bank primary surplus series.(*) Indicates significance at the 5% level, asymptotic critical value of 1.96.
b) Fiscal Reaction Over Time
The results above indicated that a 1 percent increase in the debt-GDP ratio can be associated with an average increase in the primary surplus of approximately 0.09% of GDP. But how has the fiscal response changed over the period analyzed?
In order to answer this question, we estimate a rolling regression equation (6) with a one observation step and a sample-window of 12 observations. Equation (6) involves the primary surplus and the debt -income ratios (both with stochastic trends) and stationary variables used as controls. As indicated in Sims, Stock, and Watson (1990) and Banerjee et. alli (1993), regressions involving a set of cointegra-ted variables along with stationary variables may be consistently estimated by OLS and inference on the coefficients can be made based on standard t tests (Hamilton, 1994).5 The evolution of the fiscal response by the Brazilian government is displayed in Figure 2.
The values for the fiscal parameter observed in the graph repre-sent the rolling regression coefficients over a 12-month window, so that each point estimated actually reflects the fiscal response for the 12-month period ahead. We observe a high variation of the fiscal parameter during the high inflation period (1991:01 through 1994:06) and the collapse of the crawling-peg regime in January of 1999. Along with the fiscal efforts implemented by the government after 1999 and the approval the Fiscal Responsibility Law in 2000, we observe an improvement in the fiscal response to debt.
Fiscal reaction becomes weaker but relatively stable after 2001; it increases again during 2005 and reaches a high 0.4% for the point estimated for September of that year, reflecting the fiscal policy of 2006. After that, the fiscal parameter became more volatile and assumed a declining trend. There is indication of a change in the fis-cal regime after 2000. These results are in line with those obtained by de Mello (2005) and by Mendonça, Santos and Sachsida (2009). More recently, using dummy variables in the analysis of fiscal reac-tion funcreac-tions for Brazil, Simonassi (2013) estimates two probable structural breaks, in may/1994 and February/2003.6
5 The program for the rolling regressions is available from the authors uppon request (Eviews 7.1). 6 In fact, we adjusted the sample to the one used by Simonassi (2013) and obtained similar
-3.0 -2.0 -1.0 0.0 1.0 2.0
1991 1992 1993 1994 1995 1996 1997 1998 1999 2000 2001 2002 2003 2004 2005 2006 2007 2008 2009 20102011
Source: Author´s calculations based on data from Banco Central do Brasil. a/ Twelve-month rolling regressions
-1.6 -1.2 -0.8 -0.4 0.0 0.4 0.8 1.2 1.6
19911992 1993 1994 1995199619971998 1999 2000200120022003 2004 2005 2006200720082009 20102011
Fiscal Reaction Parameter Over Time: 1991-2011 a/
Primary surplus response to indebtdness
As previously discussed, stabilizing the debt-income ratio requires that the fiscal reaction parameter overcome the positive difference between the real rate of return paid on government securities and the economy´s growth rate. Obtaining an empirical counterpart of the rate paid on government debt is not easy, as it reflects the distribution of securities over different maturities and indexation clauses. Ideally, this rate should also be net of taxes, complicating even more an empirical measurement. But, in order to have a rough idea about the relationship between the fiscal parameter and (r – k), we consider a real interest rate of about 2% and a growth rate of 1,5%. Debt would then increase, ceteris paribus, at 0.5% over GDP. According to the estimations, for an increase of debt by 1% of GDP (or, equivalently, one percentage point over GDP), the primary surplus has responded, on average, by 0.09% of GDP and we may conclude that the average fiscal reaction has been 0.49 percentage points short of the necessary for stabilizing debt-income ratio expectations. That is, although a strictly positive fiscal reaction is indicative of a sustainable fiscal policy, the average fiscal reaction may not be sufficient to overturn expectations of a higher debt-income ratio in the near future.
3.1 Recent iscal response and gross public debt
30 40 50 60 70 80 90
20012002 2003 2004 2005 2006 2007 2008 2009 2010 2011 2012 2013
Gross Debt (standard methodology) Gross Debt (new methodology) Net Debt
Gross and Net Public Debt (% of GDP), 2001- 2013 a/
a/ Debt series 4537 and 13762. "New methodology" excludes Central Bank securities used for monetary policy and other items; "standard" is the measure used by international institutions.
Source: Central Bank of Brazil
A simple (OLS) estimation of the fiscal reaction function to the gross (standard) measure of the debt-income ratio suggests a weaker reaction parameter for the gross debt measure:7
st = -0.0237 + 0.0469 bt-1 GROSS + 0.1155 ygapt-1
Prob (tHAC_statistic) (0.0125) (0.0163)
Adjusted R2 = 0.165 Prob (F-statistic) = 0.000005
st = 0.4405 + 0.0595 bt-1NET + 0.1003 ygapt-1
Prob (tHAC_statistic) (0.0000) (0.0267)
Adjusted R2 = 0.398 Prob (F-statistic) = 0.000000
7 Ordinary Least Squares estimation using monthly data from 2003m02 through 2013m09.
While the average fiscal response to the net measure of the debt was 5.95 basis points over GDP, the average response to the gross measure, for the same period, was 1.26 basis points lower or 4.69. Although the recent period deserves a more detailed analysis, the results suggest a different behavior of the fiscal reaction function to the gross measure of the government debt.
4. Final remarks
Fiscal targets have become an important part of the Brazilian go-vernment´s budgetary process and accountability. In this paper, we provided estimates of the fiscal reaction function of the Brazilian government and we present evidence of a fiscally sustainable policy defined as a (strictly) positive response of the primary surplus to increases in the debt-income level. Using monthly data, the paper analyses both the average fiscal response of the primary surplus to variations of the government public debt and the evolution of the fiscal reaction function through time, controlling for cyclical varia-tions in output and the relative participation of floating rate indexed debt. A time-varying fiscal response has the advantage of allowing for possible changes in fiscal regime without having to establish, endogenously or exogenously, specific periods for possible structural breaks.
Specifically, we answered two questions:
a) what has been the average fiscal response of the Brazilian
government to variations in its public debt? And,
b) how has the Brazilian fiscal response behaved over time?
Analyzing the evolution of the fiscal response through time, we find that the policy became more stable after the year 2000, but less responsive to the debt-income level. Fiscal response seems to have assumed a declining trend after 2006. Our results are in line with those previously obtained by the literature.
More recently, the Brazilian government has issued securities to transfer resources to the federal owned banks in order to foster their capacity to offer credit lines to much needed housing and in-frastructure projects. These operations do not alter the short term net liability position of the consolidated public sector or its net debt, but alter the gross measure of the government debt. A simple esti-mation of the fiscal reaction function suggests that the recent fiscal response has been, on average, weaker when the gross measure of the debt is used in the estimations. If this result resists a more detailed analysis, it will imply that fiscal policy has been more expansionary than the net debt measure might suggest. One of the consequences is that a weak fiscal response to a relatively high (gross) debt-income level, in a context of rising inflationary expectations and low output growth, significantly reduces the choices available to the monetary authorities and further complicates a future fiscal consolidation plan.
References
AHMED S. & ROGERS J. (1995). Government budget deicits and trade deicits: are present value
constraints satisied in long-term data? Journal of Monetary Economics 36:351-374.
BANERJEE, A., DOLADO, J.J., GALBRAITH, J.W. AND HENDRY, D.F. (1993):Co-integration, Error Correction, and the Econometric Analysis of Non-Stationary Data. Oxford: Oxford University Press. BICALHO, A. (2005). Teste de sustentabilidade e ajuste iscal no Brasil Pós-Real. Master Thesis,
EPGE/FGV, Rio de Janeiro.
BOHN, H. (1998). The behavior of U.S. public debt and deicits. The Quarterly Journal of Economics
113(3).
BOHN, H. (2005).The sustainability of iscal policy in the United States, CESifo Working Paper
Series 1446, CESifo Group Munich.
BOHN, H. (2007). Are stationarity and cointegration restrictions really necessary for the intertemporal budget constraint?. Journal of Monetary Economics 54: 1837-1847.
DE MELLO, L. (2005). Estimating a iscal reaction function: the case of debt sustainability in Brazil. OECD Economics Department Working Papers, n. 423.
GIAMBIAGI, F. and M. RONCI (2004): Fiscal Policy and Debt Sustainability: Cardoso’s Brazil, 1995-2002, IMF Working Paper WP/04/156, Washington, D.C.
HAKKIO, C. & RUSH M. (1991). Is the budget deicit ‘too large’? Economic Inquiry 39 (July):429-445.
HAMILTON, J. (1994). Time Series Analysis. Princeton: Princeton University Press.
HAMILTON, J. & FLAVIN, M. (1986). On the limitations of government borrowing: a framework for
empirical testing. The American Economic Review 76(4):809-19.
HAYASHI, F. (2000). Econometrics. Princeton: Princeton University Press.
ISSLER, J. V. AND LIMA, L. R. (2000). “Public Debt Sustainability and Endogenous Seigniorage in
Bra-zil: Time Series Evidence from 1947-1992”. Journal of Development Economics, v.62, 131-147.
JOHANSEN, S. (1991). “Estimation and hypothesis testing of cointegrated vectors in Gaussian VAR
models.” Econometrica, 59 (6): 1551-1580.
LIMA, L. R. and SIMONASSI, A. G. (2005). “Dinâmica não-linear e sustentabilidade da dívida pública
brasileira”. Pesquisa e Planejamento Econômico, v. 35(2).
LUPORINI, V. (2000). “Sustainability of the Brazilian iscal policy and central bank independence”. Revista Brasileira de Economia, v.54(2).
______ (2002). "The behavior of the Brazilian federal domestic debt". Revista de Economia Aplicada,
6:713–733.
LUPORINI, V. and A. LICHA (2009). “Espacio iscal para el crecimiento em Brasil”, in J. Fanelli (org.) Espacio Fiscal para el crecimiento el Mercosur. Red Mercosur de Investigaciones Económicas, Zonalibro, Uruguay.
MENDONÇA, M., C. SANTOS and A. SACHSIDA (2009). Revisitando a função de reação iscal no
Brasil pós-Real: uma abordagem de mudanças de regime. Estudos Econômicos vol. 39(4): 873-894.
MENDOZA, E. and P. OVIEDO (2004). “Public debt, iscal solvency and macroeconomic uncertainty in Latin American: the case of Brazil, Colombia, Costa Rica and Mexico.” NBER, Working Paper 10637.
ROCHA, F. (1995). Monetary regimes and macroeconomic policy: an empirical analysis of the Brazilian
economy. PhD Dissertation, University of Illinois at Urbana-Champaign.
SIMONASSI, A. (2013). Reação iscal sob mudanças estruturais e a solvência da economia brasileira.
Mimeo, CAEN/UFC.
SIMS, Christopher A., JAMES H. Stock, and Mark W. WATSON. 1990. Inference in Linear Time Series
Models with Some Unit Roots. Econometrica 58 (1): 161–82.
TANNER, E. (1995). Intertemporal solvency and indexed debt: evidence from Brazil, 1976-1991. Journal of International Money and Finance, 14 (4): 549-73.
TANNER, E. and I. SAMAKE (2008). “Probabilistic sustainability of public debt: a vector autoregression
approach for Brazil, Mexico, and Turkey” IMF Staff Papers, vol. 55 n. 1.
TREHAN, B. & WALSH, C. (1991). Testing intertemporal budget constraints: theory and applications
to U.S. federal budget and current account deicits. Journal of Money, Credit, and Banking
23(2):206-23.
UCTUM, M. and M. WICKENS (2000). “Debt and deicit ceilings, and the sustainability of iscal policies: an intertemporal analysis.” Oxford Bulletin of Economics and Statistics, 62(2).
UCTUM, M., T. THURSTON and R. UCTUM (2006). “Public debt, the unit rood hypothesis and
structural breaks: a multi-country analysis”. Economica 73: 129-156.
WILCOX, D. (1989). The sustainability of government deicits: implications of the present-value
Appendix:
DATA SET:
Monthly data, 1991:01 – 2013:08.
S : Surplus is the negative of the Borrowing Requirements of the Public Sector (% of GDP) – Resultado Primário
Source: Central Bank of Brazil, series 17127 and 5364.
17127 - NFSP sem desvalorização cambial (% PIB) - Fluxo mensal corrente - Resultado primário - Total –
Setor público consolidado com Petrobras - %
5364 - NFSP sem desvalorização cambial (% PIB) - Fluxo mensal corrente - Resultado primário - Total –
Setor público consolidado - %
B: Net Public Debt of the Consolidated Public Sector (% of GDP), Gross general government debt (% GDP)
Source: Central Bank of Brazil, series 4513, 4537 and 13762.
4513 – Net publicdebt (% GDP) - Total – Consolidated public sector - %
4537 - Gross general government debt (% GDP) - Method used until 2007 - %
13762 - Gross general government debt (% GDP) - Method used since 2008 - %
Ygap: Deviations from a hendrick-prescott filter applied to industrial production index (quantum)
Source: Central Bank of Brazil, 11064
Index: Relative participation of interest Indexed federal securities
Source: Central Bank of Brazil, via Ipeadata (www.ipeadata.gov.br), series
Títulos - federais - indexados à Over / Selic - fim período - (%) –
Banco Central do Brasil, Boletim, Seção Finanças Públicas (BCB Boletim/F. Públ.) - BM12_TPFOVER12
Títulos - federais - indexados à Over / Selic - mercado aberto - fim período - (%) – Banco Central do Brasil, Boletim, Seção Finanças Públicas (BCB Boletim/F. Públ.) -
BM12_TPFOVERMA12
R: Real interest rate (Selic – IPCA inflation)
Taxa de juros - Over / Selic - (% a.m.) - Banco Central do Brasil, Boletim,
Seção mercado financeiro e de capitais (BCB Boletim/M. Finan.) - BM12_ TJOVER12
Inflação - IPCA - (% a.m.) - Instituto Brasileiro de Geografia e Estatística, Sistema Nacional de Índices de Preços ao Consumidor (IBGE/SNIPC) - PRECOS12_
IPCAG12
IBC-Br: Economic Activity Index (Central Bank)
Source: Central Bank of Brazil, via Ipeadata (www.ipeadata.gov.br), series
Índice de Atividade Econômica do Banco Central (IBC-Br) - dessazonalizado (2002=100) –