Ten-year trends in prevalence of asthma in
adults in southern Brazil: comparison of two
population-based studies
Dez anos de evolução da prevalência de asma
em adultos, no Sul do Brasil: comparação de dois
estudos de base populacional
1 Programa de Pós-graduação em Epidemiologia, Universidade Federal de Pelotas, Pelotas, Brasil. 2 Faculdade de Medicina, Universidade Federal de Pelotas, Pelotas, Brasil.
Correspondence N. S. Fiori
Programa de Pós-graduação em Epidemiologia, Universidade Federal de Pelotas.
Rua Marechal Deodoro 1160, 3o piso, Pelotas, RS 96020-220, Brasil. [email protected]
Nadia Spada Fiori 1 Helen Gonçalves 1,2 Samuel C. Dumith 1
Maria Aurora Dropa Chrestani Cesar 1,2 Ana M. B. Menezes 1,2
Silvia Elaine Cardozo Macedo 1,2
Abstract
There are discrepancies in the literature regard-ing time trends in the occurrence of asthma in adults. This study compared asthma prevalence in two cross-sectional studies with a ten-year in-terval in Pelotas, Rio Grande do Sul State, Brazil. The first, in 2000, included 1,968 individuals, and the second, in 2010, 2,466 adults (20-69 years). Prevalence of wheezing and shortness of breath in the prior 12 months remained the same after ten years (6% and 6.1%, respectively). In both studies, asthma was more frequent among fe-males and people with low family income. Physi-cian-diagnosed asthma increased by 35.6%, and lifetime incidence of asthma, by 32.2%. There was no percentage change in current asthma symp-toms or current asthma. Local socioeconomic improvement between the two studies was con-sistent with the increase in medical diagnosis, but did not reflect better management of asthma symptoms, underlining the need for investment regarding other determinants of the disease.
Asthma; Adult; Prevalence; Cross-Sectional Studies
Introduction
Asthma affects about 300 million individuals worldwide, and some 250,000 die as a result of it 1. The asthma burden, when measured in disabili-ty-adjusted life years lost, represents 1% of total world disease burden, and costs an estimated
€15 million per year 2. The social and individual impact of this disease is also reflected in absen-teeism at work and at school, and in diminished quality of life of the ill and their relatives 1,3. Ac-cording to the Pan American Health Organiza-tion (PAHO) 4, asthma affects around 15 million in Brazil and is responsible for about 350,000 hospital admissions a year (Departamento de In-formática do SUS. Informações de saúde. http:// www.datasus.gov.br).
In recent decades, it has been considered one of the world’s most common non-communicable chronic diseases, although its prevalence is re-ported in the literature as varying considerably in the general population (1% to 18%) 1. That
varia-tion probably results from the use of different diagnostic criteria and from geographical and climatic differences among countries 1,5.
that age group, recent epidemiological studies have recorded a decline in the prevalence of asth-ma in Eastern Europe and in North America 1, while others suggest there has merely been stabi-lization in those regions 10,11. In the second
mil-lennium, asthma symptoms have declined in the adult population of high-income countries 10,11, but no conclusive data are available for low- and middle-income countries 2.
Estimates of how the prevalence of the dis-ease is evolving in adults are made by comparing among studies or by using approximations based on other records, such as data for hospital admis-sions for diseases of the respiratory system.
One of the few published population-based studies to investigate this disease in adults in Bra-zil was conducted 10 years ago in Pelotas, a medi-um-sized town in Rio Grande do Sul State. In this city, the prevalence of asthma symptoms was 6% in 2000 12. That same year, 43 in 100,000 adults were hospitalized for asthma. In 2009, the rate had decreased to 7 (Departamento de Informáti-ca do SUS. Informações de saúde. http://www. datasus.gov.br). In view of the available data, it can be asked, for example, whether the reduction in morbidity from asthma has been accompa-nied by a reduction in its prevalence.
Know the prevalence of asthma and its evolu-tion over the years is important for health ser-vice planning, and can serve as a tool in evalu-ating measures introduced in the local’s health systems. This article compares the prevalence of asthma in adults in Pelotas over a 10-year interval.
Methodology
This study analyzes the prevalence of asthma as compared with the study conducted by Macedo et al. 12 in 2000 as part of a broader project titled Sistema de Base Populacional para Monitoração da Prevalência e Fatores de Risco para Doenças Crônico-Degenerativas (DCG) entre Adultos de Pelotas, RS [Population-based Monitoring Sys-tem for Prevalence of Chronic-degenerative Dis-ease Risk Factors among Adults in Pelotas, Rio Grande do Sul State].
Both studies were conducted in the munici-pality of Pelotas, which – with a population of about 345,000 – is considered the third most populous city in the state (Instituto Brasileiro de Geografia e Estatística. Censo Demográfico 2000. http://www.ibge.gov.br). The two studies were population-based, cross-sectional, and occurred in months with similar climatic conditions (Sum-mer and Autumn). In 1999-2000 the interviews took place from December 1999 to April 2000, and in 2010, from January to May. In both studies,
sampling was by a two-stage systematic prob-ability strategy, but in 1999-2000 more domiciles were chosen in fewer census tracts. There were then 258 urban tracts, 40 of which were selected, and the residents at 30 domiciles in each tract were interviewed. Ten years later the town had grown, and the Brazilian Institute of Geography and Statistics (Instituto Brasileiro de Geografia e Estatística. Censo Demográfico 2000. http:// www.ibge.gov.br) specified 404 urban tracts, 130 of which were selected, and 10 domiciles in each tract were visited.
All 20 to 69 year old residents of the selected domiciles were considered eligible, although the present study excluded individuals who were in-stitutionalized or had some kind of mental and/ or physical disability.
The samples were calculated in the same fashion in both studies. Asthma was determined on the basis of 5% prevalence, one percentage point acceptable error, and 95% confidence in-terval. Ten percent was added for losses and re-fusals, which resulted in a sample of 2,004 indi-viduals. This study also took account of a sample design effect estimated at 1.5. For studying the associations, the sample size obtained for calcu-lating the prevalences permitted a prevalence ra-tio of 1.5, for exposure odds of one, assuming 80% power and 95% confidence interval.
In both studies the interviews were conduct-ed at participants’ domiciles; in the first, howev-er, using printed questionnaires, while in the sec-ond, small portable computers – Palm Tungsten TX PDAs. Interviewers were specially recruited and trained from among, in 2000, medical stu-dents from Pelotas Federal University (Univer-sidade Federal de Pelotas – UFPel) and, in 2010, women at least 18 years old who had completed high school. In both studies, weights and heights were measured and not self-reported, for which purpose specific groups were trained and stan-dardized, and then periodically underwent fur-ther standardization until field work was com-pleted. The quality of the information collected was verified by the supervisors of both studies by reapplying a simplified questionnaire to 10% of the participants.
The questionnaire used in the 2000 study 12
to 14 years, and the ECRHS II 5,13, although not
validated in Brazil, has been replicated in several studies of 20 to 44 year old adults. Except for one question, which was adapted, the others used in the present study were identical to those of the 2000 questionnaire. The question of “Nos últimos 12 meses, o Sr(a). teve essa crise de falta de ar? Se sim, quantas vezes?” [Have you had this attack of shortness of breath at any time in the last 12 months? If yes, how many times?] was reformu-lated to “Nos últimos 12 meses, quantas crises de falta de ar o(a) Sr(a). teve?” (How many attacks of shortness of breath have you had in the last 12 months?).
The independent variables collected in both studies were: sex (male and female); age (in com-plete years); self-reported skin color by IBGE cat-egories (white, black, brown, yellow and indige-nous); family income in the past month (in mini-mum wages – MW); tobacco use (non-smoker, smoker, and former smoker); body mass index (BMI) 14 calculated from the height and weight measurements.
The dependent variables were replicated from Macedo et al. 12 and described different
diagno-ses of asthma: cumulativeasthma (self-report of lifetime asthma); medical diagnosis (self-report of asthma diagnosed by a physician in lifetime); current asthma (self-reported asthma in the last 12 months); current symptoms (self-report of si-multaneous episodes of dyspnea and whistling in the past 12 months).
The two studies used the variable “current asthma symptoms” in order to examine the as-sociation between asthma and the independent variables. The dataset of the 2000 study was re-examined to permit new analyses in line to the hierarchical model proposed in 2010. In the descriptive analysis, the data were presented in terms of prevalence and 95% confidence inter-val (95%CI). Poisson regression was used for the crude and adjusted analyses (in 2010, consider-ing the design effect). The adjusted analysis was conducted at two levels of causality: at the first level, including demographic variables and eco-nomic status and, at the second, tobacco use and BMI. Data were analyzed using Stata 10.0 (Stata Corp., College Station, USA), with a 5% level of significance for two-tailed tests.
The study was approved by the research eth-ics committee of the school of medicine at UFPel, and the interviews were conducted with the par-ticipants’ consent.
Results
In 2000, 1968 people from 20 to 69 years old were interviewed and, in the present study, 2466. Both studies visited about 1200 domiciles. The loss-es and refusals were 10.7% in 2010, and slightly higher among men than among women (5.8% and 4.2%, respectively). In the study by Macedo et al. 12 the rate was 9.6%.
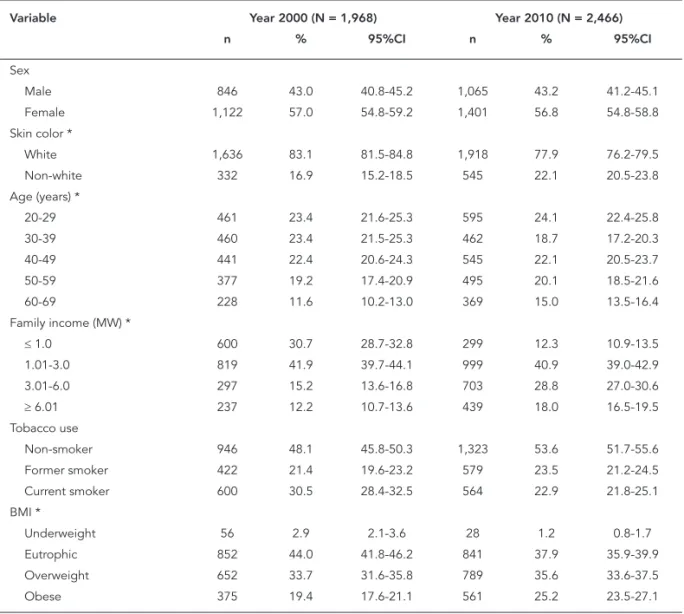
Table 1 describes the study populations in terms of demographic characteristics, economic class, tobacco use and BMI. In both 2000 and 2010, a majority of participants were women, white-skinned, non-smokers, with BMI of 25kg/ m2 or higher, and family income from 1.01 to 3.0 MWs. The sample distributions were also simi-lar, the main differences between them being the higher proportion of smokers in 2000 (30.5% vs. 22.9% in 2010), of people with family income of less than one MW (30.7% in 2000; 12.3% in 2010), and with higher than normal BMI in 2010 (53.1% in 2000; 61% in 2010).
Figure 1 shows the prevalences of the di-agnostic criteria in both studies. In 2010, there was a 32.2% increase in the prevalence of life-time asthma (14.3% in 2000; 18.9% in 2010) and 35.6% in medical diagnosis (12.9% in 2000; 17.5% in 2010), as compared with the 2000 study (both with p < 0.001). However, no difference was re-turned by the criteria for current asthma (4.2% in 2000; 5.2% in 2010) or in asthma symptoms (6% in 2000; 6.1% in 2010).
Prevalence of current asthma symptoms in the present study was 6.1% (95%CI: 5.1-7.0), very close to the finding of the previous study (6%; 95%CI: 5.0-7.1). Table 2 shows the distribution of the prevalence of current asthma symptoms by demographic and behavioral factors and eco-nomic level in the two studies. It is clear that, 10 years later, the prevalence of asthma symptoms continues greater in the female sex, in people of non-white skin color and with family income of less than one MW. However, there are divergenc-es in the prevalence of asthma by age range: in 2000, it was greater among the 60 to 69 year olds (10.1%), and had diminished by 56% in this age group by 2010 (4.4%), when prevalence was high-est (7%) in 50 to 59 year old age group.
decreased about 35% among former smokers. In 2010, prevalence of asthma symptoms among obese women smokers was 22.2%, and the likeli-hood of their having asthma symptoms was 8.3 times greater than for non-smoking, non-obese men (95%CI: 3.1-22.3).
Table 3 shows the crude and adjusted analysis of the association, in both studies, between asth-ma symptoms and demographic, behavioral and anthropometric factors, and economic status. In 2000, a crude association was found between cur-rent asthma symptoms and female sex, age from 60 to 69 years old, white skin color, low family income, tobacco use, and low BMI. In that same study, although skin color and BMI lost statisti-cal significance after adjusted analysis, a higher prevalence ratio (PR) persisted for asthma symp-toms in individuals with low BMI (< 18.5kg/m2).
10 years later, the bivariate and adjusted analyses were in agreement on the association between asthma symptoms and female sex, low family in-come, current tobacco use, and obesity.
Discussion
In comparing with the results found 10 years ago for the prevalence of asthma and its association with risk factors, using identical methodology and diagnostic criteria, the present study high-lights three key results. Firstly, medical diagnoses of asthma increased by 35.6%, and the prevalence of lifetime asma, by 32.2%, both statistically sig-nificant increases (p < 0.001).
The second important result was there being no percentage variation in the other two diag-Table 1
Demographic, socioeconomic, behavioral and anthropometric characteristics of the populations studied, by study year. Pelotas, Rio Grande do Sul State, Brazil.
Variable Year 2000 (N = 1,968) Year 2010 (N = 2,466)
n % 95%CI n % 95%CI
Sex
Male 846 43.0 40.8-45.2 1,065 43.2 41.2-45.1
Female 1,122 57.0 54.8-59.2 1,401 56.8 54.8-58.8
Skin color *
White 1,636 83.1 81.5-84.8 1,918 77.9 76.2-79.5
Non-white 332 16.9 15.2-18.5 545 22.1 20.5-23.8
Age (years) *
20-29 461 23.4 21.6-25.3 595 24.1 22.4-25.8
30-39 460 23.4 21.5-25.3 462 18.7 17.2-20.3
40-49 441 22.4 20.6-24.3 545 22.1 20.5-23.7
50-59 377 19.2 17.4-20.9 495 20.1 18.5-21.6
60-69 228 11.6 10.2-13.0 369 15.0 13.5-16.4
Family income (MW) *
≤ 1.0 600 30.7 28.7-32.8 299 12.3 10.9-13.5
1.01-3.0 819 41.9 39.7-44.1 999 40.9 39.0-42.9
3.01-6.0 297 15.2 13.6-16.8 703 28.8 27.0-30.6
≥ 6.01 237 12.2 10.7-13.6 439 18.0 16.5-19.5
Tobacco use
Non-smoker 946 48.1 45.8-50.3 1,323 53.6 51.7-55.6
Former smoker 422 21.4 19.6-23.2 579 23.5 21.2-24.5
Current smoker 600 30.5 28.4-32.5 564 22.9 21.8-25.1
BMI *
Underweight 56 2.9 2.1-3.6 28 1.2 0.8-1.7
Eutrophic 852 44.0 41.8-46.2 841 37.9 35.9-39.9
Overweight 652 33.7 31.6-35.8 789 35.6 33.6-37.5
Obese 375 19.4 17.6-21.1 561 25.2 23.5-27.1
Figure 1
Prevalence of asthma, 2000-2010, by different diagnostic criteria, by study year. Pelotas, Rio Grande do Sul State, Brazil.
0 %
2 4 6 8 10 12 14 16 18 20
Medical diagnosis Lifetime ashtma Current symptoms Current ashtma Diagnostic criteria 2000 (N = 1,968)
2010 (N = 2,466)
* p < 0.001.
nostic criteria used: current asthma symptoms (6.1%) and current asthma (5.2%).
The third finding shows that female sex con-tinued associated with current asthma symp-toms (PR = 1.71; 95%CI: 1.22-2.40), while the as-sociations with tobacco use (PR = 2.05; 95%CI: 1.43-2.95) and obesity (PR = 1.80; 95%CI: 1.24-2.62) have become significant. In 2000, there was association with former smokers and low BMI.
The increase in medical diagnosis of asthma and in the prevalence of lifetime asthma have been described in other studies 7,8,9,15,16. For
ex-ample, surveys conducted in the United King-dom in three different years (1990, 1992 and 1998) detected increases in the prevalence of lifetime asthma (16%, 20% and 21%, respectively) and asthma diagnosed by a physician (12%, 17% and 18%, respectively) 9. Some authors suggest that these differences result from the population’s in-creased knowledge of the symptoms of asthma, and from increased availability of physicians to make the diagnosis 7, rather than from the dis-ease’s increased prevalence.
The differences found in the current study in the prevalence of medical diagnosis and of lifetime asthma may be related to substantial changes in the local population. Over the past seven years, according to population studies per-formed in the city, there was an improvement in economic status of the population, with migra-tion from economic classes D and E to class C 17. This economic improvement may permit greater access to health information and services, as has
occurred elsewhere. The population studied may, thus, have received more diagnoses and informa-tion about the disease, which would account for the increase in self-reported lifetime asthma.
One salient result in 2010, was that the occur-rence of asthma symptoms had not diminished despite improvement in important determinant factors, such as socioeconomic status and to-bacco use in the city. Socioeconomic develop-ment can bring families to learn more about the disease and its management, in addition to enabling them to afford treatment. Also, gradual reduction of exposure to the toxic components of tobacco smoke would be expected to reduce the occurrence of asthma. These two factors jointly have a positive influence in reducing attacks of wheezing and shortness of breath. However, it is possible that variations in the prevalence of atopy and environmental pollution (which were not evaluated in this study), together with in-creasing overweight/obesity, may have offset the reduction in symptoms that might be expected to result from reduced tobacco use and socioeco-nomic improvement 18,19,20.
Pelotas is consistent with the situation of eco-nomic growth in Brazil when compared with prevalence in wealthier countries.
The results encountered in 2010 are consis-tent with those of previous studies 1,6,8,18,21, 22,23,24,25. The adjusted analysis corroborate the association between prevalence of asthma symp-toms and the following factors: female sex, to-bacco use, obesity and low family income.
It is believed that changes in the health system over the 10 year interval may have had a positive effect on some determinants of the occurrence of asthma. These changes include expansion of the primary care network, introduction of the Family Health Program in 2002 26, and increasing use of outpatient health care services 27. In the past two
years, primary care personnel have been given
training in child asthma, and children have been provided with medications, including pressurized aerosols. Although no measures have been taken specifically for asthma in adults, more frequent contact with health services during children’s treatment may have influenced management of the disease in the population studied. That is to say, the investment in combating child asthma may have had an indirect, negative effect on the prevalence of asthma symptoms among adults. Also, efforts to combat tobacco use, which is an important determinant of asthma, have been strengthened in the city and in Brazil. The reduc-tion in the proporreduc-tion of tobacco users in the lo-cal population is an encouragement to continue with efforts made in this regard to date, as one in five adults still smokes. Halving the proportion Table 2
Distribution of prevalence of current asthma symptoms, by characteristics studied, by study year. Pelotas, Rio Grande do Sul State, Brazil.
Variables Year 2000 (N = 1,968) Year 2010 (N = 2,466) Percentage change
% 95%CI % 95%CI
Sex
Male 4.7 3.3-6.1 4.3 3.1-5.6 -8.5
Female 7.0 5.5-8.5 7.5 6.1-8.8 7.1
Skin color
White 5.6 4.5-6.7 5.8 4.7-6.8 3.6
Non-white 8.4 5.4-11.4 7.2 5.0-9.4 -14.3
Age (years)
20-29 5.0 3.0-7.0 6.8 4.7-8.8 36.0
30-39 5.2 3.1-7.2 5.7 3.5-7.8 9.6
40-49 4.3 2.4-6.2 6.1 4.1-8.1 41.9
50-59 8.0 5.2-10.7 7.0 4.7-9.2 -12.5
60-69 10.1 6.1-14.0 4.4 2.3-6.5 -56.4
Family income (MW)
≤ 1.0 8.3 6.1-10.5 7.9 4.8-11.1 -4.8
1.01-3.0 5.9 4.2-7.5 7.0 5.4-8.6 18.6
3.01-6.0 3.4 1.3-5.4. 5.6 3.9-7.3 64.7
≥ 6.01 4.2 1.6-6.8 3.9 2.1-5.7 -7.1
Tobacco use
Non-smoker 4.6 3.2-5.9 4.9 3.8-6.1 6.5
Former smoker 8.1 5.4-10.7 5.2 3.4-7.1 -35.8
Current smoker 7.0 5.0-9.0 9.7 7.2-12.1 38.6
BMI
Underweight 14.3 4.8-23.7 7.4 0.0 -48.3
Eutrophic 5.1 3.6-6.5 5.3 3.7-6.8 4.0
Overweight 5.7 3.9-7.5 5.3 3.7-6.9 -7.0
Obese 7.5 4.8-10.1 8.8 6.5-11.2 12.0
Total 6.0 5.0-7.1 6.1 5.1-7.0 1.6
Table 3
Crude and adjusted analysis of the association between current asthma symptoms and demographic, socioeconomic, behavioral and anthropometric characteristics of the populations studied, by study year. Pelotas, Rio Grande do Sul State, Brazil.
Variable Year 2000 (N = 1,968) Year 2010 (N = 2,466)
Crude analysis Adjusted analysis Crude analysis Adjusted analysis
PR 95%CI p-value PR 95%CI p-value PR 95%CI p-value PR 95%CI p-value
Sex 0.03 * 0.05 * 0.002 * 0.002 *
Male 1.00 - 1.00 - 1.00 - 1.00
-Female 1.50 1.04-2.12 1.44 1.01-2.05 1.71 1.23-2.40 1.71 1.22-2.40
Skin color 0.04 * 0.21 * 0.20 * 0.34 *
White 1.00 - 1.00 - 1.00 - 1.00
-Non-white 1.51 1.02-2.25 1.25 0.84-1.87 1.25 0.89-1.76 1.20 0.84-1.70
Age (years) 0.01 ** 0.01 ** 0.43 ** 0.41 **
20-29 1.00 - 1.00 - 1.00 - 1.00
-30-39 1.04 0.59-1.86 1.00 0.56-1.76 0.84 0.48-1.46 0.83 0.48-1.44
40-49 0.86 0.47-1.60 0.85 0.46-1.57 0.90 0.53-1.54 0.92 0.54-1.56
50-59 1.60 0.90-2.81 1.55 0.88-2.75 1.03 0.63-1.68 1.04 0.64-1.70
60-69 2.02 1.13-3.60 2.06 1.16-3.67 0.65 0.35-1.20 0.64 0.35-1.20
Family income (MW) 0.006 ** 0.01 ** 0.006 ** 0.01 **
≤ 1.0 1.97 1.01-3.84 1.96 1.00-3.83 2.03 1.18-3.50 1.93 1.11-3.40
1.01-3.0 1.39 0.71-2.69 1.41 0.74-2.73 1.80 1.07-3.01 1.71 1.01-2.72
3.01-6.0 0.80 0.34-1.88 0.80 0.34-1.88 1.43 0.79-2.60 1.41 0.78-2.45
≥ 6.01 1.00 - 1.00 - 1.00 - 1.00
-Tobacco use 0.02 * 0.03 * < 0.001 * < 0.001 *
Non-smoker 1.00 - 1.00 - 1.00 - 1.00
-Former smoker 1.77 1.15-2.73 1.67 1.07-2.60 1.06 0.70-1.61 1.20 0.77-1.83 Current smoker 1.54 1.02-2.30 1.56 1.04-2.34 1.96 1.39-2.76 2.05 1.43-2.95
BMI 0.02 * 0.07 * 0.01 * 0.01 *
Underweight 2.83 1.40-5.70 2.44 1.21-4.92 1.41 0.36-5.56 1.23 0.32-4.66
Eutrophic 1.00 - 1.00 - 1.00 - 1.00
-Overweight 1.12 0.73-1.72 1.00 0.65-1.56 1.00 0.68-1.49 1.11 0.75-1.65
Obese 1.48 0.93-2.34 1.18 0.74-1.90 1.68 1.16-2.44 1.80 1.24-2.62
BMI: body mass index; MW: minimum wage; PR: prevalence ratio. * Wald Test for heterogeneity;
** Wald Test for linear trend.
of tobacco users in the town would potentially reduce the prevalence of asthma symptoms by 11.2% in the adult population. However, the re-duction in the proportion of smokers observed after 10 years has not reduced the prevalence of asthma symptoms, suggesting that other factors, mentioned above, with an opposite influence on the disease, have increased in proportion over the same period. The literature shows that atopy, obesity and increasing environmental pollution, consistent with increasing urbanization of the town over those last 10 years, may cause an in-crease in prevalences of asthma 18,19,20.
Stabilization in the prevalence of asthma in this age group has also been described in other
studies, as already mentioned. North American research, using data from surveys by the Centers for Disease Control and Prevention (CDC), and studies in Sweden, surmise that this trend results from increasing medical diagnosis, and thus from greater contact between asthma sufferers and health services, and consequent improved management of the disease 7,11,28. This present study was not able to detect these changes, which will require new studies to evaluate the appropri-ateness of asthma management and treatment by, among other things, identifying access to medication.
factor deserving particular attention by health care. The increase in BMI in the population sug-gests a need to formulate strategies for dietary education and to foster (and provide facilities for) physical activity, given that this disease is also related to a number of other chronic non communicable diseases, such as systemic arterial hypertension, diabetes mellitus, dyslipidemias, and others 29. Concomitant obesity and
smok-ing in women resulted in higher risk of asthma symptoms (PR = 8.3) than in smoking, non-obese men (data not presented). That observa-tion underscores the need to to develop health intervention and education strategies for this specific group.
Therefore, it is believed that these results are consistent with the hypothesis that the stabiliza-tion in the prevalence of asthma symptoms in adults in the last 10 years in Pelotas has resulted from the improvements described above in some conditions of the local population, which reflect nationwide changes.
Possible limitations should be noted in re-lation to this study. Using reported symptoms, with no pulmonary tests for diagnosing asthma, entails restrictions. There are known to be other pathologies with similar symptoms to those of asthma, such as chronic obstructive pulmonary disease (COPD). Nonetheless, in this study, the factors associated with COPD were not associ-ated with the presence of asthma symptoms; that is, age (older adults: ≥ 60 years) and low BMI 30.
Other restrictions on the analyses of this study relate to not including the variables “family his-tory of asthma” and “atopy”, and the possibility of reverse causality in the association between obesity and asthma symptoms. However, the appropriateness of using the criterion “wheez-ing with shortness of breath in the last year” to determine asthma is endorsed by the document Global Initiative for Asthma (GINA) 2. That
docu-ment points to the concomitant occurrence of these two symptoms as a clinically significant indication of asthma, and “wheezing in the past
12 months” as the most important symptom for identifying individuals with asthma 2. In 2000 and in 2010, the criteria used to determine asthma was “wheezing with shortness of breath in the last year”.
One positive aspect of the study is the appro-priateness of the comparison interval, with no alterations in clinical diagnosis of the disease in Brazil over that interval. Also, both studies had relatively high response rates (around 90%), and losses did not bias this present study, because they were not related to the occurrence of the outcome. The use of the ISAAC questionnaire (validated in Brazil for children and adolescents) among adults is warranted by its widespread use in other studies and by the finding in the litera-ture of a strong correlation between the preva-lence data and ECHRS, when applied in the same country 31. Also, its use in the adolescente popu-lation suggests a satisfactory degree of applica-bility in the adult population 12. Note also that its
use in both studies eliminates the possibility of interference in the results.
Lastly, the finding by this present study that prevalence of asthma symptoms has stabilized offers the town new information regarding this disease among adults. Given the improvements in socioeconomic factors and the reduction in smoking in the population, it is shown to be pos-sible to reduce the prevalence of asthma symp-toms. Interventions that leverage control of asth-ma symptoms – such as constant capacity-build-ing for primary health personnel, distribution of drugs to adults, and some measures directed to reducing obesity – are considered to contribute positively to controlling the disease.
Resumo
Há divergências na literatura quanto às tendências temporais da ocorrência de asma em adultos. Este es-tudo objetivou comparar a prevalência de asma em dois levantamentos realizados com um intervalo de dez anos, em Pelotas, Rio Grande do Sul, Brasil. Os dois estudos foram transversais, de base populacional e com estratégias semelhantes de amostragem. O primeiro, feito em 2000, incluiu 1.968 indivíduos, e o segundo, em 2010, 2.466 adultos (20-69 anos). A prevalência de chiado e falta de ar, nos últimos 12 meses, manteve-se estável após dez anos (6% e 6,1%, respectivamente). Em ambos os estudos, a prevalência de asma foi maior em mulheres e pessoas com renda familiar baixa. Houve aumento de 35,6% no diagnóstico médico de asma e de 32,2% na prevalência de asma na vida. Não houve va-riação percentual para sintomas atuais de asma e as-ma atual. A melhora socioeconômica local, observada entre os estudos, foi coerente com o aumento do diag-nóstico medico, porém não refletiu um melhor manejo dos sintomas da asma, o que reforça a necessidade de investimentos em outros determinantes da doença.
Asma; Adulto; Prevalência; Estudos Transversais
Contributors
N. S. Fiori participated in conception of the project, analysis and interpretation of the data, drafting the article and substantial critical review of its intellectual content, and final approval of the manuscript. A. M. B. Menezes collaborated in conception of the project, data interpretation, substantial critical review of intel-lectual content, and final approval of the manuscript. H. Gonçalves, S. C. Dumith and M. A. D. C. Cesar con-tributed to conception of the project, data analysis and interpretation, substantial critical review of intellectual content, and final approval of the manuscript. S. E. C. Macedo participated in data interpretation, substantial critical review of intellectual content, and final approval of the manuscript.
References
1. Bateman ED, Hurd SS, Barnes PJ, Bousquet J, Dra-zen JM, FitzGerald M, et al. Global strategy for asthma management and prevention: GINA ex-ecutive summary. Eur Res J 2008; 31:143-78. 2. Masoli M, Fabian D, Holt S, Beasley R; Global
Ini-tiative for Asthma (GINA) Program. The global burden of asthma: executive summary of the GINA Dissemination Committee report. Allergy 2004; 59:469-78.
3. Ampon RD, Williamson M, Correll PK, Marks GB. Impact of asthma on self-reported health status and quality of life: a population based study of Australians aged 18-64. Thorax 2005; 60:735-9.
4. Organização Pan-Americana da Saúde. Prevenção e controle de doenças: doenças respiratórias crôni-cas. http://www.opas.org.br/prevencao/mos_info. cfm?codigodest=226 (accessed on 10/Nov/2009). 5. Variations in the prevalence of respiratory
symp-toms, self-reported asthma attacks, and use of asthma medication in the European Community Respiratory Health Survey (ECRHS). Eur Resp J 1996; 9:687-95.
7. Barraclough R, Devereux G, Hendrick DJ, Sten-ton SC. Apparent but not real increase in asthma prevalence during the 1990s. Eur Respir J 2002; 20: 826-33.
8. Brogger J, Bakke P, Eide GE, Johansen B, Andersen A, Gulsvik A. Long-term changes in adult asthma prevalence. Eur Respir J 2003; 21:468-72.
9. Woods RK, Walters EH, Wharton C, Watson N, Abramson M. The rising prevalence of asthma in young Melbourne adults is associated with im-provement in treatment. Ann Allergy Asthma Im-munol 2001; 87:117-23.
10. Verlato G, Corsico A, Villani S, Cerveri I, Migliore E, Accordini S, et al. Is the prevalence of adult asth-ma and allergic rhinitis still increasing? Results of an Italian study. J Allergy Clin Immunol 2003; 111:1232-8.
11. Lötvall J, Ekerljung L, Rönmark EP, Wennergren G, Lindén A, Rönmark E, et al. West Sweden Asthma Study: prevalence trends over the last 18 years argues no recent increase in asthma. Respir Res 2009; 10:94.
12. Macedo SEC, Menezes AMB, Knorst M, Dias-da-Costa JS, Gigante DP, Olinto MT, et al. Fatores de risco para a asma em adultos, Pelotas, Rio Grande do Sul, Brasil. Cad Saúde Pública 2007; 23:863-74. 13. Solé D, Vanna AT, Yamada E, Rizzo MC, Naspitz
CK. International Study of Asthma and Allergies in Childhood (ISAAC) written questionnaire: vali-dation of the asthma component among Brazilian children. J Investig Allergol Clin Immunol 1998; 8:376-82.
14. World Health Organization. Global database on body mass index: an interactive surveillance tool for monitoring nutrition transition. http:// apps.who.int/bmi/index.jsp (accessed on 02/ Sep/2010).
15. Urrutia I, Aguirre U, Sunyer J, Plana E, Mu-niozguren N, Martínez-Moratalla J, et al. Changes in the prevalence of asthma in the Spanish cohort of the European Community Respiratory Health Survey (ECRHS-II). Arch Bronconeumol 2007; 43:425-30.
16. Simpson CR, Sheikh A. Trends in the epidemiology of asthma in England: a national study of 333,294 patients. J R Soc Med 2010; 103:98-106.
17. Associação Nacional de Empresas de Pesquisa. Critério de classificação econômica Brasil. http:// www.datavale-sp.com.br/CCEB.pdf (accessed on 01/Oct/2010).
18. Chen Y, Bishop M, Liepold H. Increased effect of obesity on asthma in adults with low household income. J Asthma 2010; 47:263-8.
19. Sakar A, Yorgancioglu A, Dinc G, Yuksel H, Celik P, Dagyildizi L, et al. The prevalence of asthma and allergic symptoms in Manisa, Turkey (a western city from a country bridging Asia and Europe). Asian Pac J Allergy Immunol 2006; 24:17-25.
20. Viinanen A, Munhbayarlah S, Zevgee T, Narantse-tseg L, Naidansuren T, Koskenvuo M, et al. Preva-lence of asthma, allergic rhinoconjunctivitis and allergic sensitization in Mongolia. Allergy 2005; 60:1370-7.
21. Gwynn RC. Risk factors for asthma in US adults: results from the 2000 Behavioral Risk Factor Sur-veillance System. J Asthma 2004; 41:91-8.
22. McHugh MK, Symanski E, Pompeii LA, Delclos GL. Prevalence of asthma among adult females and males in the United States: results from the Na-tional Health and Nutrition Examination Survey (NHANES), 2001-2004. J Asthma 2009; 46:759-66. 23. Ellison-Loschmann L, Sunyer J, Plana E, Pearce N,
Zock JP, Jarvis D, et al. Socioeconomic status, asth-ma and chronic bronchitis in a large community-based study. Eur Respir J 2007; 29:897-905. 24. Barros MBA, César CLG, Carandina L, Torre GD.
Desigualdades sociais na prevalência de doenças crônicas no Brasil, PNAD-2003. Ciênc Saúde Cole-tiva 2006; 11:911-26.
25. Theme-Filha MM, Szwarcwald CL, Souza-Junior PRB. Socio-demographic characteristics, treat-ment coverage, and self-rated health of individuals who reported six chronic diseases in Brazil, 2003. Cad Saúde Pública 2005; 21 Suppl 1:S43-53. 26. Secretaria Municipal de Saúde de Pelotas. Plano
Municipal de Saúde, 2007-2009. Pelotas: Secretaria Municipal de Saúde de Pelotas; 2007.
27. Nader GA. Aumento na utilização de consultas ambulatoriais nos últimos 15 anos: comparação de dois estudos de base populacional [Masters thesis]. Pelotas: Programa de Pós-graduação em Epidemiologia, Universidade Federal de Pelotas; 2007.
28. American Lung Association. Trends in asthma morbidity and mortality. http://www.lungusa.org/ finding-cures/our-research/trend-reports/asth ma-trend-report.pdf (accessed on 18/Sep/2010). 29. Malta DC, Cezário AC, Moura L, Morais Neto OL,
Silva Junior JB. A construção da vigilância e pre-venção das doenças crônicas não transmissíveis no contexto do Sistema Único de Saúde. Epide-miol Serv Saúde 2006; 15:47-65.
30. Menezes AMB, Jardim JR, Pérez-Padilla R, Cam-elier A, Rosa F, Nascimento O, et al. Prevalence of chronic obstructive pulmonary disease and asso-ciated factors: the PLATINO Study in São Paulo, Brazil. Cad Saúde Pública 2005; 21:1565-73. 31. Pearce N, Sunyer J, Cheng S, Chinn S, Björkstén B,
Burr M, et al. Comparison of asthma prevalence in the ISAAC and the ECRHS. Eur Respir J 2000; 16:420-6.
Submitted on 21/Feb/2011