Rev Bras
Cineantropom
Hum
DOI: http://dx.doi.org/10.5007/1980-0037.2016v18n6p700
original article
1 Universidade Federal do Rio Grande do Sul. Escola de Educação Física, Fisioterapia e Dança. Porto Alegre, RS. Brasil.
2 McMaster University. Child Health & Exercise Medicine Program. Hamil-ton, Ontario. Canadá.
3 Fundação Universidade Federal de Ciências da Saúde de Porto Alegre. Programa de Pós-Graduação em Ci-ências da Reabilitação. Porto Alegre, RS. Brasil.
Received: 05 June 2016 Accepted: 03 October 2016
Aerobic itness proile of youth soccer
players: effects of chronological age
and playing position
Peril aeróbio de jovens jogadores de futebol:
efeitos da idade cronológica e da posição tática
Giovani dos Santos Cunha1
André Luís Lopes1
Jeam Marcel Geremia1
Gabriela Tomedi Leites2
Bruno Manfredini Baroni3
Rogério da Cunha Voser1
Marco Aurélio Vaz1
Álvaro Reischak-Oliveira1
Abstract – To establish a proile of the aerobic itness in young soccer players, it is critical to consider diferent intervenient factors such as maturity status, chronological age and play-ing position. he aim of this study was to identify the biological maturation, chronological age, and playing position efects on physical and physiological characteristics of young soccer players. Two hundred and one soccer players of 11-19 years old were divided into groups relative to their maturity status, chronological age and playing position. A maximal exercise test was performed to determine peak oxygen uptake (VO2peak) and ventilatory
thresholds (VT1 and VT2) parameters in a treadmill. Biological maturation showed no signiicant efect on relative values (mL.kg-1.min-1) of VO
2peak, VT2 and VT1 (0.004 < h 2
< 0.039), but showed large positive efect on maximal aerobic speed (MAS) and speed at VT2 (VT2speed). Chronological age showed a medium positive efect on relative values
of VO2peak, VT2 and VT1 (0.095 < h2 < 0.137) and a large positive efect on MAS and
VT2speed. Relative values of VO2peak and VT1 showed no signiicant diferences among groups for playing position (P>0.05; 0.044 < h2 < 0.051). However, goalkeepers showed
signiicant lower relative values for VT2 and VT2speed than other playing positions and
a medium positive efect was observed (P<0.05; 0.077 < h2 < 0.119). Chronological age
showed a medium to large positive efect on aerobic itness parameters, while biological maturation showed a positive efect only on MAS and VT2speed. Playing position showed a medium positive efect on VT2 and VT2speed.
Key words: Child; Puberty; Oxygen consumption; Anaerobic threshold; Running.
Resumo – Para identiicar o peril aeróbico de jovens jogadores de futebol é necessário considerar fatores intervenientes como maturação biológica, idade cronológica e posição tática. O objetivo do presente estudo foi identiicar o efeito da maturação biológica, idade cronológica e posição tática sobre as características físicas e isiológicas de jovens jogadores de futebol. Duzentos e um jogadores de futebol com idades entre 11-19 anos foram divididos em grupos de acordo com estágio matu-racional, idade cronológica e posição tática. Um teste máximo foi realizado para determinar o
consumo de oxigênio de pico (VO2pico) e limiares ventilatórios (LV1 e LV2). A maturação biológica
não apresentou efeitos signiicativos sobre os valores relativos (mL.kg-1.min-1) de VO
2pico, LV2
e LV1 (0,004 < h2 < 0,039), mas apresentou elevado efeito sobre velocidade aeróbia máxima
(VAM) e velocidade em LV2 (LV2velocidade). A idade cronológica apresentou efeito positivo médio
sobre os valores relativos de VO2pico, LV2 e LV1 (0,095 < h
2 < 0,137), e elevado efeito positivo
sobre VAM e LV2velocidade. A posição tática não apresentou diferenças signiicativas sobre os valores
relativos de VO2pico e LV1 entre os grupos(P>0,05; 0,044 < h2 < 0,051). Entretanto, goleiros
apresentaram signiicativamente menores valores relativos de LV2 e LV2velocidade em comparação
com outras posições táticas, com efeito positivo médio sendo identiicado (P<0,05; 0,077 < h2 <
0,119). A idade cronológica apresentou efeito positivo de médio a elevado sobre o peril aeróbio,
INTRODUCTION
Soccer is one of the most popular sports in the world and it is characterized by a combination of physical, technical and tactical factors1,2. Soccer is an
intermittent team sport involving low to high-intensity eforts3 and showing
running as the main physical activity of the game1,3. During a match, the
total running distance covered by a young soccer player ranges from 4 to 8.5 km1,3,4 while by a professional soccer player ranges from 8 to 12km1.
In terms of the physical performance during a soccer match, the aerobic itness level has been considered as most powerful determinant of match running performance3. In addition, the distance run at high-intensity has
been used to rank physical performance between players4,5.
In this context, the aerobic metabolism is important to soccer perfor-mance mainly because it is the predominant source of energy to supply physical demands1. For this reason, to determine aerobic itness parameters
such as peak oxygen uptake (VO2peak), ventilatory thresholds (VT1 and VT2), maximal aerobic speed (MAS), speed at VT2 (VT2speed) and VT1 (VT1speed) are important to understand soccer performance and to identify intensity training zones and cardiorespiratory adaptations related to soccer training1-6. VO
2peak, MAS and VT2speed have showed a positive correlation
with the total distance covered and high-intensity eforts performed by young soccer players during a match2,7. For example, physically it players
perform more high-intensity running during a match compared to theirs less-it counterparts7. Improvements of 10% in VO
2peak have been associated
with a 20% increase in the total distance covered and twice the number of sprints during the game2. Additionally, VT
2 have been considered an
important variable to soccer performance mainly because it is very close to the intensity at which the soccer matches are played1,2. VT
2speed and VT1speed
have been used to delimit the high-intensity and low to moderate-intensity zones during match analysis, respectively5.
he interpretation of aerobic itness features may be problematic from a talent identiication/development perspective due to the biological maturational, chronological age, relative age and playing position efects. Some studies indicate that biological maturation can exert a positive ef-fect on VO2peak8-10 and ventilatory thresholds11. Consequently, biological
maturation may be a confounding factor during the talent development and/or talent identiication process. Athletes more advanced in biological maturation process were described with higher VO2peak, power, speed, strength, sport-speciic skills, and aerobic performance8,9. Consequently,
late maturing boys are systematically excluded while early maturing boys are generally selected9,12,13.
Youth soccer competitions are generally organized into annual age-groups using speciic cut-of values. his organization model was designed to give players equal participation and training opportunities, including fair opportunities for talent identiication and/or development process13,14.
com-pared to their teammates. his can result in maturational and physical performance diferences in favor of players born early in the birth year13,15,16.
his phenomenon has been deined as relative age and its consequences are known as the relative age efect (RAE)13-15.
Players who are born early in the selection year (e.g. irst birth quarter) take advantage of this subtle chronological lead and are more likely to be selected compared to their peers born later in the selection year (e.g. fourth birth quarter)13. In this scenario, chronological age plays similar role as
biological maturation favoring those athletes born in the irst quarter and excluding those born in the fourth birth quarter. herefore, these factors should be considered by soccer clubs to not bias the athlete’s selection pro-cess towards the early maturing players due to the inluences of RAE17,18.
In addition to biological maturation and chronological age, to establish an aerobic itness proile in young soccer players, it is critical to consider other intervenient factors, such as playing position3. Playing position has
been described as an important feature related to soccer performance in young soccer player due to its efects on aerobic itness3,19-21. Currently
literature lacks in studies about the efects of biological maturation, RAE and playing position on VO2peak and ventilatory thresholds parameters in high-level youth soccer players. So far, only few studies have investigated the relationship among aerobic itness, biological maturation, RAE, and playing position in high-level young soccer players simultaneously. here-fore, the present study aimed to describe the physical and physiological proile of high-level young soccer players and to identify whether chrono-logical age, maturity status, and playing position exert efects on VO2peak and ventilatory thresholds parameters.
METHODOLOGICAL PROCEDURES
Participants
Study Overview
Participants visited the laboratory on a single session to complete several physical and physiological examinations, which included anthropometrics (height and body mass), determining maturity status, and completing an incremental exercise test to assess VO2peak and ventilatory thresholds pa-rameters. hey also completed a questionnaire about their health status, use of medication, birth date and years of training. Similar to previous studies20,22,23, all participants were separated into groups according to their
self-reported best position in the ield: goalkeeper (GK); full-back (FB); central-back (CB); defensive midielder (DM); ofensive midielder (OM); and attacker (AT). Participants were familiar with the procedures before data collection commenced. All measurements were performed during the preseason period.
Maturity Status
Biological maturation was assessed by a trained healthcare professional using the criteria described by Tanner24. Prepubertal status was deined
as stage I (n = 26), pubertal as stage II (n = 13), III (n = 39), and IV (n = 38), and as postpubertal as stage V (n = 85).
Aerobic Fitness
VO2peak and ventilatory thresholds parameters were assessed by open circuit spirometry (breath by breath) during the performance of a maxi-mum treadmill running test. Following the manufacturer’s instructions, the ergospirometry device (MedGraphics Cardiorespiratory Diagnostic Systems - CPX-D, St Paul, Minnesota) was manually calibrated using known gas concentrations. he participants were given time to adapt to the treadmill (Quinton Instruments-Seattle, USA) and ergospirometry device. Participants then performed a single progressive maximum efort test, which consisted of running for three minutes at 8 km.hr-1 followed by
increases of 0.5 km.hr-1 every 30 seconds until exhaustion21. Participants
were verbally encouraged during the test to achieve their maximal per-formance. To verify an exhaustive efort, each participant had to satisfy at least two of the following criteria upon termination of the treadmill test due to volitional exhaustion: 1) heart rate at the end of the test ≥ 95% of the predicted maximal heart rate, 2) a plateau of VO2 thatwas deined as an increase in VO2 of less than 2.1 mL.kg-1.min-1 with a corresponding
increase in exercise intensity; 3) respiratory exchange ratio (RER) ≥ 1.0 21.
Heart rate was measured using a heart rate monitor (Polar S610, USA). According to these criteria, all participants showed a valid VO2peak.
func-tion of oxygen uptake. Criteria to determine ventilatory thresholds were as follows: VT1 was determined when there was a rapid increase in the V̇E/V̇O2 and PETO2 with no concomitant increase in V̇E/V̇CO2 and PETCO2. VT2 was determined as the point at which a rapid rise in V̇E/ V̇CO2 and a fall in PETCO2 were observed. VT1 and VT2 were deined as the work rates associated with a irst and a second nonlinear increase of VE and VCO26,21. hree independent reviewers blindly determined
ventilatory thresholdsfollowing the criteria previously described.
Statistical analysis
he normality of the distributions was investigated using the Kolmogorov-Smirnov test, and the homogeneity of the variables was assessed using Levene’s test. he mean and standard deviation values were used in the descriptive analysis. Diferences among maturity status, chronological age, and playing position groups for physical and physiological traits were tested with analysis of variance (One-way ANOVA). Bonferroni adjustments were done for post-hoc comparisons. For each ANOVA, partial eta-squared (h2)
was calculated as a measure of efect size (ES). To interpret the magnitude of the efect size the following were adopted < 0.01 as small, 0.06 to 0.15 as moderate and > 0.15 as large efect25. Diferences between the observed
and expected birth-date distribution were tested with the Chi-square statistic. Expected birth-date distributions were estimated to be 25% for each quarter of the year. he level of statistical signiicance was set at P ≤ 0.05. Statistical analyses were conducted using the statistical programs SPSS (version 19.0, SPSS, Inc., IBM Company; NY, USA).
RESULTS
Physical and physiological characteristics considering the entire group of high-level youth soccer players are presented in Table 1.
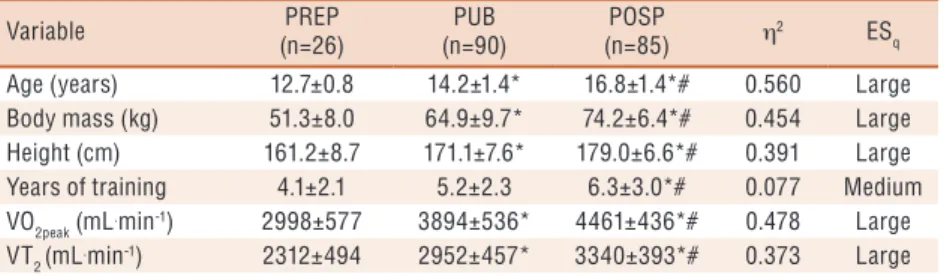
Table 2 depicts the physical and physiological characteristics in accord-ance to participant’s biological maturation. As expected, postpubescent soccer players were signiicantly heavier and taller than prepubescent and pubescent soccer players (P < 0.05). Biological maturation showed no sig-niicant efects on relative to body size values (mL.kg-1.min-1) of VO
2peak,
VT2 and VT1 (0.004 < h2 <0.039); and no signiicant diferences among
maturational groups were observed (P > 0.05).
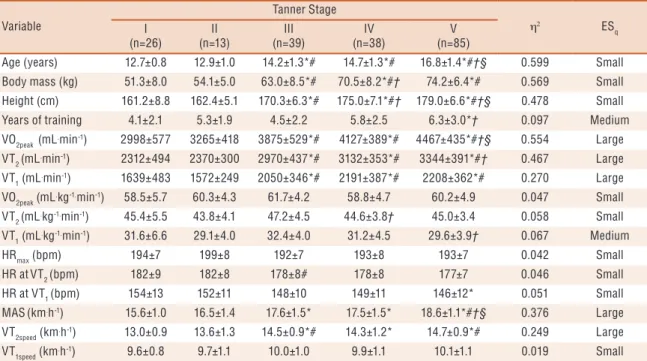
Table 3 shows the physical and physiological characteristics in accord-ance to maturity status (Tanner stages). No signiicant diferences were observed among maturational groups for relative to body mass values (mL.
kg-1.min-1) of VO
2peak, VT2, and VT1 (P > 0.05). Exception was observed
on the comparison between stages III and V for VT1 values (P < 0.05). Tanner stages showed no signiicant efects relative to body mass values of VO2peak and VT2 (0.047 < h2 <0.058). However, a medium positive efect
was found for relative to body mass values of VT1 (h2 = 0.067).
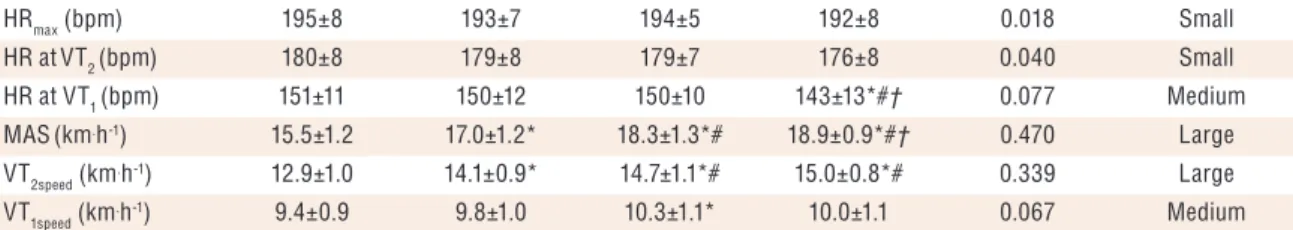
in Table 4. Signiicant diferences were found for relative to body mass values of VO2peak, VT2 and VT1 manly in favor of older groups (13-14, 15-16, and > 17 years old) in comparison to the younger group (11-12 years old). Chronological age showed medium positive efect on relative to body mass values of VO2peak, VT2 and VT1 (0.095 < h2 <0.137).
Table 5 shows the physical and physiological characteristics according to playing position. Relative values (mL.kg-1.min-1) of VO
2peak and VT1
showed no signiicant diferences among groups for playing position (P > 0.05; 0.044 < h2 <0.051). However compared to the GK group, the FB,
DM and OM groups showed signiicant diferences for relative values of VT2, with a medium positive efect (P < 0.05; h2 =0.077).
Interestingly, large positive efects of biological maturation status and chronological age on MAS and VT2speed were observed, while playing po-sition showed a medium positive efect on VT2speed (Tables 2, 3, 4 and 5). RAE was identiied due to overrepresentation of players born during the irst semester of the year (P < 0.05). Birth-date distribution by month quartile was 49.8%, 26.4, 15.9% and 8% for BQ1, BQ2, BQ3, and BQ4, respectively.
Table 1. Physical and physiological characteristics of youth elite soccer players (n=201)
Variable Mean ± SD Minimum and maximal values
Age (years) 15.1±2.0 11–19
Body mass (kg) 67.0±11.1 37.9–94.3
Height (cm) 173.0±9.5 148–195
Years of training 5.5±2.7 1–12
VO2peak (mL.min-1) 4020±690 2225–5510
VT2 (mL.min-1) 3035±547 1654–4680
VT1 (mL.min-1) 2060±435 873–3200
VO2peak (mL.kg-1.min-1) 60.0±4.9 43.1–73.2
VT2 (mL.kg-1.min-1) 45.3±4.1 33.9–58.1
VT1 (mL.kg-1.min-1) 30.7±4.6 17.7–40.6
HRmax (bpm) 193±7.0 176–215
HR atVT2 (bpm) 178±8.0 159–205
HR at VT1 (bpm) 148±12.0 115–180
MAS(km.h-1) 17.7±1.6 13–21
VT2speed (km.h-1) 14.3±1.1 10–17 VT1speed (km.h-1) 9.9±1.1 7–13.5
Data expressed as mean and standard deviation (mean ± SD). MAS= maximal aerobic speed; VT2speed = speed at VT2; VT1speed = speed at VT1;HR= heart rate.
Table 2. Physical and physiological profile of young elite soccer players according to biological
maturation status
Variable (n=26)PREP (n=90)PUB (n=85)POSP h2 ES
q
Age (years) 12.7±0.8 14.2±1.4* 16.8±1.4*# 0.560 Large
Body mass (kg) 51.3±8.0 64.9±9.7* 74.2±6.4*# 0.454 Large
Height (cm) 161.2±8.7 171.1±7.6* 179.0±6.6*# 0.391 Large
Years of training 4.1±2.1 5.2±2.3 6.3±3.0*# 0.077 Medium
VO2peak (mL.min-1) 2998±577 3894±536* 4461±436*# 0.478 Large VT2 (mL.min-1) 2312±494 2952±457* 3340±393*# 0.373 Large
VT1 (mL.min-1) 1639±482 2040±404* 2210±366*# 0.172 Large VO2peak (mL.kg-1.min-1) 58.5±5.8 60.2±5.0 60.3±4.5 0.015 Small VT2 (mL.kg-1.min-1) 45.4±5.5 45.6±4.4 45.1±3.4 0.004 Small VT1 (mL.kg-1.min-1) 31.6±6.6 31.4±4.3 29.8±3.9 0.039 Small
HRmax (bpm) 194±8 193±7 193±7 0.002 Small
HR atVT2 (bpm) 182±9 179±8 177±7* 0.032 Small
HR at VT1 (bpm) 154±13 149±11 147±12* 0.045 Small
MAS(km.h-1) 15.6±1.0 17.4±1.5* 18.6±1.1*# 0.353 Large VT2speed (km.h-1) 13.1±0.9 14.3±1.1* 14.8±0.9*# 0.215 Large VT1speed (km.h-1) 9.6±0.8 9.9±1.1 10.0±1.1 0.015 Small
Data were expressed as mean and standard deviation (mean ± SD), where * = significantly different from prepubertal group; # = significantly different from pubertal group; PREP= prepubertal group; PUB= pubertal group; POSP= postpubertal group; MAS= maximal aerobic speed; VT2speed = speed at VT2; VT1speed = speed at VT1;HR= heart rate; h2 = partial eta square; ESq = qualitative effect size. Significance (P<0.05).
… continue
Table 3. Physical and physiological profile of young elite soccer players according to Tanner stage
Variable
Tanner Stage
h2 ES
q I
(n=26) (n=13)II (n=39)III (n=38)IV (n=85)V
Age (years) 12.7±0.8 12.9±1.0 14.2±1.3*# 14.7±1.3*# 16.8±1.4*#†§ 0.599 Small
Body mass (kg) 51.3±8.0 54.1±5.0 63.0±8.5*# 70.5±8.2*#† 74.2±6.4*# 0.569 Small
Height (cm) 161.2±8.8 162.4±5.1 170.3±6.3*# 175.0±7.1*#† 179.0±6.6*#†§ 0.478 Small
Years of training 4.1±2.1 5.3±1.9 4.5±2.2 5.8±2.5 6.3±3.0*† 0.097 Medium
VO2peak (mL.min-1) 2998±577 3265±418 3875±529*# 4127±389*# 4467±435*#†§ 0.554 Large VT2 (mL.min-1) 2312±494 2370±300 2970±437*# 3132±353*# 3344±391*#† 0.467 Large VT1 (mL.min-1) 1639±483 1572±249 2050±346*# 2191±387*# 2208±362*# 0.270 Large VO2peak (mL.kg-1.min-1) 58.5±5.7 60.3±4.3 61.7±4.2 58.8±4.7 60.2±4.9 0.047 Small VT2 (mL.kg-1.min-1) 45.4±5.5 43.8±4.1 47.2±4.5 44.6±3.8† 45.0±3.4 0.058 Small VT1 (mL.kg-1.min-1) 31.6±6.6 29.1±4.0 32.4±4.0 31.2±4.5 29.6±3.9† 0.067 Medium
HRmax (bpm) 194±7 199±8 192±7 193±8 193±7 0.042 Small
HR atVT2 (bpm) 182±9 182±8 178±8# 178±8 177±7 0.046 Small
HR at VT1 (bpm) 154±13 152±11 148±10 149±11 146±12* 0.051 Small
MAS(km.h-1) 15.6±1.0 16.5±1.4 17.6±1.5* 17.5±1.5* 18.6±1.1*#†§ 0.376 Large VT2speed (km.h-1) 13.0±0.9 13.6±1.3 14.5±0.9*# 14.3±1.2* 14.7±0.9*# 0.249 Large VT1speed (km.h-1) 9.6±0.8 9.7±1.1 10.0±1.0 9.9±1.1 10.1±1.1 0.019 Small
Data were expressed as mean and standard deviation (mean ± SD), where * = significantly different from group I; # = significantly different from group II; † = significantly different from group III; § = significantly different from group IV; MAS= maximal aerobic speed; VT2speed = speed at VT2; VT1speed = speed at VT1; HR= heart rate; h2 = partial eta square; ES
q = qualitative effect size. Significance (P<0.05).
Table 4. Physical and physiological profile of young elite soccer players according to chronological age
Variable
Chronological Age (years)
h2 ES
q 11-12
(n=26) (n=68)13-14 (n=58)15-16 (n=49)>17
Body mass (kg) 52.8±10.1 63.4±9.7* 71.3±6.8*# 75.0±6.9*# 0.438 Large
Height (cm) 160.6±8.5 169.9±7.5* 177.0±6.9*# 179.7±6.0*# 0.433 Large
Years of training 4.6±2.1 4.3±2.2 6.0±2.6# 7.1±2.9*# 0.172 Large
VO2peak (mL.min-1) 2909±522 3812±479* 4346±404*# 4513±472*# 0.557 Large
VT2 (mL.min-1) 2194±413 2875±391* 3307±328*# 3382±430*# 0.507 Large
VT1 (mL.min-1) 1457±372 2026±357* 2261±310*# 2187±401* 0.335 Large
VO2peak (mL.kg-1.min-1) 56.2±5.1 60.5±4.6* 61.1±4.3* 60.2±4.9* 0.095 Medium
VT2 (mL.kg-1.min-1) 42.3±4.6 45.7±3.8* 46.5±4.0* 45.0±3.6* 0.100 Medium
VT1 (mL.kg-1.min-1) 27.9±4.9 32.1±4.5* 31.8±3.9* 28.9±4.1#† 0.137 Medium
DISCUSSION
his study presented a proile of physical and physiological features for high-level young soccer players and identiied the efects of biological maturation, chronological age, RAE and playing position on aerobic itness parameters (VO2peak, VT2, VT1, MAS,VT2speed andVT1speed). hese variables have been described as important intervenient factors for the talent development and/ or talent identiication process as well for soccer performance.
To our knowledge, this was the irst study to report the efects of bio-logical maturation, chronobio-logical age, RAE and playing position on aerobic itness proile directly assessed by ergospirometry with a large sample and age range of high-level young soccer player’s simultaneously. he main indings from the present study were as follows: 1) biological maturation status showed no signiicant efects on VO2peak, VT2, and VT1 relative to
… continue
HRmax (bpm) 195±8 193±7 194±5 192±8 0.018 Small
HR atVT2 (bpm) 180±8 179±8 179±7 176±8 0.040 Small
HR at VT1 (bpm) 151±11 150±12 150±10 143±13*#† 0.077 Medium
MAS(km.h-1) 15.5±1.2 17.0±1.2* 18.3±1.3*# 18.9±0.9*#† 0.470 Large
VT2speed (km.h-1) 12.9±1.0 14.1±0.9* 14.7±1.1*# 15.0±0.8*# 0.339 Large VT1speed (km.h-1) 9.4±0.9 9.8±1.0 10.3±1.1* 10.0±1.1 0.067 Medium
Data expressed as mean and standard deviation (mean ± SD), where * = significantly different from 11-12 years old group; # = significantly different from 13-14 years old group; † = significantly different from 15-16 years old group; MAS= maximal aerobic speed; VT2speed = speed at VT2; VT1speed = speed at VT1; HR= heart rate; h2 = partial eta square; ES
q = qualitative effect size. Significance (P<0.05).
Table 5. Physical and physiological profile of young elite soccer players in according to playing position
Variable
Playing Position
h2 ES
q GK
(n=14) FB(n=35) CB(n=33) DM (n=37) OM(n=40) AT (n=36)
Age (years) 14.4±2.0 14.8±2.1 15.2±1.9 15.6±2.0 15.1±1.9 15.4±2.3 0.025 Small
Body mass (kg) 69.8±12.8 61.9±10.2 75.0±8.1# 70.9±9.2# 62.0±9.0†§ 65.7±12.6† 0.193 Large
Height (cm) 177.8±12.7 168.9±8.4* 180.5±6.2# 175.0±6.6# 168.9±6.6*†§ 171.9±11.7† 0.211 Large
Years of training 5.7±2.2 5.5±2.7 5.2±2.6 5.8±2.7 6.3±3.1 5.0±2.3 0.029 Small
VO2peak (mL.min-1) 4028±807 3735±678 4381±457# 4272±634# 3791±555†§ 3975±846 0.124 Medium VT2 (mL.min-1) 2930±622 2832±550 3318±371# 3277±535# 2842±410†§ 2983±652 0.134 Medium VT1 (mL.min-1) 1980±428 1836±436 2280±291# 2222±427# 1948±363† 2019±504 0.134 Medium VO2peak (mL.kg-1.min-1) 57.2±5.7 60.3±4.9 58.8±5.6 60.3±4.4 61.3±4.5 60.4±4.5 0.051 Small VT2 (mL.kg-1.min-1) 41.9±3.3 45.7±4.8* 44.4±4.0 46.1±3.8* 46.2±4.0* 45.3±3.8 0.077 Medium VT1 (mL.kg-1.min-1) 28.3±3.1 29.5±5.4 30.4±3.9 31.3±3.9 31.7±5.0 30.6±4.6 0.044 Small
HRmax (bpm) 192±6 195±8 193±6 195±7 194±8 192±7 0.025 Small
HR atVT2 (bpm) 176±7 180±8 178±7 179±8 179±9 178±8 0.021 Small
HR at VT1 (bpm) 145±9 148±12 146±11 150±11 149±13 150±13 0.022 Small
MAS(km.h-1) 16.6±2 17.7±1.6 17.8±1.4 18.2±1.3* 17.7±1.7 17.5±1.5 0.053 Small
VT2speed (km.h-1) 13.0±1.3 14.6±1.0* 14.4±1.1* 14.6±1.0* 14.4±1.1* 14.2±1.0* 0.119 Medium
VT1speed (km.h-1) 9.5±0.9 10.2±1.2 10.0±1.2 9.9±1.1 10.1±0.9 9.6±0.9 0.045 Small
Data expressed as mean and standard deviation (mean ± SD), where * = significantly different from goalkeeper group; # = significantly different from full-back group; † = significantly different central-back group; § = significantly different from defensive midfielder group; GK= goalkeeper; FB = full-back; CB = central-back; DM= defensive midfielder; OM =offensive midfielder; AT= attacker; MAS= maximal aerobic speed; VT2speed = speed at VT2; VT1speed = speed at VT1; HR= heart rate; h2 = partial eta square; ES
body size values (mL.kg-1.min-1) in young soccer players; 2) chronological
age showed a medium positive efect on VO2peak, VT2, and VT1 (mL.kg-1.
min-1) relative values; 3) RAE was conirmed since there was an
over-representation (76.2%) of players born in the irst semester of the year; 4) playing position showed no signiicant diferences among groups for VO2peak and VT1 (mL.kg-1.min-1) relative values, but showed medium positive efect
on VT2 (mL.kg-1.min-1); 5) biological maturation and chronological age
showed a large positive efect on MAS and VT2speed, while playing position showed a medium positive efect onlyVT2speed.
Programs developed for detection or development of players with potential talent can be biased by the intervenient efects of biological maturation, relative age, and playing position. As a result, potentially talented players can systematically drop out the sport at an early age, and not reach higher levels of competition12,26. In the present study,
biologi-cal maturation status did not show a signiicant positive efect on aerobic itness parameters (VO2peak, VT2, VT1 express in mL.kg-1.min-1) in young
soccer players. Some studies also did not ind positive efects of biological maturation on aerobic itness parameters of young soccer players6,16-18,21,27.
However, other studies demonstrated positive efects of biological matu-ration status on aerobic itness parameters of young soccer player9-11. he
contrasting indings regarding efects of biological maturation on aerobic itness parameters may be attributed to diferences in the sample size experimental design (i.e. diferent methods used to assess aerobic itness), scaling variable to normalize aerobic itness (i.e. absolute values, relative to body mass, relative to fat-free mass), and methods for estimating biologi-cal maturation (i.e. Tanner stages, peak high velocity)6,10,18,21. he efect of
biological maturation status on aerobic itness parameters seems inconclu-sive for young soccer players. It is important to highlight that body mass (kg) is a crucial variable that has a large impact on athletic performance. he normalization of aerobic itness parameters for body mass has been broadly used over time due to the high correlation with VO2peak. For this reason, absolute VO2peak, VT2, and VT1 (mL.min-1) values are not consid-ered appropriated to compare young soccer players with diverse biological maturation status, chronological age and/or body size6,11,21.
Chronological age showed a medium positive efect on aerobic itness parameters. Positive efects were observed for VO2peak, VT2, and VT1 (mL.
kg-1.min-1) manly due signiicant diferences among the 13─14, 15─16 and
> 17 years-old groups compared to the 11─12 years-old group. his result corroborate with previous inding26,27. hese studies showed that aerobic
itness parameters increase progressively from 8 to 18 years of age. How-ever, Cunha et al.6 using multiple linear regression analysis showed that
chronological age did not show positive efect on VO2peak, VT2 and VT1 (mL.kg-1.min-1) in young soccer player.
15.9% and 8% for BQ1, BQ2, BQ3, and BQ4, respectively. Similar indings were shown in early studies13,16,28. It has been well accepted that players
born in the irst semester of the year are usually taller, heavier and have greater aerobic power, muscular strength, speed, perception of competence, and self-eicacy compared with their relatively younger peers (born in the last semester of the year)14,16,23,28. RAE has been associated with success
in youth soccer players. here were positive correlations among RAE and rank, points scored, and goals against in U-17 Germany soccer teams29.
In addition, Carling et al.23 showed that out of a total of 75, 49, 26, and
10 players born in the BQ1, BQ2, BQ3, and BQ4 periods, 45.6%, 38.8%, 43.3% and 70% achieved professional status, respectively. Interestingly, a meta-analytical review identiied consistent prevalence of RAE in some sports (ice-rocky, volleyball, basketball, football, and soccer), but with small efect size14.
Playing position can also to exert efect on aerobic itness parameters in young soccer players3,4,19,20. A large association has been observed
be-tween aerobic itness and total distance covered during a match in youth soccer players3,7. More speciically, relationship between match running
performance and aerobic itness parameters are more position-dependent3,4.
In general, midielders and attackers show higher values of aerobic itness and covered more distance in highest intensity zone compared to defensive players3,4. In the present study, playing position showed no signiicant
ef-fects on VO2peak (mL.kg-1.min-1) among GK, FB, CB, DM, OM and AT
groups. In additional, other studies showed that aerobic endurance (m) was diferent among playing positions. Indeed goalkeepers showed lower values compared to defenders, midielders and attackers19,20. However, Coelho &
Silva et al.22 also did not ind efects of playing position on aerobic
endur-ance (m) in young Portuguese soccer players from local and regional levels. he discrepancies among these results might be partly explained by the use of diferent methods to determine aerobic itness parameters (direct vs. indirect tests), by the complexity nature of physical demands during a game, and also by the playing position-speciic running pattern (such as the link between defense and attack, technical actions, change positions, covered distance in low, moderate or high-intensity, acceleration for create space and counter-attack)3,4,19,20,22.
Few studies have assessed the efects of playing position on ventila-tory thresholds in young soccer player. In the present study, GK showed VT2 (mL.kg-1.min-1) values signiicantly lower compared to FB, DM and
OF groups. However, VT1 was similar among groups. It can be hypoth-esized that the observed results can be partially attributed to diferences in physical and physiological demands of game among diferent playing positions (e.g. total distance covered during the match in low, moderate and high-intensity), as well as the position-speciic training for goalkeep-ers, defendgoalkeep-ers, midielders and attackers.
MAS has been considered the most powerful determinant of physical game performance in young soccer players3. In the present study,
biologi-cal maturation and chronologibiologi-cal age showed a large positive efect while playing position no showed efect on MAS. With respect to MAS, similar results have been reported3,4,30. In general, older and more mature players
(15 to 18 years old) are faster according to the estimated MAS values (15 to 18 km.hr-1) in comparison to young and less mature players (12 to 15
years old) counterparts (13 to 15 km.hr-1)3,4,30. In addition, playing position
showed no signiicant efect on MAS3,4,30. It is noteworthy that our results
directly assessed of MAS are approximately 1 km.hr-1 higher than those
indirectly values previously reported in function of biological maturation and chronological age.
Based in the common belief that older players are more mature and exhibit better performance at the selection time, coaches tend to prefer those players that achieve success in highly competitive youth sports29.
However, from the long-term development talent perspective (i.e. develop-ment program from youth athlete to elite professional athlete) this selection model might be a concern. A recent longitudinal study12 showed that late
maturing soccer players are more likely to achieve success in the top level game (60.1%), compared with their normal maturing (38.1%) and early maturing counterparts (11.8%). Additionally, athletes born in the BQ4 have reached the professional level in a greater proportion than athletes born in BQ1, BQ2 and BQ323.
From a practical point of view, coaches, sport scientists and sport administrators should take into account the biological maturation status, RAE and playing position efects on aerobic itness proile during talent development and/or talent identiication programs, in order to avoid drop-out of the potential successful young players. Since MAS and VT2speed have been associated with match running performance in soccer, these variables could too be used to help talent identiication/development process and to design speciic training programs focused on position-dependent high-intensity traits. In addition, caution must be taken when interpreting the efects of biological maturation, chronological age and playing position on aerobic itness parameters in young soccer players on talent identiication/ development perspective. We cannot to assume that important factors of success in professional players automatically can be extrapolated to young soccer players.
CONCLUSION
Acknowledgements
he authors GSC, GTL, MAV and ARO were supported by a CNPq scholarship, and ALL and JMG by a CAPES scholarship.
REFERENCES
1. Stolen T, Chamari K, Castagna C, Wislof U. Physiology of soccer: an update.
Sports Med 2005;35(6):501-36.
2. Helgerud J, Engen LC, Wislof U, Hof J. Aerobic endurance training improves
soccer performance. Med Sci Sports Exerc 2001;33(11):1925-31.
3. Buchheit M, Mendez-Villanueva A, Simpson BM, Bourdon PC. Match running
performance and itness in youth soccer. Int J Sports Med 2010;31(11):818-25.
4. Mendez-Villanueva A, Buchheit M, Simpson B, Bourdon PC. Match play intensity
distribution in youth soccer. Int J Sports Med 2013;34(2):101-10.
5. Abt G, Lovell R. he use of individualized speed and intensity thresholds for
determining the distance run at high-intensity in professional soccer. J Sports Sci 2009;27(9):893-8.
6. Cunha G, Lorenzi T, Sapata K, Lopes AL, Gaya AC, Oliveira A. Efect of
bio-logical maturation on maximal oxygen uptake and ventilatory thresholds in soccer players: An allometric approach. J Sports Sci 2011;29(10):1029-39.
7. Castagna C, Impellizzeri F, Cecchini E, Rampinini E, Alvarez JC. Efects of
intermittent-endurance itness on match performance in young male soccer players. J Strength Cond Res 2009;23(7):1954-9.
8. Armstrong N, Welsman JR. Peak oxygen uptake in relation to growth and
matura-tion in 11- to 17-year-old humans. Eur J Appl Physiol 2001;85(6):546-51.
9. Malina RM, Eisenmann JC, Cumming SP, Ribeiro B, Aroso J. Maturity-associated
variation in the growth and functional capacities of youth football (soccer) players 13-15 years. Eur J Appl Physiol 2004;91(5-6):555-62.
10. Valente-Dos-Santos J, Coelho ESMJ, Tavares OM, Brito J, Seabra A, Rebelo A,
et al. Allometric modelling of peak oxygen uptake in male soccer players of 8-18 years of age. Ann Hum Biol 2015;42(2):125-33.
11. Cunha GS, Célia FG, Ribeiro JL, Oliveira AR. Efects of the biological maturation on maximal oxygen uptake and ventilatory breakpoint of Brazilian soccer players Gazz Med Ital - Arch Sci Med 2008;167(2):43-9.
12. Ostojic SM, Castagna C, Calleja-Gonzalez J, Jukic I, Idrizovic K, Stojanovic M.
he biological age of 14-year-old boys and success in adult soccer: do early maturers predominate in the top-level game? Res Sports Med 2014;22(4):398-407.
13. Deprez D, Coutts AJ, Fransen J, Deconinck F, Lenoir M, Vaeyens R, et al.
Rela-tive age, biological maturation and anaerobic characteristics in elite youth soccer players. Int J Sports Med 2013;34(10):897-903.
14. Cobley S, Baker J, Wattie N, McKenna J. Annual age-grouping and athlete
de-velopment: a meta-analytical review of relative age efects in sport. Sports Med 2009;39(3):235-56.
15. Andronikos G, Elumaro AI, Westbury T, Martindale RJ. Relative age efect:
implications for efective practice. J Sports Sci 2016;34(12):1124-31.
16. Buchheit M, Mendez-Villanueva A, Mayer N, Jullien H, Marles A, Bosquet L,
et al. Locomotor performance in highly-trained young soccer players: does body size always matter? Int J Sports Med 2014;35(6):494-504.
17. Buchheit M, Mendez-Villanueva A. Reliability and stability of anthropometric
and performance measures in highly-trained young soccer players: efect of age and maturation. J Sports Sci 2013;31(12):1332-43.
18. Wrigley RD, Drust B, Stratton G, Atkinson G, Gregson W. Long-term
CORRESPONDING AUTHOR
Giovani dos Santos Cunha Universidade Federal do Rio Grande do Sul.
Escola de Educação Física, Fisioterapia e Dança. Rua Felizardo, nº 750 - Jardim Botânico - Porto Alegre, RS. Brasil CEP: 90690-200
Email: [email protected]
19. Lago-Penas C, Casais L, Dellal A, Rey E, Dominguez E. Anthropometric and
physiological characteristics of young soccer players according to their playing posi-tions: relevance for competition success. J Strength Cond Res 2011;25(12):3358-67.
20. Deprez D, Fransen J, Boone J, Lenoir M, Philippaerts R, Vaeyens R.
Character-istics of high-level youth soccer players: variation by playing position. J Sports Sci 2015;33(3):243-54.
21. Cunha GS, Vaz MA, Geremia JM, Leites GT, Baptista RR, Lopes AL, et al.
Maturity Status Does Not Exert Efects on Aerobic Fitness in Soccer Players After Appropriate Normalization for Body Size. Pediatr Exerc Sci 2016;28(3):456-65.
22. Coelho ESMJ, Figueiredo AJ, Simoes F, Seabra A, Natal A, Vaeyens R, et al.
Discrimination of u-14 soccer players by level and position. Int J Sports Med 2010;31(11):790-6.
23. Carling C, le Gall F, Reilly T, Williams AM. Do anthropometric and itness
characteristics vary according to birth date distribution in elite youth academy soccer players? Scand J Med Sci Sports 2009;19(1):3-9.
24. Tanner JM. Growth at Adolescence. 2nd edn. Oxford: Blackwell Scientiic
Pub-lications, 1962.
25. Cohen J. Statistical Power Analysis for the Behavioral Sciences. Hillsdale: Law-rence Erlbaum; 1988.
26. Figueiredo AJ, Goncalves CE, Coelho ESMJ, Malina RM. Youth soccer players,
11-14 years: maturity, size, function, skill and goal orientation. Ann Hum Biol 2009;36(1):60-73.
27. Figueiredo AJ, Coelho ESMJ, Malina RM. Predictors of functional capacity and
skill in youth soccer players. Scand J Med Sci Sports 2011;21(3):446-54.
28. Gil SM, Badiola A, Bidaurrazaga-Letona I, Zabala-Lili J, Gravina L,
Santos-Concejero J, et al. Relationship between the relative age efect and anthropometry, maturity and performance in young soccer players. J Sports Sci 2014;32(5):479-86.
29. Augste C, Lames M. he relative age efect and success in German elite U-17
soccer teams. J Sports Sci 2011;29(9):983-7.
30. Buchheit M, Mendez-Villanueva A. Efects of age, maturity and body dimensions