w w w. s b f g n o s i a . o r g . b r / r e v i s t a
Original
Article
Nectandra
falcifolia
:
potential
phytopharmaceutical
for
skin
damage
protection
designed
by
statistical
approach
and
characterized
by
photoacoustic
spectroscopy
Fernanda
B.
Borghi-Pangoni
a,b,
Luana
M.
Tunin
b,
Kamilla
L.
Bonifácio
c,
Ana
Cláudia
Nogueira
d,
Luzmarina
Hernandes
e,
Fabio
Yamashita
f,
Décio
S.
Barbosa
c,
Mauro
L.
Baesso
d,
Maria
da
Conceic¸
ão
T.
Truiti
b,
Andréa
Diniz
a,b,∗aProgramadePós-graduac¸ãoemCiênciasdaSaúde,UniversidadeEstadualdeLondrina,Londrina,PR,Brazil
bProgramadePós-graduac¸ãoemCiênciasFarmacêuticas,DepartmentodeFarmácia,UniversidadeEstadualdeMaringá,Maringá,PR,Brazil cDepartamentodePatologiaeAnálisesClínicaseToxicológicas,UniversidadeEstadualdeLondrina,Londrina,PR,Brazil
dDepartamentodeFísica,UniversidadeEstadualdeMaringá,Maringá,PR,Brazil eDepartamentodeMorfofisiologia,UniversidadeEstadualdeMaringá,Maringá,PR,Brazil
fDepartamentodeCiênciaeTecnologiadeAlimentos,UniversidadeEstadualdeLondrina,Londrina,PR,Brazil
a
r
t
i
c
l
e
i
n
f
o
Articlehistory:
Received19November2014 Accepted10February2015 Availableonline16April2015
Keywords:
Antioxidantactivity
Nectandrafalcifolia
Photoacousticspectroscopy Standardizedextract Skinpermeation
a
b
s
t
r
a
c
t
Phytopharmaceuticalproductsarebeingusedinthetreatmentandpreventionofhealthproblems. Nowadays,thedevelopmentandevaluationofnovelpharmaceuticalproductsisexpensiveandtime con-suming.Astatisticalapproachisagoodtoolforoptimaldevelopmentprocesses.Nectandrafalcifolia(Nees) J.A.Castigl.exMart.Crov.&Piccinini,Lauraceae,aBrazilianspecies,isreportedasanti-inflammatory, anti-leishmanialandanti-microbial.However,thereislittleknownaboutitschemicalcomposition.For otherspeciesofNectandragenus,thepresenceofantioxidantcompoundsisreported.Inorderto opti-mizetheprocessofobtainingextractwithhighantioxidantactivity,differentextractionconditionswere testedfollowingastatisticalapproach.Twosequentialexperimentaldesignswereused–first,afactorial 23design,followedbycentralcomposite22.Theextractsmanufacturedbytheseexperimentalstatistical
matrixeshadtheirantioxidantactivityandphenoliccontentsquantifiedandtheresponsesurfaceplots werefittedinquadraticmodelsandtheypredictedthebestextractionconditionforthebestantioxidant activity.Thisstandardizedextractanditsantioxidantactivitywerebetterevaluatedbytwo comple-mentarytests(ABTSandBurstrespiratory).Atopicalformulationcontaining1%(w/w)ofstandardized extractwaspreparedandusedforaninvivoskinpermeationstudyusingatwo-doseapplication.The photoacousticspectroscopywasusedtoanalyzethesamplesfromthepermeationstudyandthe com-positionprofileofstandardizedextract.Inratskinsamples,thedatademonstratedthatforthehigher doseoftopicalformulation(5g/cm2),thestandardizedextractcouldcrossskinandbeseeninepidermis
anddermis.Thiswasnotthecaseforthelowerdose(2g/cm2)whichwasonlypresentintheepidermis.
ThisinformationsuggeststhatthisnovelstandardizedextractofN.falcifoliacouldbeexploredforskin damagepreventionortreatmentfordiseasesdevelopedbyoxidativedamage.
©2015SociedadeBrasileiradeFarmacognosia.PublishedbyElsevierEditoraLtda.Allrightsreserved.
Introduction
Currently,manystudiesareconductedtoobtainmore infor-mationaboutantioxidativeactivityof plantmaterialsandtheir
∗ Correspondingauthor.
E-mail:[email protected](A.Diniz).
derivatives.Theseresourceshavebeenfrequentlyusedintopical formulationstopreventcelloxidativedamage(Lonnietal.,2012). In abioprospectingapproach tospecies popularlyknownas “canelinha”(Nectandrafalcifolia(Nees)J.A.Castigl.exMart.Crov. &Piccinini,Lauraceae),studieshaveshownthatextractsfromthis speciesexhibitedanti-inflammatory,anti-leishmanialand antibac-terialactivities(OliveiradeMeloetal.,2006;Truitietal.,2005, 2006).Aboutphytochemicalprofile,noinformationaboutN.
fal-cifoliawasfound,butotherspeciesofthesamegenus(Nectandra
http://dx.doi.org/10.1016/j.bjp.2015.02.012
grandiflorus)haveshownhighcontentofflavonoids(Ribeiroetal., 2002).Bothspeciesaredistributedinmanytropicalandsubtropical areasoftheplanet,mainlyinSouthwestAsiaandBrazil(Oliveira deMeloetal.,2006).
Flavonoidandotherphenoliccompoundsareknownfordiverse biologicalactivities,includingantioxidantactivitybyscavenging offreeradicalsandalsobytheinhibitionofthelipidperoxidation (Hanasakietal.,1994).Thesebiologicalactivitiesincrease scien-tificandeconomicattentionforherbaldrugscontainingphenolic tobeusedfortopicalformulationinpreventionorrecoveryofskin damage.
In the meantime, there are several ways to obtain herbal extracts.Distinctextractivesystemscangeneratedifferent prod-uctsintermsofphenoliccontents,evenwhenmadefromthesame herbalspecies(Audietal.,2001;Laporniketal.,2005).
Becausetheseuncountablenumbersofvariationsin produc-tiveandanalyticprocessesofaplantextract,thefirststepforthe developmentofnewherbalextractshouldbetooptimizeand stan-dardizethemanufactureprocedures.Forthispurpose,theresponse surfacemethodology(RSM)hasbeenaveryusefultoolin improv-ingtheprocess.Itiswidelyusedtoassesstherelationshipbetween chemical contentsand biological activities.RSMis alsousedto understandinteractionsbetweenvariablestoobtainabetter activ-ity(Onsekizogluetal.,2010).
Presently, characterization of extract composition has been reported using different analytical techniques, from traditional spectroscopy (Berbicz et al., 2011) to modern methods like UPLC–MS/MS(Oszmia ´nskietal.,2014).Newmethodsarebeing appliedin scientificscenarios every dayandthe choiceforthe bettertechniqueiscase-dependent.
Inthisway,photoacousticspectroscopy(PAS)wasdescribedas atechniquethatcanbeusedtobiological/pharmaceutical analy-sisfordifferentsamplesmatrix.ThePAScanbeveryefficientto evaluatethepermeationanddistributionofsubstancesthrough
theskininvitro,ex vivoandinvivo(Truiteet al.,2007).PASis
basedonopticalabsorptionspectradeterminedbyphotoacoustic signalgeneratedbytheinteractionofmatterwitharadiationof knownwavelength(Berbiczetal.,2011;Truiteetal.,2007).This canbeused toanalyzethedepthofskinpermeationprofileof formulations,includingherbalextractformulations(Truiteetal., 2007).
Materialsandmethods
Materials
Allreagentsandsolvents usedwereanalyticalgrade, includ-ing gallic acid (Sigma®), ethyl alcohol P.A. (Synth®), methanol
P.A.(FMaia®),butylatedhydroxytoluene(BHT)(Aldrich®),
anhy-drous sodium carbonate P.A. (Neon®
), aluminum chloride P.A. (Synth), 2,2-diphenyl-1-picryl-hydrazyl (Aldrich®), Folin
Ciocal-teau(Dinâmica®)andquercetin(Sigma®).
Rawmaterial
Leavesof theNectandrafalcifolia(Nees)J.A.Castigl. exMart. Crov. & Piccinini, Lauraceae, were collected in Taquarac¸u, MS, Brazil. The material was herborized and deposited in Nupélia herbarium/UniversidadeEstadualdeMaringá,PR,Brazilwithwide voucherspecimennumberHNUPn◦1421.Thematerialwasdried
at40◦Cinahot-airoven,andgroundbyblademill(d=1.6mm).The
herbaldrugcharacterization(waterandashcontainingand gran-ulometricanalysis)wasmade(WHO,2011).Themethodusedfor theextractsproductionwasmaceration.
Experimentalstatisticaldesign
Twosequentialexperimentalmatriceswereused.Thefirstone wasafactorialdesign23 (Table1).Inordertoproduceextracts,
thevariableswere:extractiontime(ET)(h),ethanolconcentration (EC)(%)andplantproportions(PP)(w/v)whichwereappliedin twolevelsandacentralpoint(n=4).Thetotalphenoliccontents andantioxidantactivitywerequantifiedforeachextractproduced. Afterstatisticalanalysisofthefirstdataset,theethanol concen-trationwasfixedin100%andtheothervariableswereoptimized following the second experimentalmatrix, a central composite design22(Table1).
Forbothdesigns,allextractswereproducedatrandom(n=3). The alcohol was evaporated under reduced pressure at 40◦C,
lyophilizedandstoredinamberbottlesprotectedfromlight,heat andmoisture,whilewaitingforanalysis.ThesoftwareStatistica 7.0®(StatSoft,USA)wasusedtocomparetheresults.
RadicalscavengingactivityDPPHassay
Theantioxidantactivityofthelyophilizedextractswas quanti-fiedbythephotocolorimetricmethodofthefreeradicalDPPH(Prior etal.,2005).Thismethodwasadaptedandvalidated.Torunthe analysis,stocksolutionwereproducedbydissolvingtheextracts inmethanol(5ml).Analyseswereperformedintriplicate.
Fromstocksolutions,sixconcentrationswereprepared(20,24, 28,32, 36,40g/ml).Twomillilitersofthereactingsolutionof DPPH(0.06mg/ml)wereaddedto1.0mlofeachofthese concentra-tions.Thetimeofreactionwas30min.TheUVspectrometerwas calibratedusingablanksolution(3mlofmethanolP.A.)andthe negativesolution(noreaction)wascomposedof1mlofmethanol, addedto2mlofDPPHreactingsolution.Thewavelengthusedwas 516nm.
ThepercentageofinhibitionwascalculatedaccordingtoEq.(1),
IC (%)=
A0−A1
A0
×100 (1)
where A0 is the absorbanceof negative solution and A1 is the
absorbanceofsamplesreactions.
ThevaluesoftheIC50wereestimatedbylinearregressionfrom
theIC(%)curveversusconcentrations.
Determinationofthetotalphenoliccontent
The total phenolic content was quantified according to the method of Sousa et al. (2007) which was adapted and vali-dated.Twentymilligramsofeachdriedextractweredissolvedin methanolPAandtheexperimentwasperformed.Theblank solu-tion(methanolandtheotherreagents,excepttheextract)wasalso analyzedandallsampleswerereadat760nmatroomtemperature. Thecalibrationcurvewasbuiltforgallicacid(astandard phe-nolic compound) usingthe same reactionconditions. The total phenoliccontentwasdeterminedbyinterpolatingtheabsorbance ofthesamplesagainstacalibrationcurveforgallicacid.Thetotal phenoliccontentacidwasexpressedinequivalentmilligramsper gramofdryextract(mgGAE/gofextract).Allassayswereperformed intriplicate.
Determinationofthetotalflavonoidcontent
Thetotalflavonoidcontentinthedriedextractswasdetermined accordingtotheBrazilianpharmacopoeia(monographofthe
Cal-endulaofficinalisL.,Asteraceae)(Anvisa,2010),againadaptedand
validated.
Table1
FactorialDesignMatrix23andCentralCompositeDesignMatrix22fortheoptimizationofthetotalphenoliccontentsandantioxidantactivityofextractsofNectandrafacifolia leaves.
FactorialDesignMatrix23 CentralCompositeDesignMatrix22
X1* X2* X3* X1PP(w/v) X2ET(h) X3EC(%) X1* X2* X1ET(h) X2PP(w/v)
1.00 1.00 1.00 1:20 72 100 −1.00 −1.00 24 1:10
1.00 1.00 −1.00 1:20 72 50 −1.00 1.00 24 1:20
1.00 −1.00 1.00 1:20 24 100 1.00 −1.00 72 1:10
1.00 −1.00 −1.00 1:20 24 50 1.00 1.00 72 1:20
−1.00 1.00 1.00 1:10 72 100 −1.4142 0.00 14 1:15
−1.00 1.00 −1.00 1:10 72 50 1.4142 0.00 82 1:15
−1.00 −1.00 1.00 1:10 24 100 0.00 −1.4142 48 1:08
−1.00 −1.00 −1.00 1:10 24 50 0.00 1.4142 48 1:22
0.00 0.00 0.00 1:15 48 75 0.00 0.00 48 1:15
0.00 0.00 0.00 1:15 48 75 0.00 0.00 48 1:15
0.00 0.00 0.00 1:15 48 75 0.00 0.00 48 1:15
0.00 0.00 0.00 1:15 48 75 0.00 0.00 48 1:15
X1*,X2*,X3*:codedvariable;X1,X2,X3:decodedvariable.
total flavonoid contents wasdetermined applying the samples
absorbancetothequercetincurveequationandexpressedas
mil-ligramsofquercetinequivalentbygramofdriedextract(mgEQ/g
ofextract).Assayswereperformedintriplicate.
Complementaryantioxidativeactivityassaysforstandardized
extract.
Freeradicalsscavengeractivity(ABTS)assays
Theantioxidativecapacityofthestandardizedextractwas
mea-suredincomparisontothefreeradicalABTS+•(Sánchez-González
etal.,2005).TheABTS+•cationwasproducedbythereactionof
7mMofthestocksolutionABTSwith2.45mMofpotassium per-sulfate.TheionABTS+•solutionwasdilutedwiththephosphate
buffer(pH7.4)and readforabsorbance(0.7–730nm).Themass extracts(20,30and40g)weresolubilizedindimethylsulfoxide (DMSO).Thereactionwasmadebyadding10lofthesamples to4mloftheABTS+•solutiondiluted.Thesampleswerereadat
730nmafter6minofreaction.Theantioxidantcapacitywas cal-culatedbythepercentageofinhibitionoftheradicalABTS(IA%), accordingtoEq.(2):
IA (%)=100−
A1
A0
×100 (2)
whereA1 isthevalueofabsorbanceofthesampleandA0 isthe
valueoftheabsorbanceofthecontrolsolutioninabsenceofthe sample(Sánchez-Gonzálezetal.,2005).
RespiratoryBurstmethodology
Therespiratoryburstwasperformedusinghumanneutrophils toevaluatethekineticproductionofoxygenreactivespeciesafter stimulation by phorbol-myristate (PMA). Chemioluminescence wasmonitoredina microplatereaderVictorX3(PerkinElmer®
, EUA)(Wymannetal.,1987).Theresultswereexpressedincounts perminute(CPM).ForsamplesofstandardizedN.falcifoliaextract, theconcentrationstestedwere:20,30and40g/ml.Resultswere shownaccordingtothevaluesofthepeaksfromthekineticcurves andpresentedintheformofquartiles(1stand3rd).Testswere performedin14repetitions.
Topicalformulationcontainingthestandardizedextract(TPSE)
Anon-ionic emulsion base formulation wasdeveloped with the following composition: distilled water, propyleneglycol, ceteareth-20; glyceryl stearate; cetearyl alcohol; decyloleate; caprylic/caprictriglyceride; methylparaben; propylparaben. The
emulsionwasproducedbyaconventionaltechniqueinalaboratory setting.Subsequently,thestandardizedN.falcifoliaextract(SNFE) wasincorporatedin1%ofthebaseformulation.
Photoacousticspectroscopy(PAS)
TheSNFE,baseformulationandTPSEwereanalyzedby photoa-cousticspectroscopy.Thiswasdonetoverifythespectralresponse ofthecomponentsinultravioletandvisiblespectraineach sam-ple.Themeasurementwasperformedusinganexperimentalsetup (Baessoetal.,1994;Berbiczetal.,2011;OliveiraDeMeloetal., 2011).Themonochromaticlight(xenonarclamp–Oriel,Model 68820)withapowerof103watts(W)andanemissionintherange
180to4×103nm,andamonochromator(Oriel,Model77250).The
frequencyofthelightmodulationwascontrolledbya mechan-ical modulator (Stanford Research Systems, Model SR540). The microphone(Brüel&Kjaer,BKModel2669)wasattachedtothe photoacousticcellandconnectedtoapowersourceand preampli-fier.ThesignalfromthemicrophonewastransferredtotheLock-in (tunedamplifier)(EG&GInstrumentsModel5110).TheLock-in providestheintensityandphaseofthephotoacousticsignalwhich istransferredtoamicrocomputerviaGPIBinterface.The photoa-cousticspectrawereobtainedbymodulationfrequenciesof25Hz, powerof700Wandwererecordedbetween200and800nm.
Evaluationofpercutaneouspermeationprofileoftopical
formulationsbyphotoacousticspectroscopy(PAS)
Thepenetrationprofilesoftopicalformulations(baseandTPSE) wereevaluatedbyPAS(Baessoetal.,1994;OliveiraDeMeloetal., 2011).Theexperimentalprocedureinvolvingtheuseofanimals wasapprovedbytheEthicsCommitteeonAnimalUsein Experi-mentation,UniversidadeEstadualdeMaringá(n◦100/2012).
MaleWistarrats,weighing150–200g,weredividedintothree groupsandexposedto:(G1)baseformulation(doseappliedwas 2mg/cm2 (n=3));(G2)baseformulation(dose5mg/cm2(n=4));
(G3andG4)TPSEintwoapplications(2mg/cm2and5mg/cm2),
respectively.
Table2
Levelsofphenolictotalcontent(TP)(mgGAE/gextract)andIC50oftheantioxidantactivity(AA)fromtheNectandrafalcifoliaextractsobtainedbythefactorial23andCentral Composite22designs.
FactorialDesign23 CentralCompositeDesign22
X1 X2 X3 TP AA(DPPH) X1 X3 TP AA(DPPH)
ET EC PP Y1 Y2 ET PP Y1 Y2
24 50 01:10 141.9±18.4 27.7±1.2 24 1:10 765.4±42.6 24.7±1.1 24 50 01:20 231.8±28.5 19.4±0.7 24 1:20 529.8±2.5 27.1±0.3 24 100 01:10 765.4±42.7 24.7±1.1 72 1:10 864.8±1.7 19.8±0.6 24 100 01:20 529.8±2.5 27.1±0.3 72 1:20 567.2±46.9 23.2±0.5 72 50 01:10 278.3±26.6 21.5±1.6 14 1:15 136.9±1.17 32.9±0.4 72 50 01:20 385.5±33.3 26.8±0.7 82 1:15 757.1±10.2 21.4±0.1 72 100 01:10 864.8±1.72 19.8±0.6 48 1:08 903.2±24.7 22.8±0.4 72 100 01:20 567.2±46.9 23.2±0.5 48 1:22 520.5±49.1 30.9±0.5 48 75 01:15 74.5±19.5 22.3±0.1 48 1:15 655.5±13.2 23.2±0.8 48 75 01:15 104.5±25.0 22.4±0.2 48 1:15 648.3±1.1 24.2±0.4 48 75 01:15 94.95±1.0 22.9±0.4 48 1:15 641.2±26.7 22.8±0.7 48 75 01:15 72.25±1.8 23.1±0.1 48 1:15 647.7±1.8 23.9±0.7 Dataaremean±SD,n=3.
X1:ET–extractiontime;X2:EC–ethanolicconcentration;X3:PP–plantproportions;X1,X2,X3:decodedvariable;Y1,Y2:average±sd;TP:totalphenolic(mgGAE/gext); AA:DPPH-IC50(g/ml).
Allabsorptionspectrawereobtainedusingamodulation
fre-quency of 25Hz in the range of 200–800nm region of the
ultravioletspectrum(UV)andvisible(VIS).
Resultsanddiscussion
Thefirst matrix projected wasthefactorial 23 experimental
design.Resultsfortotalphenoliccontentsandantioxidant
activ-itybyDPPHmethodoftheextractsarepresentedinTable2.Total
phenoliccontentsareexpressedintermsofmilligramsofgallic acidpergramofdriedextract(mgGAE/gextract)andantioxidant activityisexpressedinaconcentrationoffiftypercentofinhibition (IC50).ANOVAwasperformedtothemodelsgeneratedbythe
fac-torial23forbothdependentvariablesandtheresultsarepresented
inTable3.
The performance of the extracts designed by this matrix wasfitted in a linear model for dependent variables. For total phenolic content, the adjusted model presented the overall mean470.63±5.31mgGAE/gextract.Themaineffects were:ET −84.04±10.62mgGAE/gextract,EC422.41±10.62mgGAE/gand PP106.74±10.62mgGAE/g.Significantinteractioneffectsbetween ET×ECwas−182.55±10.62mgGAE/gextractandforEC×PPwas −38.31±10.62mgGAE/g extract. The R2 was 0.99 and the R2
Adjustedwas0.99.
Theseresultsshowthatethanolconcentration(EC)wasthemost importantvariableforbetterextractiveefficiencyoftotal pheno-lic.Thehigherconcentrationofethanolpresentedbetterphenolic levelsintheextract.Ontheotherhand,theinteractionbetween ET×ECshowednegativeeffect,asdidtheinteractionETandPP.
Thesenegativesignsindicateanegativecontributiondecreasing extractiveefficiencywhenthevariablesECandPPareincreased.
Regardingantioxidant activity,theoverallmean ofIC50 was
23.86±0.16g/ml.ThemaineffectswereforETwas0.71±0.32, EC was −0.13±0.32 and for PP −1.93±0.32g/ml. Significant interactioneffectswerealsofound.Theywere2.17±0.32g/ml (ET×EC),3.67±0.32g/ml(ET×PP),−2.48±0.32g/ml(EC×PP) and−3.14±0.32g/ml (ET×EC×PP).Thus,themostimportant factor for thebest result for decreasingIC50 wasPP. However,
thebestresponsefordecreasingIC50 valueswastheinteraction
betweenPP×ECandET×EC×PP.Theimprovementinantioxidant capacityisrelatedtotheincreasingofEC,ETandPPlevelsbecause theypresentednegativeinteractioneffects.TheR2was0.94and
theR2Adjustedwas0.92.
ResultsshowthattheoptimalextractswereobtainedusingEC 100%.Additionally,instatisticalanalysisthecurvatureeffectwas significantandindicatedthatthenextstepneededtobethe rota-tiononthematrixplanetocharacterizetheexistenceofquadratic effect.Whereastherotationaxisledtotheestablishmentofaxial points(−1.4142and+1.4142)tothismodel(Table2),theupper axialpoint ofexecution wasnot possibleforECbecauseit was alreadytestedinamaximumconcentration(100%)level+1.
Since this point,thevariable ECwasfixedin100% and was designedthesecondexperimentalmatrix,acentralcomposite22.
ThenewmatrixispresentedinTable1andtheresultsforthese extractsarepresentedinTable2.ANOVAwasperformedtothe modelsgeneratedbycentralcomposite22forbothdependent
vari-ablesandtheresultsarepresentedinTable4.Themodelsadjusted fortheseconddatasetarepresentedinTable5.
Table3
ANOVAresultstothemodelgeneratedbythefactorial23fortotalphenoliccontentandfortotalantioxidantactivity. Factors Totalphenoliccontent Antioxidantactivity
SS df MS F p SS df MS F p
Curve 1,179,925 1 1,179,925 1741.9 0.00 10.32 1 10.32 16.4 0.00
ET 42,384 1 42,384 62.5 0.00 3.10 1 3.10 4.9 0.03
EC 1,070,591 1 1,070,591 1580.5 0.00 0.10 1 0.10 0.2 0.67
PP 68,369 1 68,369 100.9 0.00 22.57 1 22.57 35.8 0.00
ET×EC 199,966 1 199,966 295.2 0.00 28.39 1 28.39 45.0 0.00
ET×PP 746 1 746 1.10 0.30 81.12 1 81.12 128.5 0.00
EC×PP 8807 1 8807 13.0 0.00 36.97 1 36.97 58.6 0.00
ET×EC×PP 2366 1 2366 3.49 0.07 59.31 1 59.31 94.0 0.00
Pureerror 18,289 27 677 17.04 27 0.63
TotalSS 2,591,443 35 258.9 35
Table4
ANOVAresultstothemodelgeneratedbycentralcomposite22fortotalphenolicandfortotalantioxidantactivity.
Factors Totalphenoliccontent Antioxidantactivity
SS df MS F p SS df MS F p
ET(L) 385,439 1 385,439 633.42 0.00 235.40 1 235.4 469.42 0.00 ET(Q) 108,006 1 108,006 177.49 0.00 18.45 1 7.37 18.45 0.00 PP(L) 432,859 1 432,859 711.35 0.01 111.61 1 111.6 222.56 0.00 PP(Q) 63,384 1 63,384 104.16 0.00 14.02 1 14.0 27.96 0.00 ET(L)×PP(L) 2884 1 2884 4.74 0.10 0.85 1 0.8 1.69 0.20 Lackoffit 268,302 3 89,434 146.97 0.03 97.84 3 32.6 65.03 0.00
Pureerror 16,429 27 608.5 13.53 27 0.5
TotalSS 1,318,920 35 486.38 35
ET(L)×PP(L):interactionET(L)andPP(L);SS:sumsquare;df:degreeoffreedom;MS:meansquare;ET:extractiontime;PP:plantproportion;L:linearterm;Q:quadratic term.
In the second set of experiments, data of total phenolic
content of the overall mean value was 648.19±7.12mgGAE/g
extract,andsignificantmaineffectswere253.45±10.07mgGAE/g
extractforETlinear(L),−150.00±11.25mgGAE/gextractforET
quadratic(Q),−268.59±10.07mgGAE/gextractforthePP(L)and
114.91±11.25mgGAE/gextractforPP(Q).Nonemeaningful
inter-actioneffectwasobserved.TheR2was0.79andtheR2Adjusted
was0.75.
For the antioxidant values in the overall average IC50
was 23.58±0.20g/ml, and the significant variable effects
were−6.26±0.28g/ml for ET (L),1.96±0.32g/ml for ET(Q),
4.31±0.28g/mlforPP(L),1.70±0.32g/mlforPP(Q).Asfortotal
phenoliccontent,nonesignificantinteractioneffectwasobserved.
TheR2was0.78andtheR2Adjustedwas0.73.
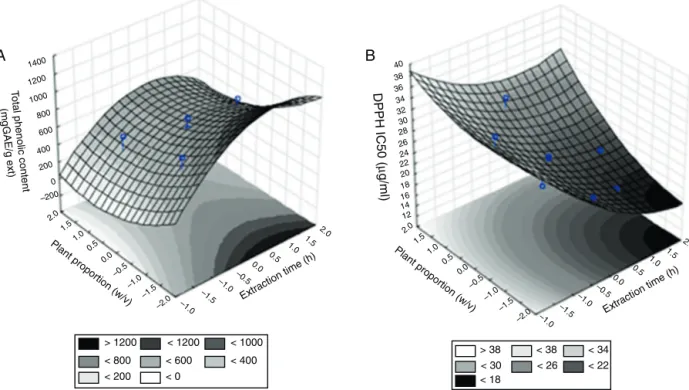
Responsesurfacesgraphsfromcentralcomposite22forthetotal
phenoliccontent(A)andantioxidantactivity(IC50)(B)oftheN.
falcifoliaextractsareshowninFig.1.
Thecombinedoptimalvalueforthetotalphenoliccontentand antioxidativeactivityoftheN.falcifoliaextractswaspredictedfor extractpreparedwithET100%,ET72handPP1:10(w/w).
Theextractproducedundertheseconditionswascalled stan-dardizedN.falcifoliaextract (SNFE).It wasproduced,dried and storedunderthesameconditionspreviouslydescribed.Thisextract haditsantioxidantactivityevaluatedbytwomoremethods(ABTS andrespiratoryburst)inordertoexplorebetterthisproperty.
TheABTS methodhas a differentantioxidant mechanism in comparisontoDPPH.Percentageofinhibition(%)fortheSNFEwas presentedtocompareresults.Themassesofextractusedforboth methodswere20,30and40g.For40gtheDPPHinhibition(%) was88.13andtheABTSinhibition(%)was93.50,for30gwasthe DPPH67.92andtheABTS93.10andfor20gtheDPPH47.71and theABTS77.40inhibition(%).
TheseresultsshowthattheSNFEhadanexpressiveantioxidant activityinbothmethodstested.Theywereperformedina sim-plereactionenvironment,asdescribed above.Theseresultswill notnecessarily bethesame ina biologicallycomplex medium. To investigate the antioxidative capacity of the SNFE in com-plexenvironment, the burst respiratory method was used and the results are shown in Fig. 2. This graph shows the activa-tionof humanneutrophilsby PMAin theabsence(neutrophils control)or in the presence of neutrophils added to SNFE. The
data were analyzed by theANOVA test and complemented by theTurkeytest.Forneutrophilscontrol,theaverage(n=14)was 32,497.35±4469.41cintillationsperminute(CPM),forthemassof 20gofSNFEwas13,408.35±1939.23CPMand30gofSNFEwas 11,403.28±2177.58CPMand40gofSNFEwas9716.57±1658.43 CPM.
Therespiratory burstshowedthatthehigher masshad bet-terantioxidant activity(9716.57CPM)comparedtothecontrol (32,497.35CPM),similartotheABTSandDPPHmethods,indicating thateveninacomplexreactionmediumasthecellular environ-ment,theextractwasabletomaintainhighantioxidantcapacity.
As discussed previously, other species of Nectandra present theflavonoidsasaclassofsecondarymetabolites.Onthatbasis, flavonoids contents characterizationand quantification in SNFE wasevaluatedbyphotoacousticspectroscopy(PAS)andflavonoid test,respectively.
TheopticalabsorptionspectrumbyPASofSNFEisshownin Fig.3(A)andtheresultoftheGaussiandeconvolutionusedto char-acterizethemainwavelengthsfor thespectrum canbeseenin Fig.3(B).
GaussiandeconvolutionofSNFE(Fig.3(B)),suggeststhatthe maximumabsorptionpeakat234nmand390nmarethebands II(ringA)andI(ringB)offlavonoids,respectively.Thissuggests thepresenceofflavonoidsintheextract,asseeninotherspecies (Ribeiroetal.,2002).
ThecontentofflavonoidsinSNFEwasdeterminedandshowed thevalueof41.72±1.92QE/mgextract,confirmingthepresence ofthisclassofcompoundswithknownantioxidantactivity.
Thegoalofthisworkwastodevelopanovelproductfor treat-mentand/orpreventionofskindamage.Toaccomplishthis,the permeabilityacrossskinneededtobeevaluated.Therefore,the SNFEwasincorporatedina basetopical formulationpreviously described,containing1%ofSNFE.Thefinal formulationandthe base(withoutSNFE)wereanalyzedbyPASinordertoconfirmtheir absorptionprofiles.
ResultsarepresentedinFig.3(AandB).TheyshowthatSNFE hadawiderangeofabsorption,fromultraviolettovisibleregion (200–800nm).Fig.3(B)presentsthecentersabsorbersobtainedby Gaussiandeconvolution.Theysuggestthepossiblespecies respon-sibleforsuchabsorption.Thetopicalformulationwith1%ofSNFE presentsbandsinpositionssimilartotheSNFEspectrum,butwith
Table5
AdjustedmodelsforphenoliccontentsandantioxidantactivityofNectantrafalcifoliaextractsproducedaccordingacentralcomposite22design.
Dependentvariables Models R2 pvalue Equation
Totalphenoliccontent(PC) PC
=(648.19±7.12)+(253.45±10.7)·ETL−(150.00±11.25)· ETQ−(268.59±10.07)·PPL+(114.91±11.25)·PPQ0.79 <0.05 (3)
Antioxidantactivity(AA) AA
=(23.58±0.20)−6.26±0.28)·ETL+(1.96±0.32)·ETQ+ (4.31±0.28)·PPL+(1.70±0.32)·PPQ0.78 <0.05 (4)
1400 1200 1000 800 600 400 200 –200 2.0 2.0 1.5 1.0 0.5 0. 0 –0.5 –1.0 –1 .5 –1.0 1.5 1.0 –1.0 –1.5 –2.0 0.5 –0.5 0.0 0
Extraction time (h ) Plant pr oportion (w/v ) To tal phenolic conten
t (mgGAE/g ext) 40 38 36 34 32 30 28 26 24 22 20 18 16 14 12 2.0 2.0 1.5 1.0 0.5 0.0 –0.5 –1.0 –1.5 –1.0 1.5 1.0 –1.0 –1.5 –2.0 0.5 –0.5 0.0 Extraction time (h ) Plant pr oportion (w /v) DPPH IC50 ( µ g/ml ) > 1200
B
A
< 1200 < 1000
< 800 < 600 < 400 < 200 < 0
> 38 < 38 < 34 < 30 < 26 < 22 < 18
Fig.1.Responsesurfaceplotfromcentralcomposite22forthetotalphenoliccontent(A)andforantioxidantactivity(B)inNectandrafalcifoliaextracts
50000 40000 30000 20000 10000 0
Neutrophils Nect 20
µg Nect 30 µg Nect 40 µg Neutrophils Nect 20 µg Nect 30 µg Nect 40 µg
Peak value on the kinetic curve
(C.P
.M.)
Fig.2.Graph–Boxplotofthepeakvaluesonthekineticcurves.Datawereanalyzed byANOVAcomplementedbyTurkey’s*p<0.001comparedtocontrolneutrophils; **p<0.001comparedtocontrolneutrophilsand0.01comparedtoNectandra20g. C.P.M.:countperminute.
alowerintensity.Baseformulationspectrumisalsopresentedin
Fig.3(A);itdidnotshowabsorption.
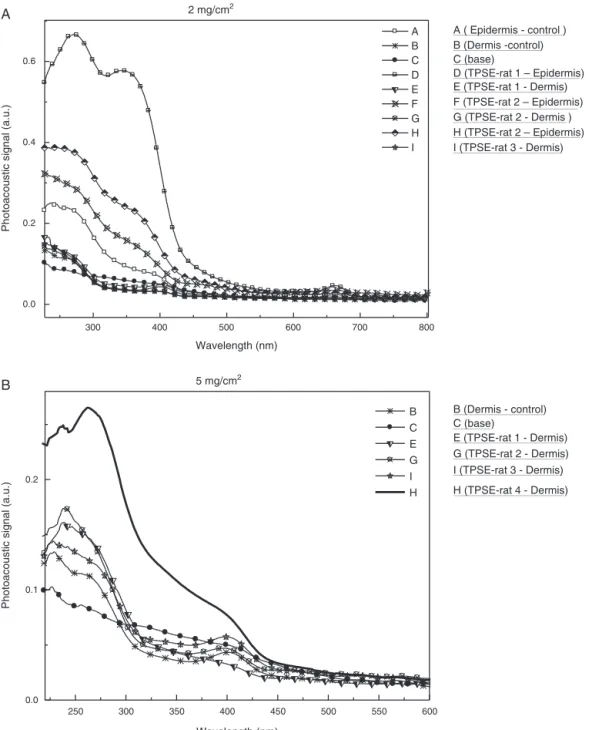
Forevaluatingskinpenetration,thefrequencyofmodulation usedandthethermaldiffusivityoftheskinwasd=4×10⁻⁴cm2/s.
Thethermal diffusionlength,in whichthephotoacousticsignal generated, wasapproximately23m.Considering that samples hadanaveragethicknessof770microns, thickerthanthe pen-etrationcapacity ofthesignal,thesampleswere excitedat the epidermalanddermalsideandevaluated.
Toillustrate,inFig.4(A)and (B)arepresentedtheresultsof thePASspectrumofskinsamplesofoneindividualofG3andG4, respectively.Fig.4(A)showsdataforthelowerdose(2mg/cm2).
ItindicatesthepresenceoftheemulsionwithSNFEinthe epider-mis,asevidencedbyincreasesinopticalabsorptionobservedin treatedskincomparedtonontreated(290and320nm,450nm and470and650and665nm).The650and665nmoptical absorp-tionassignedtothechlorophyllspresentedinSNFE(Cunhaetal.,
A
0.0 0.1 0.2 0.3 0.4 0.5 0.0 0.1 0.2 0.3 0.4 0.5 SNFE Fit 234 nm 326 nm 390 nm 444 nm 490 nm 548 nm 611 nm 629 nm 742 nmPhotoacoustic signal (a.u.) Photoacoustic signal (a.u.)
300 400 500 200 300 400 500
Wavelength (nm) Wavelength (nm)
700 700
600 600
B
800 800
2 mg/cm2
A
5 mg/cm2
B
300 400 500 600 700 800
0.0 0.2 0.4 0.6
A B C D E F G H I
Photoacoustic signal (a.u.)
Photoacoustic signal (a.u.)
Wavelength (nm)
A ( Epidermis - control ) B (Dermis -control) C (base)
D (TPSE-rat 1 – Epidermis) E (TPSE-rat 1 - Dermis) F (TPSE-rat 2 – Epidermis) G (TPSE-rat 2 - Dermis ) H (TPSE-rat 2 – Epidermis) I (TPSE-rat 3 - Dermis)
250 300 350 400 450 500 550 600
0.0 0.1 0.2
B C E G I H
Wavelength (nm)
B (Dermis - control) C (base)
E (TPSE-rat 1 - Dermis) G (TPSE-rat 2 - Dermis) I (TPSE-rat 3 - Dermis)
H (TPSE-rat 4 - Dermis)
Fig.4. OpticalabsorptionspectrumobtainedbyPASofTPSAintheepidermalanddermalsideoftheskinsampleswithoutapplicationofproducts(epidermiscontroland dermiscontrol)andfacestheepidermalanddermalsamplesofskinwithTPSAdoses(A)2mg/cm2and(B)5mg/cm2.
2009).Regardingthedermis,thepresentdataindicatesthatlittle ornopermeationoccurred,sincetheonlynotabledifferenceisa slightincreaseintheopticalabsorptionnear250nmregion.
Fig.4(B)(higherdose−5mg/cm2)showsthepresenceofthe topicalformulationcontainingSNFEinthedermisandepidermis,as indicatedbytheincreasedopticalabsorptioninallregionbetween 240and410nm.
Thecomponentsofbaseformulationdidnotcontributetothe increasedabsorptionbetween240and300nm,sinceitwasnot observedinthedermis.Theseresultsshowthatthefilmthickness oftheproductappliedtotheskinisanotherfactortobeconsidered intermsoftheproductpenetration.
Considering the capacity of SNFE across skin and anti-leishmanial,antimicrobialandantiinflammatoryactivities previ-ouslystated (Oliveira de Melo et al., 2006; Truiti et al., 2005, 2006),canbepostulatednewstudiesfortegumentarleishmaniaor
bacterialinfectionsonskin,aswellinflammatoryprocessthatused tobemediatedbyoxidativeprocess.
Insummary,thedatashowsthatthestatisticalexperimental designcouldcorrectlyguidethestandardizationofextractofN.
fal-cifolia,whenhighantioxidantactivityisdesired.Thisextractcould
crosstheskinbarrierandisthereforeapotentialnovelproductfor skindiseasesandprotection.However,moreexperimentsare nec-essarytoconfirmthisprobableprofileinhumansandintoxicity studies.
Authors’contributions
contributedtotheexperimentaldesignanalysis.ACNandMLB con-tributedtothephotoacousticspectroscopyanalysis.LHcontributed tothepermeationanalysis.KLBandDSBcontributedtothe com-plementaryantioxidativeactivityassays.Alltheauthorshaveread thefinalmanuscriptandapprovedthesubmission.
Conflictsofinterest
Theauthorsdeclarenoconflictsofinterest.
Acknowledgements
Theauthorswouldliketoexpresstheirgratitudeforfinancial supporttoCAPESandCNPq,toLEPEMC-UEMforUV-spectrometer andtoCOMCAP-UEMforthephotoacousticspectrometer availabil-ities.
References
Anvisa,2010.AgênciaNacionaldeVigilânciaSanitária.FarmacopeiaBrasileira,5th ed.
Audi,E.A.,Campos,E.J.V.,Rufino,M.,GarcíaCortez,D.A.,Amado,C.A.B.,Soares, L.A.L.,Petrovick,P.R.,Mello,J.C.P.,2001.PetiveriaalliaceaL.:plantdrug qual-itycontrol,hydroalcoholicextractstandardizationandpharmacologicalassay oflyophilizedextract.ActaFarm.Bonaer.20,225–232.
Baesso,M.L.,Shen,J.,Snook,R.D.,1994.Laser-inducedphotoacousticsignalphase studyofstratumcorneumandepidermis.Analyst119,561–562.
Berbicz,F.,Nogueira,A.C.,Neto,A.M.,Natali,M.R.M.,Baesso,M.L.,Matioli, G., 2011.Useofphotoacousticspectroscopyinthecharacterizationofinclusion complexesofbenzophenone-3-hydroxypropyl--cyclodextrinandexvivo eval-uationofthepercutaneouspenetrationofsunscreen.Eur.J.Pharm.Biopharm. 79,449–457.
Cunha, F.P.,daCosta, L.J.L.,da Fernandes, A.J.D.,Souza, T.P.,de Soares,L.A.L., 2009.DevelopmentandoptimizationofextractivesfromAstroniumurundeuva (allemão)Engl. by factorialdesign.Braz.Arch.Biol. Technol.52, 647–652, http://dx.doi.org/10.1590/S1516-89132009000300017.
Hanasaki,Y.,Ogawa,S.,Fukui,S.,1994.Thecorrelationbetweenactiveoxygens scavengingandantioxidativeeffectsofflavonoids.FreeRadic.Biol.Med.16, 845–850.
Lapornik,B.,Proˇsek,M.,Wondra,A.G.,2005.Comparisonofextractspreparedfrom plantby-productsusingdifferentsolventsandextractiontime.J.FoodEng.71, 214–222.
Lonni,A.A.S.G.,Longhini,R.,Lopes,G.C.,deMello,J.C.P.,Scarminio,I.S.,2012. Sta-tisticalmixturedesignselectiveextractionofcompoundswith antioxidant activityandtotalpolyphenolcontentfromTrichiliacatigua.Anal.Chim.Acta719, 57–60.
OliveiradeMelo,J.,daConceic¸ãoTorradoTruiti,M.,Muscará,M.N.,Bolonheis,S.M., Dantas,J.A.,Caparroz-Assef,S.M.,Cuman,R.K.N.,Bersani-Amado,C.A.,2006. Anti-inflammatoryactivityofcrudeextractandfractionsofNectandrafalcifolia leaves.Biol.Pharm.Bull.29,2241–2245.
Oliveira De Melo, J., Pedrochi, F., Baesso, M.L., Hernandes, L., Truiti, M.C.T., Baroni,S.,Bersani-Amado,C.A.,2011.Evidenceofdeeppercutaneous penetra-tionassociatedwithanti-inflammatoryactivityoftopicallyappliedHelicteres gardneriana extract A photoacoustic spectroscopy study. Pharm. Res. 28, 331–336.
Onsekizoglu,P.,SavasBahceci,K.,Acar,J.,2010.Theuseoffactorialdesignfor mod-elingmembranedistillation.J.Membr.Sci.349,225–230.
Oszmia ´nski,J.,Kolniak-Ostek,J.,Wojdyło,A.,2014.Characterizationofphenolic compoundsandantioxidantactivityofSolanumscabrumandSolanumburbankii berries.J.Agric.FoodChem.62,1512–1519.
Prior,R.L.,Wu,X.,Schaich,K.,2005.Standardizedmethodsforthedeterminationof antioxidantcapacityandphenolicsinfoodsanddietarysupplements.J.Agric. FoodChem.53,4290–4302,http://dx.doi.org/10.1021/jf0502698.
Ribeiro, A.B., Silva,D.H.S., Bolzani, V.da S., 2002. Antioxidant flavonol glyco-sides from Nectandragrandiflora (Lauraceae). Eclética Química 27,35–44, http://dx.doi.org/10.1590/S0100-46702002000200004.
Sánchez-González,I.,Jiménez-Escrig,A.,Saura-Calixto,F.,2005.Invitroantioxidant activityofcoffeesbrewedusingdifferentprocedures(Italianespressoandfilter). FoodChem.90,133–139.
Sousa, C.M.de M., Silva, H.R.E., Vieira-Jr., G.M., Ayres, M.C.C.,Costa, C.L.S.da, Araújo, D.S., Cavalcante, L.C.D., Barros,E.D.S., Araújo, P.B.de M., Brandão, M.S.,Chaves, M.H.,2007. Fenóis totaise atividade antioxidante de cinco plantas medicinais. Quim. Nova 30, 351–355, http://dx.doi.org/10.1590/ S0100-40422007000200021.
Truite,C.V.R.,Philippsen,G.S.,Ueda-Nakamura,T.,Natali,M.R.M.,Filho,B.P.D.,Bento, A.C.,Baesso,M.L.,Nakamura,C.V.,2007.Percutaneouspenetration,melanin activationandtoxicityevaluationofaphytotherapicformulationforvitiligo therapeutic.Photochem.Photobiol.83,1529–1536.
Truiti,M.daC.T.,Bersani-Amado,C.A.,DiasFilho,B.P.,Sarragiotto,M.H.,deSouza, M.C.,2006.ScreeningoffiveBrazilianplantsforanti-inflammatoryand antimi-crobialactivities.Pharm.Biol.44,516–521.
Truiti,M.C.T.,Ferreira,I.C.P.,Zamuner,M.L.M.,Nakamura,C.V.,Sarragiotto,M.H., Souza,M.C.,2005.AntiprotozoalandmolluscicidalactivitiesoffiveBrazilian plants.Braz.J.Med.Biol.Res.38,1873–1878.
WHO,2011.QualityControlMethodsforHerbalMaterials,Switzerland.
Wymann,M.,Vontscharner,V.,Deranleau,D.,Baggiolini,M.,1987.Theonsetof therespiratoryburstinhuman-neutrophilsrealtimestudiesofH2O2