The Impact of Public R&D Funding on Open Innovation
Pekka SALMI1
ABSTRACT
While the effects of public R&D funding on innovation inputs, outputs and strategies of firms have been studied extensively, little is known about the impact public R&D funding may have on open innovation practices. We made several hypotheses about different effects of public subsidies from the open innovation point of view and then tested these hypotheses with data that comes from a survey on innovation practices in China, Finland and Spain. More specifically, the prevalence of open innovation in a country was hypothesized to be related to the level of public R&D funding. The results show that Chinese firms make external technology/IP acquisitions more often, as well as engage more frequently in selling of intellectual assets, than their Spanish (and Finnish) counterparts. The results also show that Chinese firms are less likely to make new collaboration agreements after participating in publicly funded R&D projects.The findings therefore generally support the idea that a lower level of available public R&D funding facilitates the adoption of open innovation practices in firms.
KEYWORDS: intellectual assets, open innovation, public subsidies, R&D collaboration.
JEL CLASSIFICATION: H25, O32, O34, O38
INTRODUCTION
Public R&D funding plays a significant role in national innovation systems. It encourages companies, as well as universities and public research institutes, to start new research and development activities and thus to create new knowledge, competencies and innovations. However, from a governmental point of view, the challenge concerning private sector R&D funding is to allocate resources only to socially beneficial projects and projects which would not be carried out in the absence of a subsidy. The effects of public R&D funding on the innovation activities of private firms have therefore been studied quite extensively. In particular, researchers have examined different additionality effects of public subsidies (Buisseret et al., 1995; Davenport et al., 1998). First, input additionality means that the company invests more in R&D than it would otherwise do without public funding. The question is therefore, do public subsidies increase total private R&D expenditures (i.e., whether public R&D is a complement or substitute for private R&D). Output additionality
in turn refers to the proportion of innovation outputs which would not have been achieved without public support. Researchers have tried to measure this e.g. in terms of patents, productivity and profitability. Finally, behavioral additionality refers to the difference in firm behavior and strategy (decision making) resulting from the existence and availability of public subsidies. Researchers have, for example, investigated whether public subsidies result in more R&D cooperation and networking.
However, while the effects of public R&D funding on innovation inputs, outputs and strategies of firms have been examined in the literature, so far there has been little discussion on these effects in the context of open innovation practices (see, however, de Jong et al., 2008). The concept of open innovation has emerged especially from concerns related to the costs and efficiency of R&D efforts. On the one hand, it differs radically from the traditional model of closed, in-house innovation as it combines internal and external sources of knowledge to advance the development of new technologies. On the other hand, open innovation also seeks to exploit new opportunities through external paths to market if a technology is not suitable for the current business model (Chesbrough, 2003, 2006). These alternative paths to markets include, for instance, selling of technologies or intellectual property (IP), out-licensing, spin-offs and joint ventures. Prior research has mostly focused on external knowledge acquisition and the make-or-buy decision (Ferretti & Romano, 2006; Granstrand et al., 1992; Veugelers & Cassiman, 1999), but in recent years interest in external knowledge exploitation (in terms of “selling” or exchanging knowledge in the market) has also grown significantly (Lichtenthaler, 2004; Tschirky et al., 2004). In addition to these “outside-in” and “inside-out” processes, Gassmann and Enkel (2004) have further identified the “coupled process” which combines the previous two core processes. The coupled processes are needed to link the outside-in and inside-out processes e.g. in alliances and strategic networks, where a firm cooperates with complementary companies.
Since it is obvious that open innovation model requires different organizing principles for managing research and innovation, there is a need to examine what kind of impact public funding may have on different practices (or forms) of open innovation. In this paper, we will therefore briefly review the literature on the concepts of additionality and make hypotheses about the different effects of public subsidies from the open innovation point of view. We will then test these hypotheses with data that comes from a survey on innovation practices in China, Finland and Spain. The paper is organized as follows: The next section includes the literature review and hypotheses, the third section describes research methods and survey data, and results are presented in the fourth section. The findings of the paper, as well as limitations of the study, are discussed in the last two sections.
1. PUBLIC R&D FUNDING AND ADDITIONALITY EFFECTS
1.1. Input additionalities
The key question regarding input additionality is whether public R&D is a complement or substitute for private R&D. If a firm’s total R&D expenditure increases because of a subsidy, the funding has a complementary effect (i.e., public funding allows a firm to start more projects or to conduct some projects on a larger scale). Especially important is the case in which a firm undertakes a project that could not have been started otherwise (here, the term project additionality has also been used; see Davenport et al., 1998). If, on the other hand, a firm uses a subsidy only to replace its own private investments, public funding does not generate additional R&D investments. This “crowding-out” effect may occur since firms always have an incentive to apply for public funding (Aerts & Schmidt, 2008).
criticize the research methods of existing studies (see Cerulli, 2010 for a review of the principal econometric models). Moreover, there has been criticism that existing studies have not explicitly taken into account that public funding may be endogenous. That is, the positive correlation between public and private R&D expenditures may result from the fact that firms with an increase in private spending receive subsidies – not because subsidies cause private R&D to increase (Ali-Yrkkö, 2004). Taking into account this potential endogeneity, Ali-Yrkkö (2004) nevertheless finds that public R&D financing does not crowd out privately financed R&D.
Provided that public funding increases total R&D expenditures, from an open innovation point of view it is an interesting question to what extent this results from increased internal R&D activities and to what extent from increased external sourcing of technologies. Since one of the key input additionality effects is that additional funding enables firms to undertake projects that would have been otherwise too expensive or too risky (as indicated above) and the open innovation literature, in turn, suggests that leveraging external innovations and technologies reduces the cost and risks of R&D (Chesbrough, 2006), it is reasonable to assume that at the level of a single project public funding may favor internal over external R&D. That is, additional funding is expected to lessen the need for external innovation, and a lack of funding, by contrast, drives firms to engage in external sourcing of technologies. We therefore suggest that:
Hypothesis 1a: The higher the level of public R&D expenditures and, therefore, the higher the total amount of available funding for an R&D project, the less likely firms will engage in external knowledge sourcing.
Moreover, there may be a difference in the level of this effect between small and large firms. Although earlier studies considering the input additionality effects have provided mixed results (Ali-Yrkkö, 2004; Falk, 2007 have found that large firms use public funds more effectively, while Lööf and Heshmati, 2005 argue that there are input additionality effects only for small firms), we nevertheless expect that the effect of a subsidy on internal vs. external R&D decision is greater in small firms. This is because small firms have been found to more often make an exclusive choice between internal and external R&D (make-or-buy decision) than larger firms which usually follow a mixed strategy of making and buying (Veugelers & Cassiman, 1999). In other words, public subsidies are expected to result in internal R&D projects (which otherwise would not be carried out) more often in small firms and a low level of public R&D funding, in contrast, will lead to increased technology sourcing. Hence:
Hypothesis 1b: The effect of a low level of public R&D funding facilitating the acquisition of external technologies is larger in small firms.
1.2. Output additionalities
the other hand, while this number indicates the success of R&D, it only shows an intermediate R&D outcome which does not tell about the profit generating part of the innovation activity. Indeed, most patents in firms are neither used nor licensed (as much as 70 percent of patent portfolio may be unutilized in patent-intensive US firms; Rivette & Kline, 2000).
Even if one considers only studies which have used patenting as an indicator for the R&D output, the empirical evidence on additionality effect is fairly inconclusive. For instance, when analyzing patenting behavior of German firms, Czarnitzki et al. (2004) found that research subsidies do not have a significant impact on patenting (or R&D), whereas Czarnitzki and Hussinger’s (2004) study, also on German firms, concluded that the additionally induced R&D expenditure (i.e., the sum of the public subsidy itself and the additionally spent private funds due to the receipt of subsidies; see Czarnitzki & Hussinger, 2004, pp. 2-4) showed a positive impact on the patenting behavior. Yet another study examining the effects of public R&D funding and collaborative R&D activities among firms and public research institutions in Germany was conducted by Czarnitzki and Fier (2003). In this study the authors found that (within the group of collaborating firms) participants in publicly sponsored R&D consortia have a higher propensity to patent than firms in non-sponsored networks.
While there are probably several factors that may lead to the differences in research results (such as regional and sectoral characteristics), the magnitude of additionality effect seems also to depend on whether subsidies are combined with collaborative activities. Indeed, Czarnitzki et al. (2004) and Ebersberger (2005) found that in Finland firms which invest more in R&D due to subsidies or collaboration (or both) show more patenting activity. In other words, public funding not only yields the largest effects when combined with collaborative innovation activities, but also increases the output of firms already engaged in cooperation. This output additionality effect of (publicly supported) collaborative R&D activities may be at least partly explained by knowledge spillover effects that occur within the research collaboration (cf. Branstetter and Sakakibara’s (1998) analysis of Japanese research consortia).
Now, if we first examine the case where a firm gets only financial support for an R&D project, it seems clear that output additionality (if exists) is primarily related to the inside-out process (selling side) of open innovation. That is, if a firm can create more intellectual assets as a result of public support, it has a possibility to convert these into cash by selling them in the market. Since the selling of knowledge and technologies has become increasingly prevalent recently (Arora et al., 2004), one may assume that the output additionality of public funding will result in more inside-out processes in firms (one should note, however, that the time span between receiving a subsidy for a project and selling the resulting innovations is typically counted in years, so the effect is not immediate). Hence:
Hypothesis 2a: The higher the level of public R&D funding, the more likely firms will be engaged in selling intellectual assets (due to the output additionality effect).
On the other hand, it is also possible that firms need to sell technologies and intellectual assets to compensate for large R&D expenditures, or a lack of R&D funding thereof. That is, a higher probability of inside-out open innovation processes may result from a lower level of public funding as well. We therefore suggest another, competing hypothesis for the effect of public subsidies on inside-out open innovation:
Secondly, if a public support scheme includes (or requires) a combination of subsidies and collaborative activity (e.g. in public research projects), it is obvious that a firm is likely to utilize the knowledge spillovers from other parties. The output additionality could therefore be partly attributed to the increased acquisition of external knowledge. However, in this case we do not expect that firms will use contractual agreements to source additional knowledge from the collaboration partners. And for this reason we do not propose that publicly supported R&D collaborations will directly facilitate the outside-in processes of open innovation in firms, either.
1.3. Behavioral additionalities
While collaborative R&D activities among firms (and between firms and public research institutes) were already related to the output additionality effect above, an increase in willingness to cooperate may also be a behavioral additionality effect of public funding. That is, public support has an impact on firms’ business practices and processes, as well as their external linkages. Research on behavioral additionality has been largely conceptual since tracking intangible behavioral changes resulting from public support is much more difficult than monitoring physical resource inputs and outcomes of innovation activities. For instance, several refinements for the behavioral additionality concept have been proposed (for a review, see Falk, 2007). One proposed behavioral effect of public funding is that a subsidy allows a firm to start an innovation process earlier or to speed up the process and thus to complete it earlier – e.g. in order to better meet a market window. This effect is called acceleration additionality. Another proposed effect is scope additionality
which means that the coverage of an innovation activity is expanded to a wider range of markets or applications than would have been possible without public support (Georghiou, 2002). This can lead to a higher risk profile of R&D projects (i.e., areas beyond the firm’s key competencies increase both technical and market risk), but also to new partnerships and collaboration networks (Falk, 2007). Since increased collaboration necessitates the development of inter-organizational routines, as well as facilitates inter-organizational learning, public support can also change the ‘cognitive capacity’ of a firm (Bach & Matt, 2005). This cognitive capacity additionality may manifest itself e.g. as enhanced absorptive capacity (which is the ability to recognize, assimilate and apply external knowledge to commercial ends; Cohen & Levinthal, 1990).
R&D collaborations between science and industry are less likely to be continued after funding has ended compared to already existing cooperations.
Regarding open innovation practices, additionalities related to research cooperation and project scope appear to be the most important to consider. First, if publicly supported R&D collaborations improve a firm’s networking capabilities and foster trust among partners, it is likely that the firm will engage more in cooperative research with other companies, research labs, and universities. This means also that coupled open innovation processes (i.e., orchestration of outside-in and inside-out processes) will be used more frequently in future collaborations. We therefore expect that:
Hypothesis 3: The more often a firm has participated in publicly supported R&D collaborations, the more likely it will engage in alliances and research partnerships in future.
Secondly, if a firm engages in projects which involve new research directions beyond its current competencies, it is more likely that the resulting innovation(s) cannot be used in the current/future business model (even if innovation is successful). Therefore, scope additionality may also mean that it is more likely that the firm needs to find external paths to market for the resulting innovations. In other words, scope additionality of public funding (along with output additionality effect) will lead to increased selling of knowledge in firms. Hence:
Hypothesis 4: The larger the scope of an R&D project, the more likely it is that a firm needs to use external paths to market for the resulting innovations.
Finally, cognitive capacity additionality can be seen to indirectly facilitate open innovation practices in firms. For instance, the cognitive capacity additionality effect resulting from R&D cooperations may manifest itself as enhanced absorptive capacity, which in turn is crucial to the success of outside-in processes of open innovation. On the other hand, the additional R&D projects that a firm is able to undertake with the help of public funding may also more directly increase absorptive capacity in the long run. Since a higher level of absorptive capacity should facilitate the utilization of external knowledge in R&D, one can assume that the ratio of external versus internal R&D will increase with increased R&D spending. However, one must emphasize that this is a long-term effect and does not contradict our hypothesis 1a (that additional funding is expected to lessen the need for external innovation at the level of individual projects).
2. DATA AND RESEARCH METHODS
2.1. Survey description and data on public R&D funding
R&D funding and/or participating in publicly funded projects had led to the following impacts:
Q1: Buying of patents/licenses/IPR
Q2: Buying of a technological solution
Q3: Selling of patents/licenses/IPR
Q4: Selling of a technological solution
Q5: New (research) collaboration contracts/subcontracting agreements
Q6: Alliances/coalitions between project partners
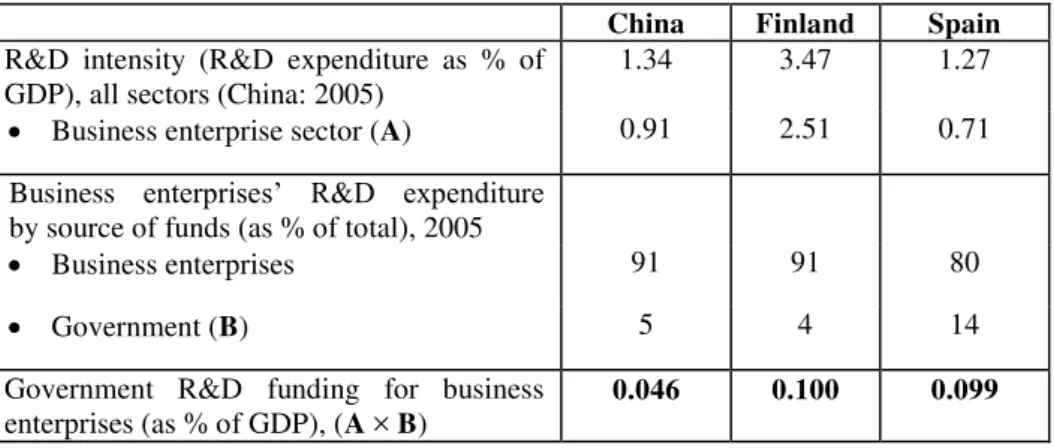
Q7: Increased collaboration with universities and other research institutions However, since we don’t know the amount of subsidies the firms have received, or the number (frequency) of publicly funded projects they have participated in, we will estimate the effects of public funding on the above open innovation practices by comparing the results from China, Finland and Spain. That is, since there are significant differences in the level of public spending on R&D between the three countries, we will assume that additionality effects in firms vary accordingly. In 2007, the levels of R&D expenditures in China, Finland and Spain were as follows:
Table 1. R&D expenditures in China, Finland and Spain
China Finland Spain
R&D intensity (R&D expenditure as % of GDP), all sectors (China: 2005)
1.34 3.47 1.27
Business enterprise sector (A) 0.91 2.51 0.71
Business enterprises’ R&D expenditure by source of funds (as % of total), 2005
Business enterprises 91 91 80
Government (B) 5 4 14
Government R&D funding for business enterprises (as % of GDP), (A × B)
0.046 0.100 0.099
Source: Eurostat: Science, technology and innovation in Europe, Pocketbooks, 2009 edition (Eurostat, 2009).
2.2 Selection and demographics of firms
The data were collected during fall of 2007. In Finland, the survey was conducted by using two waves of emails and a web-based survey instrument. A cover letter describing the purpose of the survey was mailed to 510 persons employed in executive or R&D management positions in Finnish firms. The firms were selected from a commercial business database (www.inoa.fi) by choosing the largest companies having their own R&D activities. After a reminder e-mail to non-respondents, a total of 59 surveys were completed, for an overall response rate of 11.6%. In Spain, the survey was executed similarly by using two waves of emails and a web-based questionnaire. Utilizing a database of alumnis of a leading business school who had given prior permission to receive emails, an initial sample of 2105 addresses of persons currently employed in higher management positions in Spanish firms was selected. Altogether, 131 usable responses were received, for a response rate of 6.2%. Finally, in China the data were collected through email and a paper survey, and also by phone in a few cases. The target companies for the survey were selected from firms operating in the Yunnan Province through the following process: First, all high-tech firms which were authenticated by the government were identified. Of these, the major firms operating in Yunnan Province were selected. The final sample was obtained by identifying firms that had R&D activities according to another regional company database. Eventually around 800 candidate companies for the survey were selected and of these 501 responded to the survey. In each country, the survey responses covered the whole spectrum of industries and size categories within the respective economy. However, a particular emphasis was on the manufacturing and service sectors: the proportions of firms in manufacturing industries in China, Finland and Spain were 69.5%, 42.4%, and 17.6%, respectively, whereas the proportions of firms in service industries were 16.8%, 25.4% and 35.1%.
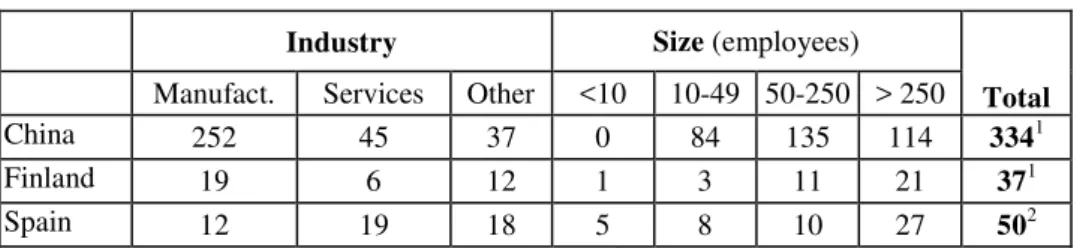
After filtering the firms which had received public R&D funding and/or participated in public-funded projects, the final firm sample with respect to the size and industry was as table 2.
Since the effect of public subsidies on the adoption of open innovation practices will likely be relatively small compared to that of firms’ own R&D expenditures, it is also important to take into account R&D intensity at the firm level. In the following analysis, we will measure this by the investments per revenue ratio, which the respondents were asked to report in the questionnaire. The resulting distributions of the firm-level R&D intensity are shown in Table 3.
Table 2. The firm sample
Industry Size (employees)
Total
Manufact. Services Other <10 10-49 50-250 > 250
China 252 45 37 0 84 135 114 3341
Finland 19 6 12 1 3 11 21 371
Spain 12 19 18 5 8 10 27 502
Table 3. R&D intensities of the respondent firms
0 - 1.5% 1.5% - 3% 3% - 5% 5% - 10% 10% -
China1 65
(19.5%)
118 (35.3%)
121 (36.2%)
29 (8.7%)
0 (0.0%)
Finland1 12 (32.4%)
9 (24.3%)
5 (13.5%)
5 (13.5%)
5 (13.5%)
Spain 23
(46.0%)
7 (14.0%)
3 (6.0%)
7 (14.0%)
10 (20.0%)
Source: author. 1 Level in one case unknown.
First, the responses show that R&D intensity is below 5% in about 90% of the Chinese firms. This is quite expected considering the relatively low level of R&D expenditures by the business enterprise sector in international comparison. On the other hand, the smallest share of firms with R&D intensity below 1.5% (as compared to Finland and Spain) clearly reflects the fact that the majority of the responding Chinese firms belong to the manufacturing sector. Second, it is useful to note that the responding Spanish firms are highly polarized in terms of R&D intensity. That is, the shares of firms with R&D intensity below 1.5% and above 10% are both highest in the case of Spain. The high share of firms with low R&D intensity can only partly be explained by the dominance of the service sector in the sample, since half of the firms with R&D intensity above 10% also belong to this sector.
2.3 Variables and estimation approach
3. RESULTS
3.1 Basic regressions with country dummies and control variables
The results of various regressions including only the country dummies and control variables are shown in Table 4. First, addressing hypothesis 1a, we notice that the coefficient of CHINA has a positive sign in both models 1 and 2 (as well as in model 3, where the binary dependent variable Q_BUY takes on the value of 1 if either of variables Q1 and Q2 has a value of 1, and 0 otherwise) and the estimate is also statistically significant. Since Chinese firms are expected to receive less (often) public subsidies for R&D on average than Finnish and Spanish firms, the results are in line with the hypothesis that a lower level of funding leads to more frequent technology acquisitions (as an impact of publicly funded projects). The coefficient of FINLAND, in turn, has a negative sign in these models indicating that Finnish firms acquire external technologies less often than Spanish firms, but the difference is not statistically significant.
Regarding the firm size, the estimate for SME is significant only in model 1. The negative sign indicates that small firms buy patents, licenses and other intellectual property as a result of public funding less often than large firms, which indirectly supports hypothesis 1b. That is, while the result does not provide direct evidence that the effect of public subsidies favoring internal over external R&D is larger in small firms, the fact that acquisition of intellectual property in general is less frequent in the surveyed small firms suggests that an increase in the level of public funding decreases the need for external knowledge and technologies especially in smaller firms. On the other hand, since the difference concerning the acquisition of technological solutions (Q2) is not significant (and the coefficient has a positive sign), the results are somewhat ambiguous. It is also worth noting that MANUFACTURING has a negative (statistically significant) coefficient in model 3, which means that firms in the manufacturing sector are less likely to use external R&D resources (there is no statistically significant difference between the sectors when acquisitions of intellectual property and technological solutions are examined separately, however). Since one can assume that firms belonging to other sectors, especially services, engage less often in internal technology development, the result is not surprising.
Furthermore, the results of model 1 show that the level of R&D intensity is positively related to the frequency of buying intellectual property, which could be interpreted as an effect resulting from a firm’s absorptive capacity (as mentioned in the second section). On the other hand, as suggested above, the level of absorptive capacity is expected to increase only gradually in a firm, so that we can assume that at a project level additional public funding still decreases the ratio of external versus internal R&D. Moreover, as can be seen from the results of model 2, higher R&D intensity does not seem to lead to (have a statistically significant effect on) increased buying of technological solutions in the context of publicly funded R&D projects. This hence further supports the interpretation that the data suggest a negative (project additionality) effect of public R&D funding on outside-in processes.
This, in turn, would support the latter (2b) of the two competing hypotheses presented in the second section (i.e., a low level of public R&D funding leads to increased selling of intellectual assets). On the other hand, interpretation of the results is difficult due to the fact that the level of R&D intensity is positively related (with a statistically significant estimate) to the frequency of selling both intellectual property and technological solutions. In other words, the results can also be seen to support hypothesis 2a, which states that higher level of public R&D funding, and hence higher total R&D expenditures, is the factor behind the more prevalent inside-out processes (one should note, however, that the ratio of public vs. internal funding is likely to be fairly small in firms with high R&D intensity). Therefore, cross-country evidence for hypothesis 2b can be considered as only suggestive.
More importantly, when taken into account the fact that the selling of intellectual assets probably takes place after considerable delay (with respect to the start of the project), one must also consider the possibility that the reported inside-out processes may not be primarily related to cost issues, but are a result e.g. from new contacts made during a joint R&D project. Since the time of selling was not specifically asked in the questionnaire, it is not the possible to distinguish between these causes in practice. An interesting result related to the frequency of inside-out processes is also that firms in the manufacturing sector are less likely to sell technological solutions (as a result of publicly funded projects) than their non-manufacturing counterparts (the coefficient of MANUFACTURING is negative in model 5). One possible reason for this is that manufacturing firms are better able to utilize the developed technologies in their products (and, more generally, in their business models).
Finally, models 7-9 were used to evaluate the impact of publicly funded projects on the firms’ propensity to engage in new collaborations with the project partners, as well as with other organizations. In the regressions, only the firms that had participated in publicly funded joint R&D projects were included (in contrast to the previous analyses, where also the firms that had received public R&D funding but not participated in joint research projects were included), leading to a total sample size of 136 firms (135 usable observations). One should also note that here a higher level of government R&D funding is assumed to manifest itself in an increased number of joint R&D projects. In other words, we expect that the firms in Finland and Spain have participated more often in publicly funded projects and therefore are more likely to report on resulting new collaborations. Indeed, the results of models 7 and 8 show that Chinese firms are less likely to form new alliances or make new collaboration agreements as a result of participating in publicly funded projects. The difference concerning the increased collaboration with universities and other research institutions (model 9) is not statistically significant, however. Moreover, there is no significant difference between Finland and Spain firm when it comes to the likelihood of engaging in new collaborations. Hence, in all the tested models (1-9), the differences in the Finnish and Spanish firms’ responses to the questions about the impacts of publicly funded projects on open innovation practices fall within the statistical margin of error. This is in line with our expectations, since the level of public R&D funding (as % of GDP) is almost the same in these two countries.
determinants of research cooperation and university-industry R&D (Becker & Dietz, 2004; Fontana et al., 2006; Laursen & Salter, 2004).
Table 4. The results from basic regressions
Model
1 2 3 4 5 6 7 8 9
Dep. / Expl.
variables Q1 Q2
Q_B
UY Q3 Q4
Q_SE
LL Q5 Q6 Q7
(Intercept) -2,930
*** (0,577) -1,311 *** (0,428) -0,888 ** (0,402) -5,573 *** (1,104) -3,547 *** (0,615) -3,552 *** (0,606) -0,766 (0,543) 0,219 (0,544) 0,564 (0,552)
CHINA 0,874
** (0,441) 1,730 *** (0,371) 1,553 *** (0,354) 2,019 ** (0,813) 0,909 ** (0,452) 1,063 ** (0,450) -0,970 * (0,537) -1,403 ** (0,551) 0,057 (0,539)
FINLAND -0,288
(0,644) -0,078 (0,523) -0,011 (0,479) 0,539 (1,067) 0,186 (0,630) 0,151 (0,627) -0,253 (0,548) -0,455 (0,548) 0,247 (0,589)
SME -0,865
*** (0,321) 0,143 (0,245) -0,038 (0,244) -0,672 (0,444) 0,284 (0,284) 0,219 (0,276) -0,903 (0,566) -0,940 (0,597) -1,007 ** (0,470) MANUFACTU
RING -0,375
(0,274) -0,385 (0,247) -0,551 ** (0,250) -0,456 (0,359) -0,851 *** (0,270) -0,754 *** (0,265) -0,114 (0,452) -0,763 (0,476) 0,070 (0,452) R&D INTENSITY 0,588 *** (0,122) 0,123 (0,100) 0,142 (0,098) 0,795 *** (0,189) 0,797 *** (0,129) 0,797 *** (0,126) 0,320 ** (0,155) 0,041 (0,156) 0,160 (0,157) N LR test 419 38,782 *** 419 42,829 *** 419 34,490 *** 419 31,862 *** 419 59,322 *** 419 60,580 *** 135 14,076 ** 135 19,439 *** 135 6,196
Source: author. Standard errors in parentheses. * Significant at 0.1 level, ** significant at 0.05 level, *** significant at 0.01 level; two-tailed tests.
3.2 The possible role of other factors in the country differences
question suggested four key barriers to offering (selling) technologies to other organizations, one of which was “Not Sold Here (Nobody else will benefit from our technology)”.
The survey responses show that there are indeed significant differences in the prevalence of “Not Invented Here” and “Not Sold Here” in the surveyed firms in the three countries. First, 15.3% of the respondents in China, 30 % in Spain and 40.5% in Finland indicated that “Not Invented Here” is an important barrier to the utilization of external technologies. This would hence support the explanation that Spanish and Finnish firms’ lower propensity to acquire technologies from external sources is at least partly due to the “Not Invented Here” attitude. In order to test the possible effect, we added a dummy explanatory variable NIH (taking the value of 1 if the respondent indicated that “Not Invented Here” is a barrier, and 0 otherwise) in models 1-3. Since the coefficient of NIH was positive in all of these (the estimate was statistically significant in models 2-3), the results (see Table 5) show that, in general, the firms in which “Not Invented Here” was seen as a barrier were in fact more likely to buy technologies as a result of publicly funded projects. Yet, the result does not tell about the national differences, so we did the same regressions for each country separately. The results of these regressions (which are not reported here in detail) indicate that there exists a positive relationship between the “Not Invented Here” attitude and the propensity to acquire technologies from external sources (i.e., the coefficient of NIH has a positive sign) in the case of China and Finland, and a negative relationship in the case of Spain, which further supports the idea that the “Not Invented Here” attitude may partly explain the observed country differences (at least between China and Spain). On the other hand, the addition of NIH to models 1-3 using data from all three countries had only a minor effect on the coefficients and statistical significance levels (p-values) of the country dummies, so the “Not Invented Here” effect is not likely to explain much of the country differences in our data set.
Table 5 The results from the additional regressions I
Model
10 (1) 11 (2) 12 (3) 13 (4) 14 (5) 15 (6)
Dep. / Expl.
variables Q1 Q2 Q_BUY Q3 Q4 Q_SELL
(Intercept) -2,933 ***
(0,587) -1,567 *** (0,448) -1,126 *** (0,420) 5,337 *** (1,098) -3,502 *** (0,610) -3,519 *** (0,602)
CHINA 0,876 **
(0,444) 1,853 *** (0,381) 1,668 *** (0,363) 1,885 ** (0,825) 0,852 * (0,459) 1,014 ** (0,458)
FINLAND -0,289
(0,646) -0,151 (0,530) -0,081 (0,487) 0,611 (1,093) 0,275 (0,638) 0,249 (0,637)
SME -0,864 ***
(0,321) 0,170 (0,247) -0,013 (0,247) -0,696 (0,459) 0,304 (0,290) 0,238 (0,282) MANUFACTU RING -0,374 (0,274) -0,366 (0,249) -0,535 ** (0,252) -0,395 (0,377) -0,820 *** (0,279) -0,727 *** (0,274) R&D INTENSITY 0,588 *** (0,122) 0,129 (0,101) 0,146 (0,099) 0,632 *** (0,194) 0,715 *** (0,132) 0,714 *** (0,128)
NIH 0,011
(0,322)
0,680 ** (0,286)
0,675 ** (0,285)
NSH 1,346 ***
(0,385) 1,175 *** (0,337) 1,288 *** (0,336) N
LR test 419
38,784 *** 419 48,743 *** 419 40,382 *** 419 43,265 *** 419 71,225 *** 419 75,338 ***
Source: author. Standard errors in parentheses. * Significant at 0.1 level, ** significant at 0.05 level, *** significant at 0.01 level; two-tailed tests.
The strength of intellectual property (IP) protection in a country is another important factor that may significantly affect firms’ willingness to innovate and share knowledge. The effect of IP protection on open innovation depends on the context, however. For example, while certain types of open innovation are only possible through formal appropriability of knowledge and technologies (e.g. patents enable out-licensing), strong IP protection can also hinder the sharing of knowledge and innovations (e.g. in open source software development; West, 2006). Indeed, the situation where firms are urged to open up their innovation processes and collaborate with external partners, but at the same time have to protect their knowledge in order to profit from their innovations, presents a paradox (Laursen & Salter, 2005). Moreover, it is important to note that the ease of imitation and, hence, firms’ willingness to innovate (conduct in-house R&D) depends not only on the strength of IP protection, but from technical issues (such as embeddedness of the innovation in processes) as well. The concept of “appropriability”, which is a function both of the ease of replication and the efficacy of IPR protection (Teece, 1986, 2000), is therefore often used to describe the innovator’s ability to protect an invention from expropriation.
that the prevalence of open innovation is related to the strength of appropriability regime. Moreover, there is some empirical evidence to support this argument: Laursen and Salter (2005), for example, find that firms in industries with high levels of technological opportunities and appropriability (including chemicals and electrical products) are more likely to engage in open innovation than firms in low technology industries with low levels of appropriability (such as textiles and fabricated metal products).
In the following, when analyzing the differences between China, Finland and Spain, we will consider only the strength of IP protection, however. This is because we are not comparing individual firms or industries (for which it is easier to determine appropriability conditions), but try to explain the observed differences at the country level. In order to estimate the relative strength of IP protection between the three countries, we use two indices from The Global Competitiveness Report 2007-2008 (see Table 6). The values of both “Property rights” and “Intellectual property protection” show that the level of IP protection is lowest in China and highest in Finland. One has to note, however, that in recent years China has been steadily developing infrastructures for IP protection. In particular, after joining to the WTO (in 2001) China has strengthened and amended its IPR laws and regulations in order to meet the requirements of the TRIPS (Trade-Related Aspects of Intellectual Property Rights) agreement (Sepetys & Cox, 2009). Due to the international harmonization of IP laws, it may therefore be difficult to distinguish the effect of varying IP protection from those of other factors facilitating or hindering open innovation.
Table 6. Indicators for the level of IP protection in China, Finland and Spain
Index China Finland Spain
Property rights 4.3 6.4 5.5
Intellectual property protection 3.4 6.3 4.9
Source: The Global Competitiveness Report 2007-2008, World Economic Forum, Geneva (World Economic Forum, 2008).
Nevertheless, the survey responses may again provide some clues, since one of the options for the question concerning the barriers to offering technologies to other organizations was “Complexity of IPR, fear of infringements”. Moreover, there was also a specific question in the questionnaire about the challenges that may emerge in public R&D collaborations relating to the protection of created knowledge and technologies. In this checkbox -type of question, one of the suggested challenges was “Protection is too expensive/time consuming”, which can also be interpreted as indicating the complexity of property rights issues. The complexity of intellectual property rights, however, is not necessarily related to the strength of intellectual property protection, but rather means that intellectual property rights are not clearly defined. Nevertheless, various difficulties related to the protection of intellectual property are expected to affect negatively the firms’ propensity to sell technologies and engage in public R&D collaborations.
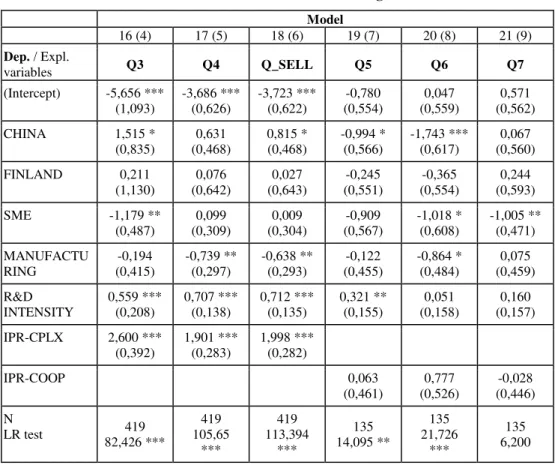
Spain are 21.6% and 18.0%), which has the weakest intellectual property protection, the results suggest that the perceived complexity of IPR may be associated with weaknesses of the IPR system. In order to test the effect of this barrier on the selling of intellectual property and technologies, we created a dummy variable IPR-CPLX (taking the value of 1 if the respondent had ticked the corresponding option in the questionnaire) and included it in models 4-6. The coefficient of this dummy was positive and statistically highly significant in all the models, which again means that the more often firms engage in open innovation processes, the more often they identify various barriers to them. Moreover, the coefficient of IPR-CPLX was positive in separate regressions for both China and Spain (though statistically significant only for the former), which means that the relationship between the dependent variables and IPR-CPLX is again opposite to what was expected and that the perceived difficulties related to the complexity of intellectual property rights probably are not a major factor behind the differences in the frequency of reported impacts of publicly funded projects.
Table 7. The results from the additional regressions II
Model
16 (4) 17 (5) 18 (6) 19 (7) 20 (8) 21 (9)
Dep. / Expl.
variables Q3 Q4 Q_SELL Q5 Q6 Q7
(Intercept) -5,656 ***
(1,093) -3,686 *** (0,626) -3,723 *** (0,622) -0,780 (0,554) 0,047 (0,559) 0,571 (0,562)
CHINA 1,515 *
(0,835) 0,631 (0,468) 0,815 * (0,468) -0,994 * (0,566) -1,743 *** (0,617) 0,067 (0,560)
FINLAND 0,211
(1,130) 0,076 (0,642) 0,027 (0,643) -0,245 (0,551) -0,365 (0,554) 0,244 (0,593)
SME -1,179 **
(0,487) 0,099 (0,309) 0,009 (0,304) -0,909 (0,567) -1,018 * (0,608) -1,005 ** (0,471) MANUFACTU RING -0,194 (0,415) -0,739 ** (0,297) -0,638 ** (0,293) -0,122 (0,455) -0,864 * (0,484) 0,075 (0,459) R&D INTENSITY 0,559 *** (0,208) 0,707 *** (0,138) 0,712 *** (0,135) 0,321 ** (0,155) 0,051 (0,158) 0,160 (0,157)
IPR-CPLX 2,600 ***
(0,392)
1,901 *** (0,283)
1,998 *** (0,282)
IPR-COOP 0,063
(0,461) 0,777 (0,526) -0,028 (0,446) N
LR test 419
82,426 *** 419 105,65 *** 419 113,394 *** 135 14,095 ** 135 21,726 *** 135 6,200
Source: author. Standard errors in parentheses. * Significant at 0.1 level, ** significant at 0.05 level, *** significant at 0.01 level; two-tailed tests.
4. DISCUSSION
selling the resulting innovations. Since this was not measured in the survey, it is difficult to evaluate and compare the possible causes of inside-out processes that may result from public R&D funding or participation in publicly funded projects.
Generalization of the results is also somewhat hindered by the facts that the sample of surveyed firms was relatively small in Finland and Spain, as well as biased toward large firms, and toward manufacturing firms in China. More importantly, we were able to include only three countries in the analysis. The findings should therefore be replicated with a larger data set in the future.
SUMMARY AND CONCLUSIONS
In this paper, we have examined various additionality effects of public R&D funding on open innovation practices. Previous research has shown that public subsidies may have both input and output additionality effects on R&D (i.e., increases in R&D expenditures and performance, respectively), so it is interesting to study how additional funding may affect the acquisition of intellectual property and technologies from external sources as well as the selling of these to other organizations. We first hypothesized that additional funding may favor internal over external R&D (at the project level), which would mean that external R&D is in fact motivated by the low level of public R&D expenditures. With regard to inside-out open innovation (selling of technologies), we created two competing hypotheses, one based on the output additionality effect (i.e., additional funding leads to increased selling of technologies) and the other on the compensation of R&D costs (i.e., selling of technologies is motivated by the lack of funding). Furthermore, in line with earlier findings, we suggested that participation in publicly funded projects increases the likelihood that a firm will engage in new collaborations with the project partners, as well as with other organizations.
alliances or make new collaboration agreements after these projects. Since our assumption is that an increased number of projects (as a manifestation of a higher level of public R&D funding) results in new collaborations more frequently, hypothesis 3 is also supported by the results.
The inclusion of additional explanatory variables in the models did not result in significant changes in the coefficients and statistical significance levels of the country dummies. Moreover, the signs of the coefficients of these additional variables were in many cases opposite to what was expected, which further suggests that “Not Invented Here”, “Not Sold Here”, and IP protection issues are inadequate (as explanatory factors) to explain the observed cross-country differences. On the other hand, there are several other firm-specific operational and strategic factors which affect the decision whether to use open innovation practices or not, but were not tested in the study. These include, for example, a firm’s ability to utilize external innovations, the availability of needed complementary assets, and unwanted knowledge spillovers related to cooperation and selling of technologies. It is therefore difficult to evaluate the sole impact of public subsidies and other support schemes on open innovation practices. Indeed, we must emphasize that due to the various limitations of the analysis (the use of country level data on public R&D funding, in particular) and interpretational difficulties associated with the results, our findings can be considered as suggestive only. Yet, we believe that these preliminary results are of interest not only to researchers, but to managers and policy-makers as well, and that the effects of public R&D funding on open innovation warrant further research.
REFERENCES
Aerts, K., & Schmidt, T. (2008). Two for the price of one? Additionality effects of R&D subsidies: A comparison between Flanders and Germany. Research Policy, 37(5), 806-822.
Ali-Yrkkö, J. (2004). Impact of public R&D financing on private R&D - Does financial constraint matter? The Research Institute of the Finnish Economy, Discussion Papers No. 943. Helsinki, Finland: ETLA.
Arora, A., Fosfuri, A., & Gambardella, A. (2004). Markets for Technology: The Economics of Innovation and Corporate Strategy. Cambridge, MA: MIT Press. Aschhoff, B., Fier, A., & Fier, H. (2006). Behavioural additionality of public R&D
funding in Germany. In Government R&D Funding and Company Behaviour: Measuring Behavioural Additionality (pp. 127-149). Paris: OECD Publishing. Bach, L., & Matt, M. (2005). From economic foundations to S&T policy tools: a
comparative analysis of the dominant paradigms. In Llerena, P., Matt, M., & Avadikyan A. (Eds.), Innovation policy in a knowledge-based economy: theory and practice (pp. 17-46). Berlin: Springer Verlag.
Becker, W., & Dietz, J. (2004). R&D cooperation and innovation activities of firms— evidence for the German manufacturing industry. Research Policy, 33(2), 209-223. Branstetter, L., & Sakakibara, M. (1998). Japanese research consortia: A
microeconometric analysis of industrial policy. Journal of Industrial Economics,
46(2), 207-233.
Cerulli, G. (2010). Modelling and Measuring the Effect of Public Subsidies on Business R&D: A Critical Review of the Econometric Literature. Economic Record, 86(274), 421-449.
Chesbrough, H. (2003). Open Innovation: The New Imperative for Creating and Profiting from Technology. Boston, MA: Harvard Business School Press.
Chesbrough, H. (2006). Open Business Models: How to Thrive in the New Innovation Landscape. Boston, MA: Harvard Business School Press.
Clarysse, B. (2006). (Ed.) Study and evaluation of the behavioural additionality of R&D-subsidies, Final report on behalf of IWT. IDEA Consult. Retrieved from http://www.proinno-europe.eu/sites/default/files/BE16_T1_Appraisal_Report.pdf Clarysse, B., Wright, M., & Mustar, P. (2009). Behavioural additionality of R&D
subsidies: A learning perspective. Research Policy, 38(10), 1517-1533.
Cohen, W.M., & Levinthal, D.A. (1990). Absorptive capacity: A new perspective on learning and innovation. Administrative Science Quarterly, 35(1), 128-152.
Czarnitzki, D., & Fier, A. (2002). Substitutive or complementary? Innovation subsidies in the German service sector. Applied Economics Quarterly, 48(1), 1-25.
Czarnitzki, D., & Fier, A. (2003). Publicly funded R&D collaborations and patent outcome in Germany. ZEW - Centre for European Economic Research Discussion Paper No. 03-24. Retrieved from http://ftp.zew.de/pub/zew-docs/evaluationR %26D/Czarnitzki%26Fier.pdf
Czarnitzki, D., Ebersberger, B., & Fier, A. (2004). The relationship between R&D collaboration, subsidies and patenting activity: empirical evidence from Finland and Germany. ZEW - Centre for European Economic Research Discussion Paper No. 04-37. Retrieved from ftp://ftp.zew.de/pub/zew-docs/dp/dp0437.pdf
Czarnitzki, D., & Hussinger, K. (2004). The link between R&D subsidies, R&D spending and technological performance. ZEW - Centre for European Economic Research Discussion Paper No. 04-56. Retrieved from ftp://ftp.zew.de/pub/zew-docs/dp/dp0456.pdf
Davenport, S., Grimes, C., & Davies, J. (1998). Research collaboration and behavioural additionality: a New Zealand case study. Technology Analysis & Strategic Management, 10(1), 55-67.
David, P.A., Hall, B.H., & Toole, A.A. (2000). Is public R&D a complement or substitute for private R&D? A review of the econometric evidence. Research Policy, 29(4), 497-529.
De Jong, J.P.J., Vanhaverbeke, W., Kalvet, T., & Chesbrough, H. (2008). Policies for Open Innovation: Theory, Framework and Cases. Helsinki, Finland: VISION Era-Net.
Ebersberger, B. (2005). The Impact of Public R&D Funding, VTT Publications 588. Espoo, Finland: VTT.
Eurostat. (2009). Science, technology and innovation in Europe. Eurostat Pocketbooks, 2009 edition.
Falk, R. (2004). Behavioural additionality effects of R&D subsidies: Empirical evidence from Austria, TIP Working Paper. Austrian Insitute of Economic Research. Retrieved from http://www.tip.ac.at/publications/st_2004_additionality_effects$.pdf Falk, R. (2007). Measuring the effects of public support schemes on firms’ innovation
activities: Survey evidence from Austria. Research Policy, 36(5), 665-679.
Ferretti, M., & Romano, C. (2006). Technological acquisition processes in product development of large companies. International Journal of Product Development,
Fontana, R., Geuna, A., & Matt, M. (2006). Factors affecting university-industry R&D projects: The importance of searching, screening and signaling. Research Policy,
35(2), 309-323.
Gassmann, O., & Enkel, E. (2004). Towards a theory of open innovation: Three core process archetypes. Proceedings of the R&D Management Conference (RADMA). Lisbon, Portugal. Retrieved from http://www.alexandria.unisg.ch/export/ DL/20417.pdf
Georghiou, L. (2002). Impact and additionality of innovation policy. In P. Boekholt (Ed.),
Innovation Policy and Sustainable Development: Can Innovation Incentives Make a Difference? IWT-STUDIES 40 (pp. 57-65). Brussels: IWT-Observatory. Retrieved from http://www.6cp.net/downloads/02brussels_review.pdf
González, X., Jaumandreu, J., & Pazó, C. (2005). Barriers to innovation and subsidy effectiveness. RAND Journal of Economics, 36(4), 930-950.
González, X., & Pazó, C. (2008). Do public subsidies stimulate private R&D spending?
Research Policy, 37(3), 371-389.
Granstrand, O., Bohlin, E., Oskarsson, C., & Sjöberg, N. (1992). External technology acquisition in large multi-technology corporations. R&D Management, 22(2), 111-133.
Hyvärinen, J. (2006). Behavioural additionality of public R&D funding in Finland. In
Government R&D Funding and Company Behaviour: Measuring Behavioural Additionality (pp. 115-125). Paris: OECD Publishing.
Klette, T.J., Møen, J., & Griliches, Z. (2000). Do subsidies to commercial R&D reduce market failure? Microeconometric evaluation studies. Research Policy, 29(4), 471-495.
Laursen, K., & Salter, A. (2004). Searching high and low: what types of firms use universities as a source of innovation? Research Policy, 33(8), 1201-1215.
Laursen, K., & Salter, A. (2005). The Paradox of Openness – Appropriability and the Use of External Sources of Knowledge for Innovation. Paper presented at the Academy of Management Conference. Honolulu, Hawaii, USA. Retrieved from http://www.openinnovation.net/Conference/AOM2005/LaursenSalter.pdf
Lichtenthaler, U. (2004). Organising the external technology exploitation process: current practices and future challenges. International Journal of Technology Management,
27(2/3), 255-271.
Lööf, H., & Heshmati, A. (2005). The impact of public funding on private R&D investment: New evidence from a firm level innovation study. CESIS - Centre of Excellence for Science and Innovation Studies, Working Papers No. 06. Retrieved from http://www.infra.kth.se/cesis/documents/WP06.pdf
Malik, K. Georghiou, L., & Cameron, H. (2006). Behavioural additionality of the UK SMART and LINK schemes. In Government R&D Funding and Company Behaviour: Measuring Behavioural Additionality (pp. 205-218). Paris: OECD Publishing.
Rivette, K.G., & Kline, D. (2000). Rembrandts in the Attic: Unlocking the Hidden Value of Patents. Boston, MA: Harvard Business School.
Sepetys, K., & Cox, A. (2009). Intellectual Property Rights Protection in China: Trends in Litigation and Economic Damages. NERA Economic Consulting. Retrieved from http://www.nera.com/extImage/PUB_IPR_Protection_China_0109_final.pdf Shipp, S., Wisniewski, L., Wang, A., Campbell, S., Levin, K., & O’Brien, J. (2006).
Government R&D Funding and Company Behaviour: Measuring Behavioural Additionality (pp. 219-233). Paris: OECD Publishing.
Teece, D. (1986). Profiting from technological innovation: implications for integration, collaboration, licensing and public policy. Research Policy, 15(6), 285-305.
Teece, D. (2000). Managing Intellectual Capital. Oxford: Oxford University Press. Tschirky, H., Koruna, S.M., & Lichtenthaler, E. (2004). Technology marketing: a firm’s
core competence?. International Journal of Technology Management, 27(2/3), 115-122.
Veugelers, R., & Cassiman, B. (1999). Make and buy in innovation strategies: evidence from Belgian manufacturing firms. Research Policy, 28(1), 63-80.
Wallsten, S.J. (2000). The effects of government-industry R&D programs on private R&D: the case of the Small Business Innovation Research program. RAND Journal of Economics, 31(1), 82-100.
West, J. (2006). Does appropriability enable or retard open innovation? In Chesbrough, H.W., Vanhaverbeke W., & West J. (Eds.), Open Innovation: Researching a New Paradigm (pp. 109-133). Oxford: Oxford University Press.