Received: 27 May 2005 – Revised: 18 October 2005 – Accepted: 20 October 2005 – Published: 23 December 2005
Abstract. The paper documents resonant coupling between an air pressure travelling disturbance and the Middle Adriatic coastal waters, examined theoretically by using a barotropic numerical model and then comparing the model to the ob-served events. The model is forced first with a cosine and box air pressure disturbance travelling with a constant speed and direction but varying its eulerian period/duration, whereas the sensitivity to the disturbance speed is examined by vary-ing it, keepvary-ing all the other parameters constant. Larger resonant transfer of energy is documented for shorter dis-turbances and for the box versus cosine variation, espe-cially in the high-frequency domain. Bands of enlarged sea level amplification are found in front of Stari Grad Bay (6.7 and 11.0 min) close to its natural modes (6.1 and 10.6 min), which may be a reason for the very large amplification and sporadic severe floods observed at the inner bay area. The lack of coincidence in the Stari Grad and Vela Luka ob-served floods may be partially a result of different distur-bance speeds and energy transfer rates due to various depths off the bays, yet some additional factors (basin shape, real disturbance energy, disturbance direction) should be exam-ined in the future.
Keywords. Oceanography: General (Numerical modeling) – Oceanography: Physical (Air-sea interactions; Tsunamis and storm surges)
1 Introduction
An exceptional flood event, which occurred in June 2003 in the middle Adriatic coastal waters (Vilibi´c et al., 2004), generated by energetic atmospheric gravity waves travel-ling eastwards, enhanced the investigations of such very rare but vigorous events in the Adriatic Sea in which a reso-nant atmosphere-ocean energy transfer takes place at certain areas. High-frequency sea level oscillations reached 1.2 m Correspondence to:I. Vilibi´c
at the top of the Stari Grad Harbour, whereas severe cur-rents (>100 cm/s) swept out shell farms when resonantly-generated waves reached the semi-enclosed Mali Ston Bay situated at the top of the basin. The last strong event occurred in June 1978 at Vela Luka, where 3-m high waves flooded a great part of the city (Hodˇzi´c, 1980; Orli´c, 1980), but no flood events have been recorded in between, decreasing the interest for the scientific investigations of the events.
The phenomenon of resonant coupling between travel-ling gravity waves and the ocean is documented worldwide (Donn, 1959; Hibiya and Kajiura, 1982; Rabinovich, 1993; Dragani et al., 2002; Mercer et al., 2002). Due to its simi-larity to the tsunami waves (barotropic waves propagating in the whole water column), some authors call it meteotsunami (Defant, 1961; Rabinovich and Monserrat, 1998). Atmo-spheric gravity waves, which are manifested through high-frequency oscillations in air pressure, induce ocean waves which are dynamically multiplied at the depths where the speed of the air pressure disturbance is equal to the speed of long waves in the sea. This process is known as Proud-man resonance, named after the classical paper by ProudProud-man (1929). However, another effect is crucial to obtain excep-tionally large oscillations at the top of the closed basins, that is the so-called harbour resonance, which represents basin natural oscillations – seiches – induced by incoming open-sea waves. Both effects have been well documented and in-vestigated in some parts of the Mediterranean Sea, such as the Balearic Islands (Tintore et al., 1988; Monserrat et al., 1991, 1998; Gomis et al., 1993; Garcies et al., 1996; Rabi-novich et al., 1999) and Sicily (Candela et al., 1999). Fur-thermore, an additional sea level set-up may occur as a result of topographic constraints of a basin (Vilibi´c et al., 2004), edge waves around an island (Liu et al., 2002) or coupling between two adjacent inlets (Liu et al., 2003).
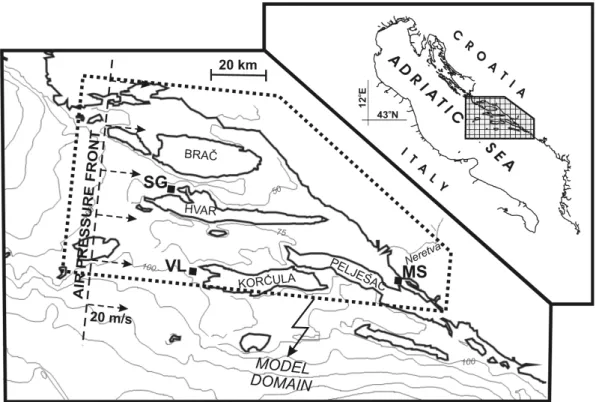
Fig. 1.Position and bathymetry of the eastern part of the middle Adriatic Sea. The domain of the numerical model is dashed, with grid points (rectangles) marked in front of Stari Grad (SG), Vela Luka (VL) and Mali Ston (MS) Bays. Speed and direction of the travelling air-pressure disturbance are shown, too.
measurements have been carried out in the most affected ar-eas (Vilibi´c et al., 2004). However, the model has been in agreement with eyewitness reports, and therefore the nature of the event has been proven. A year later, in August 2004, another episode of strong sea level oscillations has been recorded in the area, but fortunately without flooding. As the travelling air pressure disturbance has a shape of the box function, different from the June 2003 event when a cosine-like disturbance occurred, and the August 2004 event was coupled with relatively strong alongshore winds, two ques-tions arose: (i) why does the flooding only occur during some events, and (ii) which is the more generative force, wind or travelling air pressure disturbance? Vilibi´c et al. (2005) com-pared two events and demonstrated that the reason for the dif-ferent energy versus frequency distribution is the difference in the energetics of the air pressure travelling disturbance – box versus cosine disturbance. In addition, wind stress ex-plained about 30% of the oscillations during the August 2004 event, whereas the rest had been assigned to the air pressure influence.
As the harbour resonance is excited by the open sea waves, which are predominantly generated by the Proudman reso-nance, the next step is to explore atmosphere-ocean energy transfer for documented travelling disturbances, but varying its parameters (period, duration, speed), in order to capture a variety of possible generation scenarios. Therefore, this pa-per will document the sensitivity of sea level oscillations in front of the most affected areas (Stari Grad, Vela Luka, Mali
Ston) generated by artificial travelling disturbances. The methodology will comprise barotropic numerical modelling of the area by 2DD model (Black, 1995), already used in two previous studies (Vilibi´c et al., 2004, 2005). The model and forcing will be described in Sect. 2; Sect. 3 will docu-ment various model runs and sea level characteristics off hot spots, being summarised and concluded in Sect. 4.
2 Material and methods
The eastern Middle Adriatic Sea is a complex bay system open to the west with a number of along-bay islands and channels (Fig. 1). The depth decreases from 100 m at the en-trance to about 15 m in the inner part off Mali Ston Bay, with the ability to resonantly capture atmospheric gravity waves through a Proudman resonance travelling at a speed of 12 to 30 m/s. However, the most energetic events have been recorded with a speed of about 20 m/s (22 m/s in June 2003, Vilibi´c et al., 2004, and 18 m/s in August 2004, Vilibi´c et al., 2005). Cross-section areas are reduced by a decrease in both width and depth; therefore, it should be expected that any wave or disturbance propagating in the sea from the west to the east will be amplified at the bay head (Mali Ston Bay) due to a topographical effect.
∂t+∂x[(d+ζ )u]+∂y[(d+ζ )v]=0, (3) where t is time, u andv are vertically averaged velocities in thex andy directions, g is acceleration due to gravity (9.81 m/s2),ζ stands for sea level above a horizontal datum, d marks the water depth below the datum,f is the Corio-lis parameter, ρ(1028 kg/m3)and ρa are the water and air density, respectively,P denotes air pressure andAH is the horizontal eddy viscosity coefficient. Seabed frictional resis-tanceCis given by
C=18 log10(0.37h/z0) , (4)
wherehis total water depth andz0is the roughness length (a
level above the bed where velocity equals zero).
The model domain is originally developed for investi-gations of the tsunami event which occurred in the region (Herak et al., 2001), and used in the previous case studies by Vilibi´c et al. (2004, 2005) – see Fig. 1. Grid resolution is chosen to be 1 km, altogether 139×68 grid cells. The sim-ulations were carried out with time steps of 12 s, in order to satisfy the stability criterion for the grid sizes and depths considered. Horizontal eddy viscosity coefficientAH is set to 75 m2/s, bottom roughnessz0to 0.003 m, while a radiation
condition was imposed at the open boundaries, together with additional smoothing and minimizing the reflection by ap-plying sponge boundaries (Black, 1995). These numbers are taken from the referred case studies, where the model results were successfully calibrated on real sea level measurements. The model is forced by an artificial travelling disturbance which propagates eastward along the domain with a speed ofVC=20 m/s, as these values meet the observed ones dur-ing the flood events (Fig. 2). Therefore, these parameters will be set to constant values, whereas types and parameters of travelling disturbances will be varied. Two main types of the travelling air pressure disturbance will be considered: (i) cosine-like and (ii) box-like disturbances (Fig. 3), which were observed in the area. The air pressure field is set to a constant value before and after the passage of the distur-bance. A number of model runs for each disturbance has been performed, changing the Eulerian periodTC(for cosine ones) or durationTB (for box ones) from 0.5 to 4 h (Eule-rian period is defined from the pressure series measured at a
Fig. 2. Measured air pressure series on 27 June 2003 and 21–22 August 2004 (upper panel), and times of air pressure disturbance arrival as captured by the measurements (bottom panel, after Vilibi´c et al., 2004, 2005).
Fig. 4.Power spectra of eulerian air pressure series versus cosine disturbance periodTC(AC=3 hPa,VC=20 m/s).
Fig. 5.Power spectra (upper) and gain spectra (lower) of sea level series modelled at the SG, VL and MS grid points versus cosine disturbance periodTC(AC=3 hPa,VC=20 m/s). Natural periods of Stari Grad and Mali Ston Bays are indicated by dashed lines (after Vilibi´c et al., 2004).
single point). BothTC andTB may be used for the compu-tation of disturbance wavelength, which in our case ranges from 36 km (period of 0.5 h) to 432 km (period of 4 h). In ad-dition, the linearity of the response regarding the intensity of a disturbance will be checked by settingTCto constant and varying AC, whereas the sensitivity of various bays to the disturbance speed will be tested by settingTC to a constant value and varying the disturbance speedVC, as different to-pographic characteristics (various depths) are in front of the investigated bays, presumably resulting in different amplifi-cation rates generated by the Proudman resonance.
3 The results
3.1 Cosine disturbance
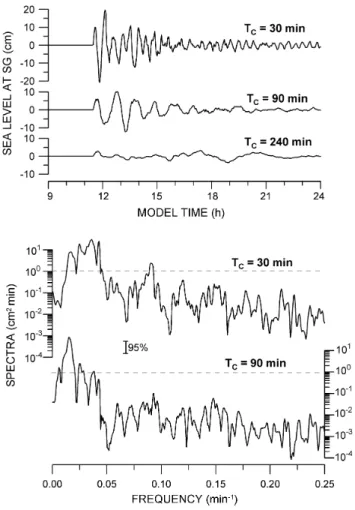
Fig. 6.Modelled sea level series (upper) and corresponding spectra (lower) at the SG grid point forTC equal to 30, 90 and 240 min (AC=3 hPa,VC=20 m/s).
disturbance periodTC (Fig. 4), in contrast to the energy at higher frequencies, which is larger for the shorterTC.
Such spectral characteristics of the forcing mechanism re-sult in similar spectral characteristics of the ocean waves when no topographic constraints are considered. However, the Middle Adriatic coastal waters possess very complex to-pography, and a number of natural oscillations are excited by a broad-band forcing mechanism. At the SG grid point (Fig. 5) in front of Stari Grad Bay, the maximum of energy is positioned around the main disturbance period, but the en-ergy transfer is more efficient for shorterTC, with a gain of about 15 cm/hPa (TC=0.5 h, f=1/TC). The gain is con-sidered here as a ratio between sea level and air pressure in each frequency band, having its static (inverse barometric) value of –1 cm/hPa (only absolute values will be considered in the following). The gain decreases to about 2.5 cm/hPa for TC=1.5 h andf=1/TC, and to about 1.1 cm/hPa forTC=4.0 h and f = 1/TC, having a tendency towards the inverse barometric sea response to the atmospheric disturbance. A significantly lower energy transfer rate may be found for shorter TC in front of Vela Luka (3 cm/hPa for TC=0.5 h andf=1/TC) and a bit higher at Mali Ston (7 cm/hPa for TC=0.5 h and f=1/TC). Oppositely, a larger gain value
Fig. 7.As in Fig. 5, but at the MS grid point.
may be found for longer TC at MS (about 3.5 cm/hPa for TC=4.0 h, f=1/TC), which is the result of more efficient en-ergy transfer due to the natural period of the whole area, which is around 4 h (Vilibi´c et al., 2005).
Although sea level oscillations at 0.5 h or a larger period may be significant in the basin, even comparable with the tides due to free oscillations of the whole basin (Vilibi´c et al., 2005), harbour resonance in smaller bays occurs at shorter periods. Vilibi´c et al. (2004) estimated the most significant natural oscillations at the Stari Grad (10.6, 8.3, 6.1 min) and Mali Ston Bays (17.7, 8.8, 8.0, 5.1 min). However, all of Stari Grad Bay is exposed to the incoming waves, whereas this is not the case for Mali Ston Bay, which has two narrow constrictions reflecting a great part of the incoming waves. The result is almost no amplification of the sea level inside Mali Ston Bay, but the currents are really vigorous at the constrictions.
Fig. 8. Cumulative gain versus cosine disturbance amplitudeAC (upper panel), and spectra of sea level series modelled at SG for the same range ofAC (bottom panel). TC is set to 80 min andVC to 20 m/s. Cumulative gain is defined as the square root of the cumu-lative sea level over cumucumu-lative air pressure energy.
6.1 min is the natural period of the inner basin (Stari Grad Harbour, Vilibi´c et al., 2004), which was the most affected area during the June 2003 flood. Therefore, the flooding of the Stari Grad city is presumably excited by the incoming waves at the near-natural bay/harbour frequency, which are generated topographically in front of Stari Grad Bay by the harbour resonance effect and then propagated into the bay and Stari Grad Harbour. The amplification rate at the SG point and on 1/f=6.7 min is modelled to be between 30 and 50 cm/hPa for allTC, being more energetic for the shorterTC due to higher energy of the forcing disturbance. A similar ef-fect takes place for the 10.6-min seiche, which is obviously a result of the 11-min resonant oscillation generated in the region off Stari Grad Bay.
The energy at the VL grid point is a few times smaller than at the SG point, presumably due to higher depths in front of the bay (about 100 m; this hypothesis will be tested in Sect. 3.4), which falls far from the Proudman
reso-nance equilibrium depth (40 m for the disturbance speed of 20 m/s). Therefore, the energy at all frequency bands com-pared to SG is lower (Fig. 5), and the gain doesn’t surpass 30 cm/hPa. Yet, the gain at VL is the largest at high frequen-cies (>0.20 cpmin), yielding to the conclusion that short-lasting atmospheric disturbances (a period of a few minutes) are presumably more favourable for the generation of har-bour resonance in Vela Luka Bay.
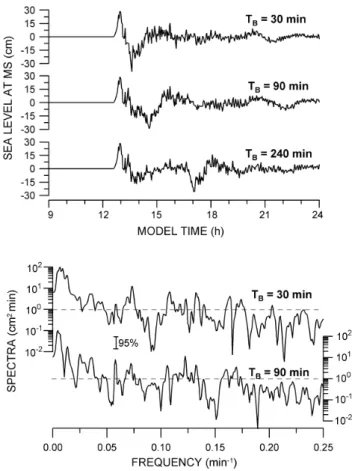
A bit of a different situation is in front of Mali Ston Bay (MS grid point, Figs. 5 and 7), where the largest energies are modelled at low frequencies, but for a longer disturbance pe-riodTC. As said, it is presumably due to the energy transfer towards the fundamental mode of the whole coastal area (pe-riod of 4 h), which was also discussed by Vilibi´c et al. (2005) in light of the different disturbance shapes and energy dis-tributions. Large energy is also modelled for shortTC, and the gain may surpass 100 cm/hPa for some frequencies (e.g. at 0.12–0.13 cpmin and 0.20 cpmin). Such oscillations may result primarily in vigorous currents in two major constraints inside Mali Ston Bay, as a part of the incoming waves are re-flected from the narrow bay mouth (Vilibi´c et al., 2004) and a part of it is canalised through the constraints. An event in June 2003 resulted in currents exceeding 100 cm/s, but severe events are also reported occasionally by the local authorities and people (Hydrographic Institute, 2003).
Finally, the linearity of the model response to the different intensity of the disturbance has been tested by the chang-ing cosine amplitudeAC from –5 to 5 hPa, and by keeping the periodTCat 80 min (real value taken from the measure-ments). One may see that a larger gain is reached for the lowerAC (Fig. 8), but only up to 15%, which is not a large variability regarding large changes in air pressure amplitude (order of magnitude). It seems that such small changes in gain are predominantly driven by bottom friction which in-creases withAC, while the sea level response may be consid-ered as near-linear and near-symmetric in the SG area regard-ing the disturbance intensity. The same conclusions may be reached for the MS and VL grid points, and also for box-like disturbances (see the next section).
3.2 Box disturbance
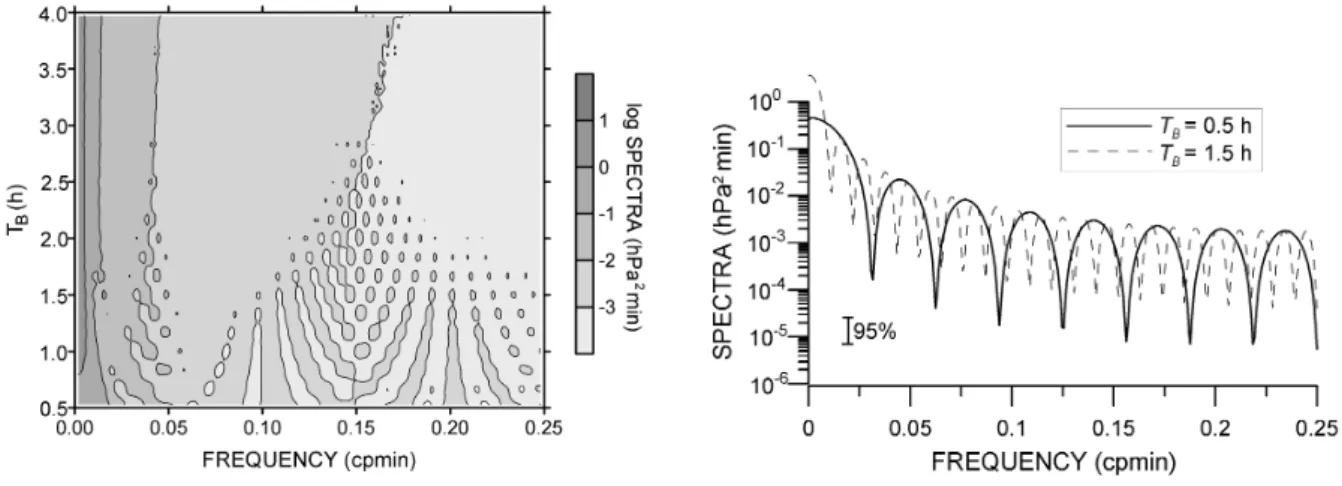
Spectral characteristics of a box disturbance show some sim-ilarities but also differences to the cosine variation (Fig. 9). The maximum of the energy is reached at very low frequen-cies, not at the disturbance period/duration of the cosine dis-turbance. However, a cycloidal decrease in energy is kept when going towards higher frequencies (cycloid shape is again due to a finite length of the analyzed series), but with a significantly lower rate, as the energy is larger there than for the cosine disturbance, especially for the longer disturbance duration (TB)versus the same cosine period (TC).
Fig. 9.Power spectra of eulerian air pressure series versus box disturbance durationTB(AB=3 hPa,VB=20 m/s).
Fig. 10.Power spectra (upper) and gain spectra (lower) of sea level series modelled at the SG, VL and MS grid points versus box disturbance durationTB(AB=3 hPa,VB=20 m/s). Natural periods of Stari Grad and Mali Ston Bays are indicated by dashed lines (after Vilibi´c et al., 2004).
harbour resonance that is appearing in the area. A larger gain is modelled for the MS grid point, especially at the two fre-quency bands of 0.12 and 0.16–0.17 cpmin, which are pre-sumably responsible for the energy transfer towards some natural modes of Mali Ston Bay. The energy is varying a little by changingTBin the whole basin, as the energy con-tent of the box disturbance is predominantly defined by the rate/amplitude of the air pressure step rather than the distur-bance duration – a drop in air pressure back to normal values is just another step function acting in contrast to the first one.
Fig. 11.Modelled sea level series (upper) and corresponding spec-tra (lower) at the SG grid point forTBequal to 30, 90 and 240 min (AB=3 hPa,VB=20 m/s).
3.3 Variable disturbance speed
All of the three examined bays (Stari Grad, Vela Luka and Mali Ston) are situated in different topographic encir-clements with various depths in front of them. Therefore, a different response is expected to occur on the travelling at-mospheric disturbance, at least for the short-lasting ones, i.e. for lowTC andTB values, whose wavelengths are compa-rable to the resonance generation area. A cosine travelling disturbance withTC=30 min is therefore used to test such a hypothesis (again propagating eastward along the model do-main), while the disturbance speedVC is varied from 10 to 40 m/s (resonance depths from 10 to 160 m).
The frequency-domain response at the SG, VL and MS grid points is given in Fig. 12. One can see that the largest energies at SG occur from 20 to 25 m/s for the periods higher than 20 min (0.05 cpmin). However, energy maximum is shifting towards larger VC when increasing the frequency, with a maximum around 27 m/s at 0.09 cpmin (11 min) and around 25 m/s at 0.15 cpmin (6.7 min). Therefore, a single cosine disturbance results in a variety of resonance depths, being shallower for its low-frequency part at SG and vice versa.
A different distribution is modelled for the VL point; there are two maxima atVCof 26 and 30 m/s for frequencies lower
Fig. 12. Power spectra of sea level series at SG, VL and MS grid points versus disturbance speedVC(TC=30 min,AC=3 hPa).
than 0.2 cpmin. The maxima are also located forVCbetween 25 and 30 m/s at higher frequencies, but again, with two or more maxima at a single frequency band. This may be a result of the variable depth in front of Vela Luka Bay, as the bottom has a slope perpendicular to the disturbance direction, what is not the case off Stari Grad Bay.
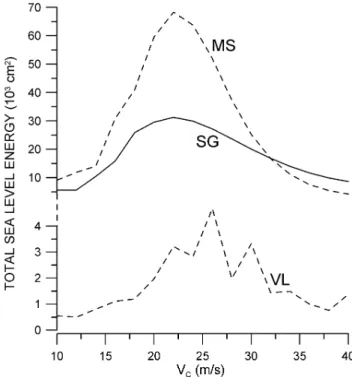
(∼100 m) which are close to the western edge of the model domain. Once generated there, it is enlarged due to shallow-ing towards the Stari Grad Bay. Maximum energy content is placed at 22 m/s, at both the SG and MS grid points, denot-ing such speed as the most efficient for the energy transfer in that area. Nevertheless, it seems that this is not the case at the VL point, where energy maximum is positioned atVCof 26 m/s, although a few times lower than at the MS and SG points. In addition, secondary maxima are visible at 24 and 30 m/s, presumably due to the transversal bottom slope ef-fects, as stated when discussing the energy content modelled in the frequency-domain (Fig. 12). It is interesting to notice that the response of the two affected areas relatively close to each other (Stari Grad and Vela Luka Bays) is dependent on the disturbance speed, which may be one of the factors that causes the flood only in one bay and not in the other (Vela Luka but not Stari Grad is flooded in June 1978, and oppo-sitely in June 2003). However, additional effects may take place, such as the disturbance propagating direction, as well as the channelling effects inside the bays.
4 Summary and conclusions
This study was triggered by the flood of Stari Grad in June 2003, which put into focus rare but vigorous events that occured in the Middle Adriatic coastal waters. Vilibi´c et al. (2004) related the phenomenon to the double resonance (Proudman and harbour) plus a topographical effect, being excited by a cosine-like travelling disturbance propagating eastward over the area. Vilibi´c et al. (2005) documented a similar event in August 2004 which resulted in no flooding. The latter was excited by a box travelling disturbance cou-pled with moderate to severe winds, which resulted in a dif-ferent frequency distribution of the sea level energy. The in-fluence of the wind was also acknowledged, although being a secondary effect. Both events were excited by a distur-bance having a similar major period/duration of about 80– 90 min, which defined one of the problems that we attempted to solve in this work: how do the changes in the disturbance period affect the sea response? Such a problem is examined by barotropic numerical modelling, forced with an air
pres-Fig. 13. Total energy content of sea level series at the SG, VL and MS grid points versus disturbance speed VC (TC=30 min, AC=3 hPa).
sure travelling disturbance only, and by examining a sea level series and spectra in front of three most affected areas.
Another issue examined here is the impact of the differ-ent shapes of travelling disturbances to the sea, while a third question arose from the different responses at Vela Luka and Stari Grad Bays documented from the past events. In other words, What is the sensitivity of the region to the various dis-turbance speeds? The following conclusions may be drawn from the results:
– Sea level energy in a high-frequency domain is in-creasing with the dein-creasing of a Eulerian disturbance period/duration (i.e. with the disturbance wavelength) due to short (a few tens of km) length scales of the Proudman resonance generation areas. The resonance is efficiently occurring at certain depths only (reso-nance depth is about 40 m for the disturbance speed of 20 m/s). Therefore, extreme events and flooding in the affected bays are favoured with short and intense atmo-spheric gravity waves, as they match natural frequencies of the corresponding bays/harbours. Oppositely, low-frequency natural modes of the whole area (fundamen-tal at 4 h and higher ones) favour longer atmospheric disturbances, but the energy transfer towards the sea (resonance amplification) is significantly lower due to a large length scale compared to the resonance areas.
more efficient in the generation of both Proudman and harbour resonances. Although abrupt pressure changes are common in nature (e.g. on frontal lines, squalls, gusts), no regular box function with an instantaneous air pressure step and sharp box edges may occur in na-ture, which significantly decreases the amount of high-frequency energy, as observed in August 2004 (Vilibi´c et al., 2005).
– The amplification rate (gain) in front of the affected bays is defined by the local topography. At some fre-quencies (e.g. at 0.15 cpmin at Stari Grad Bay) its ab-solute values may surpass 50 or even 100 cm/hPa. If such a frequency coincides or is close to the natural pe-riods of a bay (e.g. at 0.16 cpmin at Stari Grad Bay), harbour resonance may be quite energetic, resulting in strong floods of the inner bay areas.
– Different topographic characteristics (different depths) in front of Stari Grad and Vela Luka Bays results in vari-ous resonance efficiency for varivari-ous disturbance speeds. Maximum energy is reached for the speed of 22 m/s off Stari Grad and 26 m/s off Vela Luka, which may par-tially explain a lack of coincidence in observed floods. Yet other factors contribute to that, such as the differ-ence in energy content of a real air pressure series, the difference in bay shapes (Stari Grad Bay is channel-like whereas Vela Luka Bay is cone-like) and the different directions of the disturbance propagation, which will be topic of future investigations.
Acknowledgements. The 2DD numerical model was developed by K. Black and was kindly provided from ASR Ltd., New Zealand, with assistance of N. Domijan. M. Orli´c provided bathymetry file used in the model. The Ministry of Science, Education and Sport of the Republic of Croatia supported the research through grants 0001001 and 0119330.
Topical Editor N. Pinardi thanks A. B. Rabinovich and two other referees for their help in evaluating this paper.
References
Black, K. P.: The Numerical Hydrodynamic Model 3DD1 and Support Software, Department of Earth Sciences, University of Waikato, New Zealand, Occasional Report No. 19, 1995. Candela, J., Mazzola, S., Sammari, C., Limeburner, R., Lozano, C.
J., Patti, B., and Bonnano, A.: The “Mad Sea” phenomenon in the Strait of Sicily, J. Phys. Ocea., 29, 2210–2231, 1999. Defant, A.: Physical Oceanography, Pergamon, Oxford, 1961. Donn, W. L.: The Great Lakes storm surge of May 5, 1952, J.
Geo-phys. Res., 64(2), 191–198, 1959.
Dragani, W. C., Mazio, C. A., and Nu˜nez, M. N.: Sea level oscilla-tions in coastal waters of the Buenos Aires province, Argentina, Continental Shelf Research, 22, 779–790, 2002.
Garcies, M., Gomis, D., and Monserrat, S.: Pressure-forced seiches of large amplitude in inlets of the Balearic Islands – 2 – Obser-vational study, J. Geophys. Res., 101(C3), 6453–6467, 1996. Gomis, D., Monserrat, S., and Tintore, J.: Pressure-forced seiches
of large amplitude in inlets of the Balearic Islands, J. Geophys. Res., 98(C8), 14 437–14 445, 1993.
Herak, M., Orli´c, M., and Kunovec-Varga, M.: Did the Makarska earthquake of 1962 generate a tsunami in the central Adriatic archipelago?, J. Geodyn., 31, 71–86, 2001.
Hibiya, T. and Kajiura, K.: Origin of theAbikiphenomenon (a kind of seiche) in Nagasaki Bay, Journal of the Oceanographical So-ciety of Japan, 38, 172–182, 1982.
Hodˇzi´c, M.: Occurrences of exceptional sea-level oscillations in the Vela Luka Bay (in Croatian), Priroda, 68(2-3), 52–53, 1980. Hydrographic Institute: Pilot for Small Ships and Boats (in
Croa-tian), Vol. 2, Hydrographic Institute of the Republic of Croatia, Split, 2003.
Liu, P. L.-F., Monserrat, S., and Marcos, M.: Analytical simulation of edge waves observed around the Balearic Islands, Geophys. Res. Lett., 29(17), 1847, doi:10.1029/2002GL015555, 2002. Liu, P. L.-F., Monserrat, S., Marcos, M., and Rabinovich, A. B.:
Coupling between two inlets: Observation and modeling, J. Geo-phys. Res., 108(C3), 3069, doi:10.1029/2002JC001478, 2003. Mercer, D., Sheng, J., Greatbatch, R. J., and Bobanovi´c,
J.: Barotropic waves generated by storms moving rapidly over shallow water, J. Geophys. Res., 107(C10), 3152, doi:10.1029/2001JC001140, 2002.
Monserrat, S., Ibbetson, A., and Thorpe, A. J.: Atmospheric gravity waves and the “Rissaga” phenomenon, Q. J. Royal Meteor. Soc., 117, 553–570, 1991.
Monserrat, S., Rabinovich, A. B., and Casas, B.: On the recon-struction of the transfer function for atmospherically generated seiches, Geophys. Res. Lett., 25(12), 2197–2200, 1998. Orli´c, M.: About a possible occurrence of the Proudman resonance
in the Adriatic, Thalassia Jugoslavica, 16(1), 79–88, 1980. Proudman, J.: The effects on the sea of changes in atmospheric
pressure, Geophysical Supplement to the Monthly Notices of the Royal Astronomical Society, 2(4), 197–209, 1929.
Rabinovich, A. B.: Long Ocean Gravity Waves: Trapping, Res-onance and Leaking (in Russian), Gidrometeoizdat, St. Peters-burg, 1993.
Rabinovich, A. B. and Monserrat, S.: Generation of meteorological tsunamis (large amplitude seiches) near the Balearic and Kuril Islands, Nat. Hazards, 18, 27–55, 1998.
Rabinovich, A. B., Monserrat, S., and Fain, I. V.: Numerical mod-elling of extreme seiche oscillations in the region of the Balearic Islands, Oceanology, 39(1), 12–19, 1999.
Tintore, J., Gomis, D., Alonso, S., and Wang, D. P.: A theoretical study of large sea level oscillations in the Western Mediterranean, J. Geophys. Res., 93(C9), 10 797–10 803, 1988.
Vilibi´c, I., Domijan, N., Orli´c, M., Leder, N., and Pasari´c, M.: Resonant coupling of a traveling air-pressure disturbance with the east Adriatic coastal waters, J. Geophys. Res., 109, C10001, doi:10.1029/2004JC002279, 2004.