QUALITY EVALUATION OF 3D CITY BUILDING MODELS WITH AUTOMATIC
ERROR DIAGNOSIS
Jean-Christophe Michelin1,2, Julien Tierny2, Florence Tupin2, Clément Mallet1and Nicolas Paparoditis1
1IGN/SR, MATIS, Université Paris Est, 73 avenue de Paris, 94160 Saint-Mande, France,
2Institut Mines-Télécom, Télécom ParisTech, LTCI, 46 rue Barrault, 75634 Paris Cedex 13, France,
Commission III/4
KEY WORDS:3D City Models, buildings, error evaluation, self-diagnosis, feature extraction, classification
ABSTRACT:
Automatic building modelling allows a cost effective access to 3D semantic information of cities. However, even state-of-the-art algorithms have intrinsic limits and many errors exist in 3D reconstructions, requiring expensive manual corrections. A new approach is proposed in this paper for the automatic diagnosis of 3D building databases in urban areas. A novel error taxonomy which allows a subsequent high-level diagnosis is first proposed. Then, relevant raster and vector features are extracted from very high resolution multi-view images and Digital Surface Models so as that to retrieve such errors. In a supervised way, a set of functions is presented in order to take high-level decisions from these low-level features. Experiments on 355 buildings in an European dense city center with 10 cm airborne images demonstrate the high accuracy on error detection and show promising results.
1 INTRODUCTION
Over the last two decades, three-dimensional city modelling has been one of the main research issues for urban planning and city understanding, with an emphasis on building detection and re-construction. With various levels of details (LoD) (Gröger and Plümer, 2012). State-of-the-art automatic reconstruction algo-rithms address the LoD2, which proposes a metric representa-tion of 3D facets of the roofs and facades. However their high quality generation is still a challenge in complex urban environ-ments (Rottensteiner et al., 2012). A large number of method-ologies was developed with various remote sensing data sources - optical images (Bulatov et al., 2012), lidar (Lafarge and Mal-let, 2012), radar (Sportouche et al., 2011) - mainly focused on building extraction from aerial and satellite optical images. The adopted methods heavily depend on the spatial resolution of the input data and no generic method has been developed so far. Re-gardless of the computed approach, the evaluation of generated 3D building city models has been barely tackled in the literature, apart from measures proposed in the ISPRS benchmark of Rot-tensteiner et al. (2012), and simple distances between 3D models and ground truth measurements (Macay Moreira et al., 2013). Currently, evaluation can be only detected with (expensive) vi-sual inspection or with (non-generic) intrinsic criteria of recon-struction methods, which are both unsatisfactory. Automatic di-agnosis (AD) appears an invaluable input for several purpose:
• Operational improvementof 3D building database (DB). One of the main limits of fully automatic reconstruction al-gorithms is the difficulty to distinguish the correct recon-structed buildings from the others. AD can put aside the correct ones and selects the erroneous reconstructions for more efficient subsequent manual edition.
• 3D change detection: if a DB is correct at the timet1, the AD computation with more recent data acquired at time t1+ǫmay provide a knowledge of areas requiring updates (Taneja et al., 2013).
• Reconstruction algorithm selection: a large number of re-construction techniques exists featuring specific advantages and flows. An AD computed on different reconstructions al-lows to select the best proposal for a given specification and landscape.
Important and very high-level operational errors (e.g., an inner court is missing in a building) cannot be only computed with low-level geometric measures. Therefore the proposed strategy should provide hierarchized indicators for operational issues. An-other major challenge of AD is also one of the main operational implementation difficulties: the proposed AD algorithm needs to be fully independent to the (unknown) reconstruction method-ology, in order to avoid under/misdetection. Moreover, such a strategy allow a simple upgrade of production lines and opens up perspectives for controlling data for unknown providers. This paper aims to propose an automatic strategy for the evalu-ation of any kind of LoD2 3D building city models. Using very high resolution images (10 cm) in a high multi-stereoscopic con-figuration, we focus on roof modelling and footprint outlining di-agnosis, assuming building roof facets are represented as closed polygons. The proposed algorithm is decomposed in two parts. Firstly different set of features are extracted from DSM and multi-view images. Secondly, these features are compared to DB with a one-against-all classification. Our paper exhibits several new contributions:
• A new taxonomy of errors and their most probable sources. Such a taxonomy has been established with operational ser-vices of the French National Institute of Geographic and Forest Information, and corresponds to real customer feed-backs;
• A set of low-level geometric features and interpretations of associated measures to propose a high-level building quality diagnosis;
• A novel analysis strategy, based on these measures, pro-poses a high level identification of problems.
This contribution has been peer-reviewed.
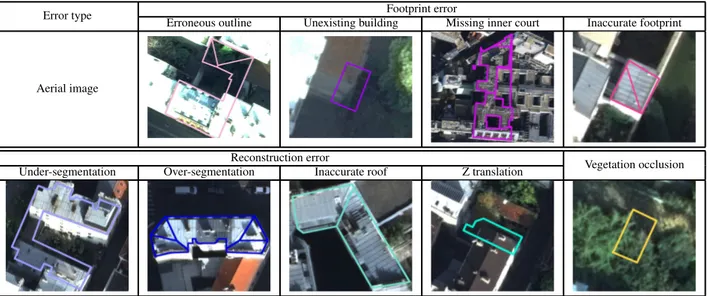
Error type Footprint error
Erroneous outline Unexisting building Missing inner court Inaccurate footprint
Aerial image
Reconstruction error
Vegetation occlusion Under-segmentation Over-segmentation Inaccurate roof Z translation
Figure 1: Error taxonomy composed of nine classes, split in three domains For each error, the corresponding roof is superimposed on one of the available aerial images. The proposed color code is specific for each error, and will be employed for the rest of this paper.
2 RELATED WORK
There are two different ways to evaluate 3D models: intrinsic or extrinsic diagnosis. On the one hand, the 3D model generation algorithm is well known (and thereby its drawbacks as well). On the other hand, external data is used to estimate the correctness of the reconstruction. Such data can be very accurate field sur-veys or very high density terrestrial laser scanning point clouds, similarly to the semi-automatic approach proposed by Helmholz et al. (2013). Oblique aerial images can be a more cost-effective solution. However occlusions management in high density urban cities is one of the major challenges and therefore limit the ap-proach to the 2D building outline diagnosis (Nyaruhuma et al., 2012). Quantitative and qualitative evaluations can involve visual inspection (Durupt and Taillandier, 2006), another reconstructed reference scene (Meidow and Schuster, 2005) or ground truth sur-veyed measurements (Macay Moreira et al., 2013). These papers highlight the role of the accuracy of the input data (here a DSM) and of the 2D topographic maps used for the reconstruction pro-cess. Our paper proposes an extrinsic evaluation to be performed on virtually any LoD2 3D city models.
An evaluation approach based on geometrical errors and segmen-tation accuracy has to be interpreted with caution (Rottensteiner et al., 2012). A given qualification, without topological clari-fication, based only on a root mean square (RMS) score is not adequate enough, since a simple 3D mesh (without reconstruc-tion and semantizareconstruc-tion) would produce the best results. Thus, to diagnose, a building facet criterion is commonly proposed with a topology control strategy (Zhou and Neumann, 2011).
Even if the automatic diagnosis of 3D building remains unsolved in remote sensing, the change detection field has dealt with re-lated problems. Instead, the goal is to detect changes with more recent data than those computed for the DB generation. The automation of a DB diagnosis conventionally based on photo-interpretation has begun more than 15 years ago (Lu et al., 1998). Several methods were proposed with different input data: satel-lite images (Champion et al., 2010), aerial images (Zhu et al., 2009), aerial lidar (Rutzinger et al., 2010). Other approaches use terrestrial data like panoramical images (Taneja et al., 2013) or terrestrial laser scans (Kang and Lu, 2010). In any case, envi-ronmental changes (weather, illumination...) negatively impact
the decisions. The proposed solutions rely on the computation of geometrical features: for example, Taneja et al. (2011) test the hypothesis that elements from one image projected on the DB are superimposed with the same elements in other images. If not, a geometry change is assumed to have occurred. Other meth-ods based on image radiometry, e.g., shadows and roof colors (Benedek et al., 2012), exist but they depend on the studied scene types (Olsen, 2004). One can note that, when available, DSM highly improves the classification results (Le Bris and Chehata, 2011). Even if change detection and AD have in common geo-metrical extraction of features and a classification issue, they dif-fer in several points. Firstly, AD does not assume that the building DB correspond to a ground truth representation. Secondly, data type is different: multi-temporal and more accurate/better resolu-tion data than these used for the DB crearesolu-tion are not accessible. For these reasons, for AD approach, change detection algorithms cannot always be applied straightforwardly.
Recently, to the best of our knowledge, only one paper addressed facet-based self-diagnosis (Boudet et al., 2006). The methodol-ogy based on texture and structure analysis allowed a detection of four different roof error classes (false, generalised, acceptable, and correct) but exhibits several limitations:
• Taxonomy limitedto a particular DB specification: in fact, the error acceptability degree of a DB depends on the user needs. In an operational context, some errors are more im-portant than the others. Thus, an unambiguous estimation in error labelling is expected.
• Non quantitative assessment: no confidence score is pro-vided. Therefore, it limits the operational use because no error hierarchy can be proposed. The different kinds of er-ror cannot be established and only one global quality assess-ment is provided;
3 MATERIAL
3.1 Input data
A fully-automatic 3D reconstruction of the city of Paris is avail-able. It was computed with the approach proposed in (Durupt and Taillandier, 2006). In this method, the 2D building footprints are supposed to be known and will be evaluated jointly with the roof facets. To estimate a roof topology, a set of possible simulated planes is computed, then the best model is selected as the one that minimizes a correlation score with a high resolution a 10 cm dig-ital surface model (DSM). The altitude of gutter and roof slopes are estimated with a robust distance minimisation on DSM.
The proposed AD is based on very high resolution aerial images (RGB+IR) which were used to generate the city DB. This data (acquired in 2008) is 10 cm of resolution, with an endlap of 40 % and sidelap of 80 %. This is a high multi-view context: each point of the DB can be projected in images up to 10 times.
3.2 Error taxonomy
In this paper, a study of typical errors of LoD2 city models was performed stemming from requirements of production lines and customers feedbacks of the French National Institute of Geo-graphic and Forest Information, and has led to the creation of a new taxonomy (Figure 1). Nine building errors can be classified in three types:
• Footprint errorsare caused by an incorrect building out-line (errors from input data). Consequently, four sub-errors exist: - erroneous outline: the proposed external footprint does not match with the real footprint;
- unexisting building: the footprint does not match with any building;
- missing inner court: the proposed footprint needs an inter-nal polygon but the outline is correct;
- inaccurate footprint: the footprint matches with the foot-print of the ground truth but has a geometrical error, related to a given specification (quantification of accuracy).
• Reconstruction errors: inherent to the reconstruction algo-rithm:
- under-segmentation: one or more roof ridges are missing; - over-segmentation: some parts of roof should not exist; - inaccurate roof: a proposed ridge has geometrical errors, related to a given specification;
- Z translation: the proposed roof is incorrectly positioned in altitude.
• Vegetation errorsare present when the proposed building is underneath tree canopy. In this case, the AD cannot be reliably computed anymore.
The proposed errors cannot be simply evaluated independently, but this taxonomy definition is easily understandable for an op-erator. The errors may come from building detection algorithm, wrong eliminations of superstructure in roof calculation, complex buildings out of predefined shapes, vegetation occlusion, etc. Un-certainties in DSM due to occlusion and the regularization step applied during surface reconstruction can imply too soft slopes estimation near altimetric discontinuities and have a significant impact of reconstruction results.
3.3 Error statistics
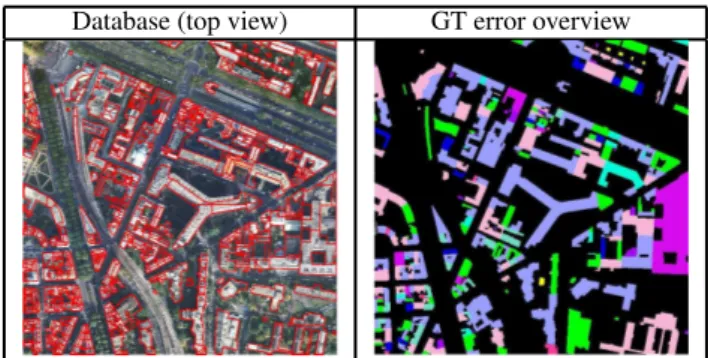
A ground truth of 355 buildings was created from the DB. For op-erational issues a maximum of 4 errors were labelled per building. The area was selected due to its large variety of buildings: tow-ers, traditional roofs, complex European buildings, and houses representative of peri-urban areas. One can note thatinaccurate footprint,inaccurate roof, andZ translationerrors are less impor-tant for the DB quality than the others because they do not affect the building representation but only its geometrical accuracy (the proposed topology is correct). One can refer to Figure 2, where an overview with the most prominent error per building is pro-vided: only 21%of labelled buildings do not have any error. In the case of footprint errors,erroneous outline(22%) of the total of buildings is the most prevalent error, thenunexisting building
(8%),inaccurate footprint(5%), and missing inner court (2%). For reconstruction errors, ratio are also important:sub- segmen-tation(19%),inaccurate roof (9%),over-segmentation(7%),Z translation(4%). Only 2%of buildings have avegetationerror: it highly depends on the proportion of vegetation in the study area.
One (or several) sources of error can exist for each build-ing. A study performed in the labelled DB highlights the mul-tiple error sources: erroneous footprint reconstruction (41%), false sub-building segmentation (28%), erroneous estimation su-perstructure (19%), too complex buildings to be automatically reconstructed (8%), vegetation occlusion -including shrub on balconies- (7%), wrong reconstruction of DSM due to a very high neighbour building (5%).
Database (top view) GT error overview
Figure 2: An overview of the Ground Truth (GT): a maximum of 4 labels per element.
Correct■; Erroneous outline■; Unexisting building■; Missing inner court■; Inaccurate footprint■; Under-segmentation■; Over-segmentation■; Roof inaccurate■; Z translation■; Vegetation■.
4 PROPOSED APPROACH
Building qualification depends on an interpretation step and needs to know the expected generalisation degree. To avoid this difficult step, the proposed approach consists in testing for each building the presence of the nine errors contained in the taxon-omy (cf Figure 1). Our algorithm can be decomposed into two steps. First, a feature extraction step is performed: for each build-ing a set of vector and raster images are extracted from both aerial images and DSM. Then, a comparison of the features with the DB is proposed to compute a set of descriptors, which finally leads to the classification of each building.
4.1 Feature extraction
Four kinds of features are computed (Figure 3):
•Image-based 3D segment extraction: retrieving a very com-plete set of segments is an important step to verify the building
This contribution has been peer-reviewed.
contours. We use the algorithm proposed by Taillandier and De-riche (2002). For our experience it provides sufficiently accurate results. Using the multi-view context, polygonalized contours are extracted in aerial images and accumulated in the 3D object space with the use of plane sweeping algorithms. Extracted 3D seg-ments are validated with images (quality test: χ2). These seg-ments correspond to high radiometric discontinuities in images such as building edges, but also road marks, zinc roof battens etc. As illustrated on Figure 3a, the detection is very exhaustive but a filtering step is required to prune the lines which are irrelevant for our purpose (see Section 4.2). The goal of this feature is to detect
over-segmentation,inaccurate roof,Z translationandfootprints errors, and will be notedΣimg.
O
rt
h
oi
m
age
E
xt
ra
ct
ed
fe
at
u
re
(a) (b) (c) (d)
Extracted 3D
segment Osr 2π sr 0 6m DB segment
Concave segment Convex segment DSM concave pix. DSM convex pix.
Figure 3: Extraction of feature to detect errors: a- Image based 3D segment extraction (Σimg), b- Mixed
DSM-image based 3D segment extraction (Σmix), c- Sky
Viewshed Angle (SVA), d- Distance based NDVI mask (DNDVI).
• Mixed DSM-image based 3D segment extraction. The goal of this feature is to retrieve very robust 3D segments to detect specifically under-segmentation errors. Because of the regularisation of the DSM, the resulting surface is too smooth around high discontinuities, what excludes segment extraction near building walls. To locate the DSM discontinuities, a scalar product is computed between robustly extracted normals (L1.2 estimator in a spherical neighbourhood of 1 m). One of the keys of the proposed algorithm is the improvement of the robustness by the separation of convex and concave discontinuities. For this purpose, the main direction of each discontinuity pixel is com-puted using Principal Component Analysis (PCA). The concav-ity type can be deduced by the analysis of the neighbourhood in the orthogonal direction of the main direction. A Radon trans-form (Radon, 1986) computed on convex and concave disconti-nuities allows to obtain 2D line directions. Then, a RANSAC algorithm is performed on the DSM to obtain 3D segments from 2D lines. Because of a high false-detection rate, a filtering step is required. Local gradients in the orthogonal direction of the projected 3D segment in aerial images is computed: segments with non-homogeneous and low gradient are discarded. A non exhaustive but very robust set of segments, which correspond to DSM discontinuities and high gradient values in aerial images, is obtained (Figure 3b). This feature will be notedΣmix.
•Sky Viewshed Angle (SVA)is a DSM-based feature, proposed to detectmissing inner courterrors. This solid angle is computed for each pixel: a 16-direction sample ray tracing allows an ad-missible computing time with good accuracy. As illustrated on Figure 3c, SVA is a good descriptor for enclosed areas.
•Distance-based NDVI mask. The goal of this feature is to detectvegetationerrors. A true robust NDVI orthoimage is first computed using both DSM and aerial images. In case of ambigu-ity (i.e. if the average deviation value of the computed point from the median of all images>10%) no value is computed. A binary
in holes and cavities by applying a voting operation on each pixel. Finally, an Euclidean distance is computed using the algorithm presented in (Danielsson, 1980). As illustrated on Figure 3d, this feature allows us to assess whether a pixel is near the edge or in the center of a vegetated area. It will be noted DNDVI.
4.2 Error detection
The extracted features and the DB can be compared to detect all errors of the taxonomy. We will note SkGLthek
th
segment com-posing the DB gutter line and respectively SkR for the kth roof
segment.
(a)
(b)
(c)
(d)
(e)
Figure 4: Illustration of the proposed functions for DB error classification.
A template function is defined to compare a set of segments S={S1,S2...}from another oneΣ ={s1,s2...}, as illustrated on Figure 4a (lis a segment length). Three points need to be highlighted for the understanding of the proposed computation algorithms:
• A projectionP(on a horizontal or vertical plane) separates planimetic errors from altimetric ones (cf. Figure 4b);
• As explained in Part 4.1, a filtering step based on the seg-ment direction∆(normalized between 0 and 180o) is com-puted;
• The neighbourhoodV with a radius of 50 cm centred at of the studied point can be a 2D disk or a 3D sphere.
The sampling step d is fixed to a half pixel resolution (5cm). Four template functions are then defined to characterize the various er-rors:
•Relative Validation Function (RVF) is defined to compare ex-tracted segments to a subset of DB segments (i.e. gutter lines segmentSGL, roof segmentsSR) as:
RVF(S,Σ) =d
Card(S)
P
k=1
⌊l(Sk)/d⌋ P
p=1
δ(Sk(p),Σ)
Card(S)
P
k=1
l(P(Sk))
with :
δ(Sk(p),Σ) =
0 ifP(Sk(p))∩ V(P(Σ))6=∅
and∃s∈Σ/|∆(P(s))−∆(P(Sk(p)))|< θ
1 otherwise
(1)
As illustrated on Figure 4c, RVF consists in checking which parts of DB segments are validated by a set of extracted segments projected on a horizontal/vertical plane after a direction thresh-olding (θ) filtering step. RVF is normalised by the total length of the studying set of segments (i.e. perimeter in case of gut-ter line). One can note that RVF(SGL,Σimg) checks the
erro-neous outline/unexisting buildingerrors , and RVF(SR,Σimg)
Quantity
% 0 0 5 10 15 20
20 40 60 80 100 4.8
AVF(SGL,Σimg)
0 0.2 0.4 0.6 0.8 0
20 40
60 0.34 0.53
RVF(SGL,Σimg)
60 80 100 120 140 0
20 40 60
100
min(DSVA)
0 0.2 0.4 0.6 0.8 0
20 40 60
0.45
AEF(SGL,Σimg)
0 2 4 6 8 10 12 0 10 20 30 40 50 5
AVF(Σmix,SR)
0 2 4 6 8 10 0 10 20 30 40 50 3.6
AVF(SR,Σimg)
0 0.2 0.4 0.6 0.8 0 10 20 30 40 50 0.27
RVF(SR,Σimg)
0 0.2 0.4 0.6 0.8 0 10 20 30 40 50 0.35
AEF(SR,Σimg), plan. norm
0 2 4 6
0 10 20 30 40 50 2.5
AEF(SR∪SGT,Σimg), alt. norm
0 1 2 3 4 5 6 0 20 40 60 80 2.5 DNDVI
0 2 4 6 8 10 12 0 20 40 60 80 5.5
max(DNDVI)
■Erroneous outline
■Unexisting building
■Missing inner court
■Inaccurate footprint ■Under-segmentation ■Over-segmentation ■Roof inaccurate ■Z translation ■Vegetation
Figure 5: Error detection using one-against-all method (training set).■: complement of each evaluated error. - -: computed threshold.
In our paper,θis empirically fixed to 20o, which is a hard thresh-old to delete non-matching segments.
•Absolute Validation Function (AVF) is similar to RVF with-out normalisation, in order to check large buildings which may be misdescribed with a relative measure. AVF is length of the longest connected set which does not satisfy:
∀k∈[1,Card(S)]and∀p∈[1;⌊l(Sk)/d⌋]we have:
P(Sk(p))∩ V(P(Σ))6=∅and∃s∈Σ
such that|∆(P(s))−∆(P(Sk(p)))|< θ
(2)
AVF(SGL,Σimg) and AVF(SR,Σimg)can be applied to
comple-ment the number of error detections of the RVF function. More-over, an over-segmentation detector AVF(Σmix,SR) can be defined
with the computation of the mixed DSM-image segmentsΣmix
which are not validated with DB roof segmentsSR.
To detectinaccurate footprint,roof inaccurate, andZ translation
we can now define a Spatial Filter Function (SFF) (Figure 4d) which discards non-valid segments, in order to obtain a subset SSFFfrom DB segments:
SFF(S,Σ) ={SSFF⊂S/AVF(SSFF,Σ) = 0} (3)
•Spatial Average Error Function (AEF) is proposed to compute distances between the DB and validated segments:
AEF(S, T) = 1 Card(SFF(S, T))
X
SSFF∈SFF(S,T)
Q(SSFF, T) (4)
Qis a pseudo-distance, as illustrated in Figure 4e, between one segmentT and a set of segmentsS. It is defined with a segment samplingE, as follows:
Q(Σ,S) =
Card(E(Σ))
P
k=1
min(γ(E(Σ)k,E(S)))
Card(E(Σ)) (5)
γ(p,C) a set of Euclidean distances between a point pand a point cloud C. This pseudo-distance is based on the minimum closest point. Ifγ is planimetric, AEF(SGL,Σimg)can provide
a quality score forinaccurate buildingerrors, and respectively AEF(SR,Σimg) for inaccurate footprint. If γ is altimetric, Z
translationcan be quantified with AEF(SR∪SGT,Σimg).
•Vegetationand missing inner court errors cannot be diagno-sis with DB segments. Nevertheless, functions on raster features like the average DNDVIand max(DNDVI) (for large buildings)
de-tectvegetationerrors. In addition, min(DSVA) is amissing inner
courtindicator.
5 RESULTS
Half of the labelled buildings is chosen as a training set to study the discrimination potential of the proposed functions. The distri-bution of the errors in the DB was carefully preserved in the train-ing set. Figure 5 illustrates the error distribution for each function in a one-against-all approach. For each error, the proposed func-tion(s) is(are) computed on the training set: a one-against-all histogram is represented with computed score. Therefore, it demonstrates how the proposed functions are relevant. The less the histograms overlap, the more discriminated error measure will be (error and complement error). The threshold is fixed to the best value which separates the two distributions according to inter/intra classes separation criterion. One can note that the proposed functions are satisfactory to discriminate the coarsest errors of the training data. These errors are the most important because they drastically affect the building representation. One can note that of the most frequent errors (cf. Section 3.3) are satisfyingly discriminated.
A simple binary one-against-all classification is then performed on the second part of labelled DB (test set). Thresholds (i.e. the point which maximizes separations) are selected thanks to the study of histograms with inter/intra classes variances criterion (Figure 5).
%
Error type TPFN TNFP
Erroneous outline 73 27 13 87
Unexisting building 82 18 9 91
Missing inner court 79 21 16 84
Inaccurate footprint 61 39 43 57
Under-segmentation 78 22 24 76
Over-segmentation 6816 3274
Inaccurate Roof 64 36 34 66
Z translation 7163 2937
Vegetation 100 0 22 78 (a)
(b)
(c) ■: training set■: detected■: not detected
Figure 6: (a) Confusion matrix; (b) Results for the proposed GT overview; (c) Results for theerroneous outlineerror.
This contribution has been peer-reviewed.
As illustrated on Figure 6a and b, results are satisfactory with an average TP rate of 75%. 100%of buildings in vegetation are correctly classified. Erroneous outlineerrors are detected with a rate of 82%and the confusion matrix ofunexisting buildingis almost an identity matrix, which implies a very confident detec-tion. In Figure 6c, the proposed descriptor forerroneous outline
error is very discriminative. One can note that this error detection is a typical operational issue: this error needs absolutely to be detected and corrected (source of others errors).
Missing courterrors are correctly retrieved. However, this per-formance could be improved without the errors due to DSM in-accuracies.Overandunder-segmentationerrors are also well de-termined. Classification ofinaccurate footprint,inaccurate roof
andZ translationis less efficient. This problem can be explained by several reasons. First, these errors are the finest and conse-quently the most difficult to detect. Secondly, these error detec-tions are linked to the other ones: Z translationis often corre-lated withover-segmentationand the proposed function fails by attempting the separation.
One can note that TP, FP, FN, TN rates of training and test sets are almost similar (±5%) for coarser errors, which implies that the proposed approach exhibits good generalization properties.
6 CONCLUSIONS AND FUTURE WORK
In this paper, we have presented a novel solution for 3D building city models automatic quality diagnosis. It is based on a new error taxonomy and features extracted from very high resolution multi-view images. To solve this complex problem we propose to detect different high-level errors. Therefore, a study was performed to know the different type of errors in building DB. The main con-cern of this paper was to detect several errors for each building, that allows a larger number of applications, instead of a pure bi-nary result. Quantitative results are acceptable, with satisfactory true positive rates (>70%) for the most important errors. Further-more results can be improved with some recent approaches pro-viding additional and helpful hints such as superstructures (Brédif et al., 2007). The major limitation of this approach is the dif-ficulty to detect finest errors asinaccurate roof andinaccurate footprintbecause they are mixed with coarser errors. Another limitation is that only linear low-level primitives are extracted. However, more advanced primitives (curves or key-points) may be inserted in the feature extraction computation to apply the pro-posed approach to other types of landscapes. Future works will focus on the increase of the size of the testing database to test the generalisation of the proposed approach to a larger area. Finally we would like to propose a more sophisticated classification to significantly improve the results, and to handle uncertainties in the labelling process.
References
Benedek, C., Descombes, X. and Zerubia., J., 2012. Building development monitoring in multitemporal remotely sensed im-age pairs with stochastic birth-death dynamics. IEEE TPAMI 34(1), pp. 33–50.
Boudet, L., Paparoditis, N., Jung, F., Martinoty, G. and Pierrot-Deseilligny, M., 2006. A supervised classification approach to-wards quality self-diagnosis of 3D building models using dig-ital aerial imagery. IAPRS vol. 36(3), pp. 136-141.
Brédif, M., Boldo, D., Pierrot-Deseilligny, M. and Maitre, H., 2007. 3D Building Reconstruction with Parametric Roof Su-perstructures. ICIP, vol. 2 pp. 537–540.
Bulatov, D., Rottensteiner, F. and Karsten, S., 2012. Context-based urban terrain reconstruction from images and videos. IAPRS vol.1(3) 1(2), pp. 185–190.
Champion, N., Boldo, D., Pierrot-Deseilligny, M. and Stamon, G., 2010. 2D building change detection from high resolution satellite imagery: A two-step hierarchical method based on 3D invariant primitives. Pattern Recognition Letters vol. 31(10), pp. 1138-1147.
Danielsson, P., 1980. Euclidian distance mapping. Computer graphics and image processing vol. 14.
Durupt, M. and Taillandier, F., 2006. Automatic building recon-struction from a digital elevation model and cadastral data: An operational approach. IAPRS vol. 36(3).
Gröger, G. and Plümer, L., 2012. CityGML Interoperable seman-tic 3D city models. ISPRS Journal 71, pp. 12 – 33.
Helmholz, P., Beldon, D. and Moncrieff, S., 2013. Approach for the semi-automatic verification of 3D buildings models. IAPRS vol. 40(1/W1), pp. 121-126.
Kang, Z. and Lu, Z., 2010. The change detection of building models using epochs of terrestrial point clouds. IAPRS vol. 38(8), pp. 231-236.
Lafarge, F. and Mallet, C., 2012. Creating large-scale city models from 3D-point clouds: a robust approach with hybrid represen-tation. IJCV vol. 99(1), pp. 69-85.
Le Bris, A. and Chehata, N., 2011. Change detection in a to-pographic building database using submetric satellite images. IAPRS vol. 38(3/W22), pp. 25-30.
Lu, W., Doihara, T. and Matsumoto, Y., 1998. Detection of build-ing changes by integration of aerial imageries and digital maps. IAPRS vol. 32, pp. 314-317.
Macay Moreira, J., Nex, F., Remondino, F. and Jim, N., 2013. From DSM to 3D building models : quantitative evaluation. IAPRS vol. 40(1), pp. 213-219.
Meidow, J. and Schuster, H.-F., 2005. Voxel-based quality evaluation of photogrammetic building acquisitions. IAPRS vol.36(3/W24), pp. 117-122.
Nyaruhuma, A. P., Gerke, M., Vosselman, G. and Mtalo, E. G., 2012. Verification of 2D building outlines using oblique air-borne images. ISPRS Journal 71, pp. 62 – 75.
Olsen, B., 2004. Automatic change detection for validation of digital map databases. IAPRS vol. 34(B2), pp. 564-574.
Radon, J., 1986. On the Determination of Functions from Their Integral Values along Certain Manifolds. IEEE TIM vol. 5(4), pp. 170-176.
Rottensteiner, F., Sohn, G., Jung, J., Gerke, M., Baillard, C., Benitez, S. and Breitkopf, U., 2012. The ISPRS benchmark on urban object classification and 3D building reconstruction. IAPRS vol. 1(3), pp. 293-298.
Rutzinger, M., Rüf, B., Vetter, M. and Höfle, B., 2010. Change detection of building footprints from airborne laser scanning acquired in short time intervals. IAPRS vol. 38(7b), pp. 475-480.
Sportouche, H., Tupin, F. and Denise, L., 2011. Extraction and three-dimensional reconstruction of isolated buildings in urban scenes from high-resolution optical and SAR spaceborne im-ages. IEEE TGRS vol.49 (10), pp. 3932-3946.
Taillandier, F. and Deriche, R., 2002. Reconstruction of 3D linear primitives from multiple views for urban areas modelisation. IAPRS 34(3A), pp. 267–272.
Taneja, A., Ballan, L. and Pollefeys, M., 2011. Image based de-tection of geometric changes in urban environments. ICCV’11.
Taneja, A., Ballan, L. and Pollefeys, M., 2013. City-scale change detection in cadastral 3D models using images. CVPR’13.
Zhou, Q.-Y. and Neumann, U., 2011. 2.5D building modeling with topology control. CVPR’11 pp. 2489–2496.