Available online at www.tshe.org/EA EnvironmentAsia 3(1) (2010) 20-31
The international journal published by the Thai Society of Higher Education Institutes on Environment
E
nvironment
A
sia
1. Introduction
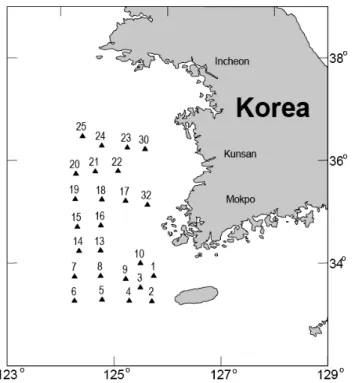
The Yellow Sea Large Marine Ecosystem (YSLME) is a semi-enclosed body of water bounded by the Chinese mainland to the west, the Korean Peninsula to the east, and a line running from the north bank of the mouth of the Yangtze River (Chang Jiang) to the south side of Cheju Island. It covers an area of about 400,000 km2 and measures about 1,000 km by
700 km. It is shallow with a mean depth of 44 meters, and it slopes gently from the Chinese continent (Fig. 1). This international water body, one of the 50 large LMEs in the world, supports substantial populations of fish, invertebrates, marine mammals, and sea birds which in turn support partially 600 million people living on its basin. YSLME is presently threatened by both land- and sea-based sources of pollution resulting from extensive economic development in the coastal zone. The major industrial and agricultural wastes to this LME come from the three littoral countries that share this water, namely, Democratic People’s Republic of Korea, the People’s Republic of China and the Republic of Korea. She (1993) characterized the YSLME as severely impacted by anthropogenic pollution and reported disappearance of species.
In order to avoid further losses of biodiversity and degradation of the transboundary resources of the YSLME, Republic of Korea in collaboration with Peoples Republic of China has initiated Transboundary Diagnostic Analysis (TDA) along the recommenda-tion of UNEP Regional Seas Program’s Northwest Pacific Action Plan (NOWPAP). In the first phase of this initiative a survey began in April 2000 using R/V Dongbaek at Station number 1 (33o 45.049’N; 125o
44.593’E) and covered 31 stations northwards in the off shore waters of Republic of Korea. Two species of fish were collected from 16 stations as shown in Table 1. Several groups of Persistent Organic Pollut-ants (POPs), namely, Polychlorinated biphenyls (PCBs), DDTs, HCHs, HCB, aldrin, endrin, dieldrin, endosulfan, heptachlors, mirex and chlordane com-pounds were investigated in those samples (Table 2). A preliminary report on the sum of several of the tar-get compounds in sediment and fish was published earlier (Oh et al., 2005).
2. Materials and Methods
Two species of croakers (Collichthys niveatus
andPseudosciaena crocea) were collected from 16 Abstract
Persistent Organic Pollutants (POPs), namely, Polychlorinated biphenyls (PCBs), DDTs, HCHs, HCB, aldrin, endrin, dieldrin, endosulfan, heptachlors, mirex and chlordane compounds were investigated in muscle and liver tissues of Yellow Sea croakers (Collichthys niveatus and Pseudosciaena crocea) from 16 stations on the off shore waters of South Korea within the Yellow Sea Large Marine Ecosystem (YSLME). The sum concentration (minimummaximum -ng/g lipid wt.) was: PCBs: non-detectable to 21; Pesticides non-detectable to 63. Among the 26 individual pesticide compounds measured in fishes, except 1,2,4,5-tetrachlorobenzene (TCBZ), all the other compounds were determined in almost in all samples. The levels in Yellow Sea croakers were similar to levels reported in the Baltic fish. The differential ratios of isomers/congeners in biota in comparison to the original commercial mixtures suggest possible metabolism by cytochrome P450 isozymes. The induction of such drug metabolizing enzymes suggests an ecotoxicological stress. Principle Component Analysis identifies ‘hot spots, within the sampled area including the Korean off shore sewage dumpsite.
Keywords: POPs; pesticides; agrochemicals; PCBs; Yellow Sea; large marine ecosystem; Korean Offshore sewage dumping; survey; fish.
Occurrence and Biological Fate of Persistent Organic Contaminants in Yellow Sea Fish
Narayanan Kannan a, Hae Kyoung Choi a, Sang Hee Hong a, Jae Ryoung Oh b
and Won Joon Shim a
aSouth Sea Institute, Korea Ocean Research and Development Institute, 391 Jangmok-ri,
Jangmok-myon, Geoje 656830, Republic of Korea
bMarine Environmental Studies Laboratory, IAEA-Marine Environment Laboratories,
4 Quai Antoine 1er MC 98000, Principality of Monaco.
stations among the 25 stations sampled for sediment and fish as shown in Fig. 1. Fishes were dissected out on board and muscle and liver tissues were taken for analysis. The samples were placed in pre-cleaned containers and kept frozen until further analysis. Figure 1. Map showing the sampling sites
Packing and storage of the samples followed that of the normal NS&T protocol of US NOAA (Lauenstein and Cantillo 1993; 1998). The analytical procedure of OCs in fish was based on the method previously described by Sloan et al. (1993) and recently modified by Hong et al. (2003).
Fish tissue was homogenized and a 15 g aliquot was taken for analysis. The sample was mixed with sodium sulfate and macerated in dichloromethane. This extract was centrifuged and the supernatant collected. This procedure was repeated three times. At the end, the extracted pellet was discarded and the supernatant saved for analysis.
The percent lipid (weight/weight basis) of a tissue is operationally defined as the weight (in percent) of a material extracted from a tissue with dichloromethane. A 10 ml aliquot of soxhlet extracted biota samples was sub-sampled in a pre-weighed aluminum pan. The aliquot was evaporated into dryness. The residual weight of the dried portion was used to calculate the percent lipids of the sample based on the wet weight. The extract was cleaned using alumina-silica gel column chromatography. After the cleanup, a concentration step in a steam bath with a three-ball Snyder column was followed to reduce the volume of the solvent. The concentrated extract was subsequently cleaned using size exclusion
Table 1. Sampling (April 2000) stations in Yellow Sea
N. Kannan et al. / EnvironmentAsia 3(1) (2010) 20-31
21
Station Latitude Longitude Depth (m) Fish
chromatography (Phenomenex Co., 100$ column). Lipids and biogenic material were thus removed. Chlorinated hydrocarbons were analyzed using gas chromatography with 63Ni electron capture detector
(GC/ECD).
Quality assurance/quality control (QA/QC) procedures included analyses of duplicates, standard reference materials, and spiked internal standards (Honget al., 2003). In the organic analyses, internal standards were spiked at the start of the procedure and carried through the extraction, cleanup, and instrumental analysis steps to determine the recovery of the analysis. The following specific quality assurance steps were used to insure measurement accuracy and precision: One procedural blank, one matrix spike, one duplicate spike and one standard reference material were run with each batch of not more than 20 samples.
3. Results and Discussion
Stockholm convention on persistent organic pollutants (web source) identifies several pesticides whose residues are potentially injurious to human health. Except for toxaphene all the other pesticides mentioned in that convention were investigated in this study. For convenience, we discuss them in two categories, 1. agrochemicals (pesticides) and 2. PCBs. Muscle and liver tissues were analyzed in the fish. It was not possible to get enough catch in all the stations sampled. Unfortunately, sufficient liver tissue was not always available in all sampled fish. Hence, data points of stations varied in fish and among the fishes, between organs.
The analytical results of six classes of pesticides in two species of fish are given in Tables 2 to 5. Table 2 and 3 deal with Collichthys niveatus muscle and liver tissues. In this species, among the pesticides
analyzed, the content of DDTs was the highest followed by HCHs, chlorobenzenes, heptachlor compounds, chlordane and drins (dieldrin and endrin) in that order. Between the two tissues analyzed, the muscle tissue showed higher concentration than liver. This pesticide pattern was similar in Pseudosciaena crocea as well except the contents in the liver was higher than in the muscle (Table 4 and 5).
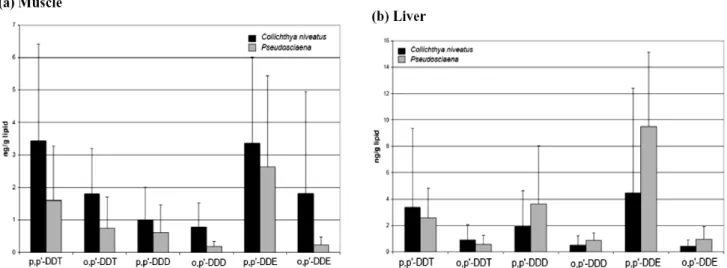
The composition of DDTs in C.niveatus muscle reveals a state of biotransformation of the parental compound (Young et al., 1971). For example, the biotransformation products, namely, p,pando,p DDD and DDE are amply represented (>50%) (Fig. 2). This is more clearly seen in the DDTs composition in the liver, as liver is the principle organ of drug metabolism. These observations apply to P. crocea species as well, except, the % contribution of DDE is much larger, possibly, reflecting the metabolic efficiency of this species to these compounds.
HCHs stand second in bioaccumulation in the fish. The HCHs composition in muscle and liver tissues of both species of fish indicate strong biotransformation. The active ingredient of HCHs (Lindane), namely, the
J isomer is reduced almost to non-detectable level. The major contribution comes from E isomer. Though
J isomer is still detectable (at low concentration) in muscle it is totally absent in liver (Table 2-5).
The composition of chlordane compounds in fish indicates biotransformation as well. The biotransformation products, namely, oxy-chlordane and heptachlor epoxide were detectable in fish muscle and liver of both species (Table 3-6). While these metabolites were detectable in muscle tissue only a few liver samples showed oxy-chlordane. Probably, the metabolites were removed from liver as soon as it was formed and transported to other organs. The overall picture of chlordane composition in fish indicates contamination from technical chlordane that contains
Figure 2. Composition of DDT compounds in Collichthys niveatus andPseudosciaena crocea muscle and liver .
N. Kannan et al. / EnvironmentAsia 3(1) (2010) 20-31
Table 2. Concentration (ng/g lipid) of pesticides and PCBs in Collichthys niveatus muscle
N. Kannan et al. / EnvironmentAsia 3(1) (2010) 20-31
23
Location St.3 St.5 St.6 St.8 St.9 St.13 St.14 St.15 St.17 St.18 St.32
1,2,4,5-tetrachlorobenzene - - - - - - - - - - -
1,2,3,4-tetrachlorobenzene - - - 0.06 - - - - - - -
pentachlorobenzene 0.03 - - - 0.14
Hexachlorobenzene 0.09 - - - 0.37 - 0.80 0.15 - - 0.69
6CBz 0.12 - - 0.06 0.37 - 0.80 0.15 - - 0.83
D-HCH - 1.74 0.52 - - 1.05 0.68 0.40 - 0.47 -
E-HCH 1.25 1.73 1.70 - 2.38 5.71 2.71 3.29 4.57 5.27 1.95
J-HCH (Lindane) - 0.33 0.06 - 0.02 0.20 0.15 0.36 0.32 0.56 0.06
6 HCH 1.74 3.80 2.28 - 2.40 7.12 3.66 4.74 4.89 7.65 2.32
D-chlordane - - 0.47 - 0.39 0.57 0.31 0.16 0.19 - 0.36
J-chlordane 0.01 0.10 0.28 0.25 0.03 - 0.23 - - 0.28 0.05
Oxychlordane 0.02 - 0.05 - - - - - - 0.11 0.07
Heptachlor 0.02 0.17 - - - 0.10 - 0.35 0.16 - 0.07
Heptachlor epoxide - - 0.11 0.16 - - 0.20 - 0.34 - -
trans-nonachlor - - 0.36 0.38 0.58 0.54 0.36 2.82 2.77 0.25 0.62 cis-nonachlor 0.11 0.18 0.18 0.17 - 0.44 0.21 - 0.78 0.13 -
6 Chlordanes 0.17 0.45 1.46 0.96 1.00 1.65 1.31 3.32 4.23 0.76 1.17
Aldrin 0.03 - - 0.14 0.08 - - - - 0.04 0.16
Dieldrin 0.06 - 0.26 - 0.13 0.58 0.26 0.23 - - 0.04
Endrin - - - - - - - - - - -
6 Drins 0.09 - 0.26 0.14 0.21 0.58 0.26 0.23 - 0.04 0.19
Endosulfan (E) - - - - 0.75 - - - 1.04 - 0.65
Mirex - 0.05 - - - - - - 0.06 - -
o,p'-DDE 0.37 9.27 0.79 0.97 0.08 0.67 0.43 0.14 0.26 6.87 0.09 o,p'-DDD - 0.30 0.85 0.46 1.08 0.82 0.64 0.08 0.62 2.77 0.94 o,p'-DDT 0.40 0.51 4.01 2.74 1.00 3.82 2.76 0.40 2.54 0.91 0.82 p,p'-DDE 0.09 0.87 6.25 4.56 4.93 6.72 4.25 0.22 2.68 0.20 6.28 p,p'-DDD 0.13 0.96 2.49 0.38 0.25 2.12 1.69 - - 2.56 0.28 p,p'-DDT 0.33 0.80 8.49 5.35 0.46 6.67 5.39 0.64 3.41 5.59 0.68
6?DDT 1.33 12.71 22.87 14.46 7.80 20.82 15.15 1.47 9.51 18.90 9.08
CB8 0.16 - 0.53 0.72 - 0.59 0.40 - - - 0.10
CB18 - 1.12 - - 1.32 0.58 - 4.31 0.82 4.93 0.06
CB28 - 2.75 - - - - 0.13 - 0.88 - 0.10
CB 29 0.05 - - - 0.23 0.08 0.02 0.64 0.67 - 0.18
CB 44 - 2.00 0.26 0.07 - 0.30 0.12 - - 0.01 -
CB 52 0.03 0.56 0.56 - - 0.60 0.03 - - 0.91 0.05 CB 66 0.07 0.26 0.33 0.29 0.25 0.65 - 0.62 0.32 0.05 0.23
CB87 0.06 0.18 0.19 - 0.16 - 0.11 - 0.74 0.47 0.17
CB101 0.15 - 0.57 1.02 0.35 0.47 0.28 0.08 0.12 0.12 0.41
CB105 0.04 0.25 - - - 0.44 -
CB110 3.83 1.15 0.22 0.23 0.12 0.41 0.30 0.12 3.67 1.03 0.49 CB118 0.09 2.28 0.33 - 0.65 0.13 0.10 1.33 1.51 1.58 0.88
CB128 0.04 0.59 0.10 0.07 0.10 0.29 0.17 - 0.95 0.82 0.20
CB138 0.39 0.27 0.47 0.08 0.84 1.31 - 1.14 0.38 0.52 0.68 CB153 0.09 0.35 0.73 1.03 0.16 1.42 0.69 0.22 1.59 0.19 0.29
CB170 - - - - 0.09 - - 0.70 0.06 - 0.25
CB180 - 0.12 - - - 0.24 -
CB187 0.05 0.06 0.20 0.05 0.11 0.23 0.23 0.24 - 0.22 0.09
CB195 0.57 - - 0.06 0.84 - - - - 0.03 0.89
CB200 0.02 - - - - - - - 0.05 - -
CB206 - - - - - 0.14 0.05 - 0.20 0.01 -
CB209 - - - 0.12 -
6PCB 5.63 11.92 4.49 3.61 5.22 7.20 2.62 9.38 11.95 11.70 5.08 .
Table 3. Concentration (ng/g lipid wt.) of pesticides and PCBs in Collichthys niveatus liver
6
N. Kannan et al. / EnvironmentAsia 3(1) (2010) 20-31
24
Location st.3 st.5 st.6 st.8 st.9 st.13 st.14 st.15 st.16 st.17 st.18 st.32
6
1,2,4,5-tetrachlorobenzene - - -
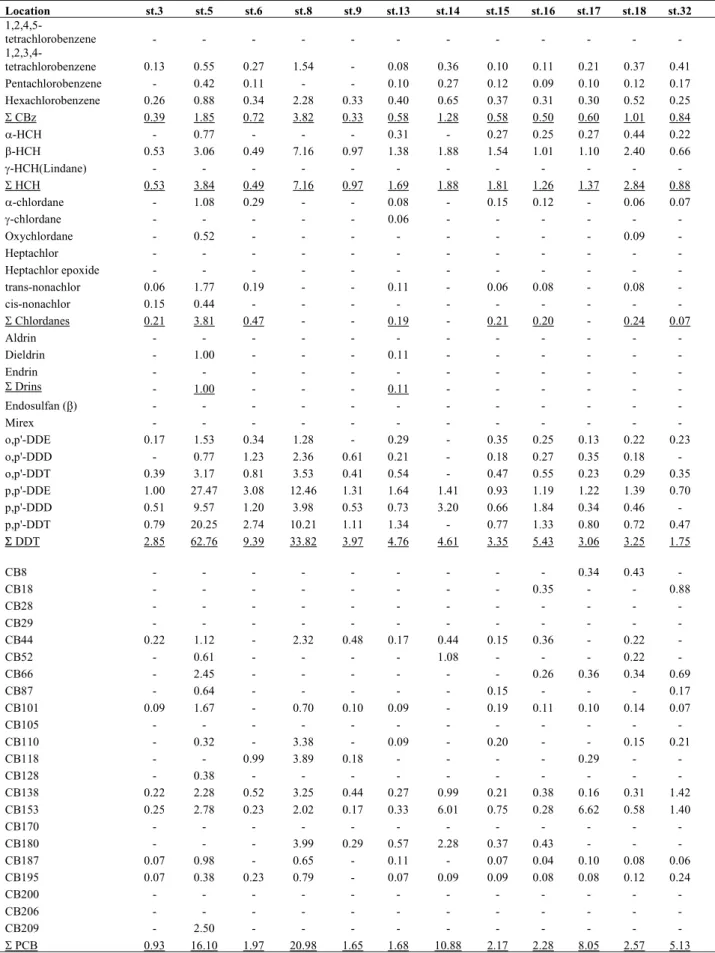
1,2,3,4-tetrachlorobenzene 0.13 0.55 0.27 1.54 - 0.08 0.36 0.10 0.11 0.21 0.37 0.41 Pentachlorobenzene - 0.42 0.11 - - 0.10 0.27 0.12 0.09 0.10 0.12 0.17 Hexachlorobenzene 0.26 0.88 0.34 2.28 0.33 0.40 0.65 0.37 0.31 0.30 0.52 0.25
6 CBz 0.39 1.85 0.72 3.82 0.33 0.58 1.28 0.58 0.50 0.60 1.01 0.84
D-HCH - 0.77 - - - 0.31 - 0.27 0.25 0.27 0.44 0.22
E-HCH 0.53 3.06 0.49 7.16 0.97 1.38 1.88 1.54 1.01 1.10 2.40 0.66
J-HCH(Lindane) - - -
6 HCH 0.53 3.84 0.49 7.16 0.97 1.69 1.88 1.81 1.26 1.37 2.84 0.88
D-chlordane - 1.08 0.29 - - 0.08 - 0.15 0.12 - 0.06 0.07
J-chlordane - - - 0.06 - - -
Oxychlordane - 0.52 - - - - - - - - 0.09 -
Heptachlor - - -
Heptachlor epoxide - - -
trans-nonachlor 0.06 1.77 0.19 - - 0.11 - 0.06 0.08 - 0.08 -
cis-nonachlor 0.15 0.44 - - - - - - - -
6 Chlordanes 0.21 3.81 0.47 - - 0.19 - 0.21 0.20 - 0.24 0.07
Aldrin - - -
Dieldrin - 1.00 - - - 0.11 - - - -
Endrin - - -
6 Drins - 1.00 - - - 0.11 - - - -
Endosulfan (E) - - -
Mirex - - -
o,p'-DDE 0.17 1.53 0.34 1.28 - 0.29 - 0.35 0.25 0.13 0.22 0.23 o,p'-DDD - 0.77 1.23 2.36 0.61 0.21 - 0.18 0.27 0.35 0.18 - o,p'-DDT 0.39 3.17 0.81 3.53 0.41 0.54 - 0.47 0.55 0.23 0.29 0.35 p,p'-DDE 1.00 27.47 3.08 12.46 1.31 1.64 1.41 0.93 1.19 1.22 1.39 0.70 p,p'-DDD 0.51 9.57 1.20 3.98 0.53 0.73 3.20 0.66 1.84 0.34 0.46 - p,p'-DDT 0.79 20.25 2.74 10.21 1.11 1.34 - 0.77 1.33 0.80 0.72 0.47
6 DDT 2.85 62.76 9.39 33.82 3.97 4.76 4.61 3.35 5.43 3.06 3.25 1.75
CB8 - - - 0.34 0.43 -
CB18 - - - 0.35 - - 0.88
CB28 - - -
CB29 - - -
CB44 0.22 1.12 - 2.32 0.48 0.17 0.44 0.15 0.36 - 0.22 -
CB52 - 0.61 - - - - 1.08 - - - 0.22 -
CB66 - 2.45 - - - 0.26 0.36 0.34 0.69
CB87 - 0.64 - - - - - 0.15 - - - 0.17
CB101 0.09 1.67 - 0.70 0.10 0.09 - 0.19 0.11 0.10 0.14 0.07
CB105 - - -
CB110 - 0.32 - 3.38 - 0.09 - 0.20 - - 0.15 0.21
CB118 - - 0.99 3.89 0.18 - - - - 0.29 - -
CB128 - 0.38 - - - - - - - -
CB138 0.22 2.28 0.52 3.25 0.44 0.27 0.99 0.21 0.38 0.16 0.31 1.42 CB153 0.25 2.78 0.23 2.02 0.17 0.33 6.01 0.75 0.28 6.62 0.58 1.40
CB170 - - -
CB180 - - - 3.99 0.29 0.57 2.28 0.37 0.43 - - -
CB187 0.07 0.98 - 0.65 - 0.11 - 0.07 0.04 0.10 0.08 0.06 CB195 0.07 0.38 0.23 0.79 - 0.07 0.09 0.09 0.08 0.08 0.12 0.24
CB200 - - -
CB206 - - -
CB209 - 2.50 - - - - - - - -
6 PCB 0.93 16.10 1.97 20.98 1.65 1.68 10.88 2.17 2.28 8.05 2.57 5.13 .
6
Table 4. Concentration (ng/g lipid) of pesticides and PCBs in Pseudosciaena crocea muscle
N. Kannan e
t al
. /
E
nv
ir
onm
ent
A
si
a 3(1) (2010) 20-31
25
Location St.5 St.6 St.8 St.9 St.13 St.14 St.15 St.16 St.17 St.18 St.19 St.20 St.21 St.25
1,2,4,5-tetrachlorobenzene - - - 0.064 - -
1,2,3,4-tetrachlorobenzene - 0.047 - - - 0.014 0.013 0.012 - 0.086 0.009 - 0.010 0.010
Pentachlorobenzene 0.004 - 0.003 0.007 - - - - 0.007 - - - 0.010 -
Hexachlorobenzene - - 0.043 - - -
6 CBz 0.004 0.047 0.046 0.007 - 0.014 0.013 0.012 0.007 0.086 0.009 0.064 0.020 0.010
D-HCH 0.017 - 0.016 - 0.035 0.013 0.057 - - -
E-HCH 0.040 - 0.035 0.013 0.038 0.313 1.073 - - 0.078 0.043 0.078 0.014 0.069 J-HCH(Lindane) 0.001 0.018 - - - - - - 0.063 1.123 0.490 0.512 0.080 0.394 6 HCH 0.058 0.018 0.050 0.013 0.073 0.326 1.130 - 0.063 1.201 0.533 0.590 0.094 0.463 D-chlordane 0.023 - 0.014 0.022 0.019 - - - 0.063 1.303 0.559 0.614 0.096 0.472
J-chlordane 0.004 0.092 0.009 0.013 0.013 0.008 0.030 - - - - - - -
Oxychlordane 0.009 0.056 0.005 0.017 0.006 0.006 - 0.047 0.012 0.043 - 0.028 0.013 0.064
Heptachlor - - - 0.013 0.005 0.020 0.008 0.029 - - 0.017 0.035
Heptachlor-epoxide 0.015 - 0.008 0.007 - - - 0.108 0.039 0.081 - 0.028 0.068 0.149 trans-nonachlor 0.043 - 0.016 0.023 0.020 0.016 0.067 - - 0.019 0.007 - - -
cis-nonachlor 0.024 0.102 0.008 0.012 - - 0.155 - - - 0.068
6Chlordanes 0.118 0.250 0.059 0.095 0.058 0.044 0.257 0.175 0.122 1.474 0.566 0.671 0.193 0.788
Aldrin - - - 0.006 0.015 0.033 - - - - 0.007 0.041
Dieldrin - - 0.010 0.010 - - - 0.104 0.026 0.058 0.007 0.055 0.043 0.227
Endrin - - - 0.033 - - - -
6Drins - - 0.010 0.010 - 0.006 0.015 0.137 0.026 0.091 0.007 0.055 0.050 0.268
Endosulfan (E) - - - 0.032 - - -
Mirex 0.009 - - 0.012 - 0.002 - - - 0.033 0.015 - 0.040 0.060
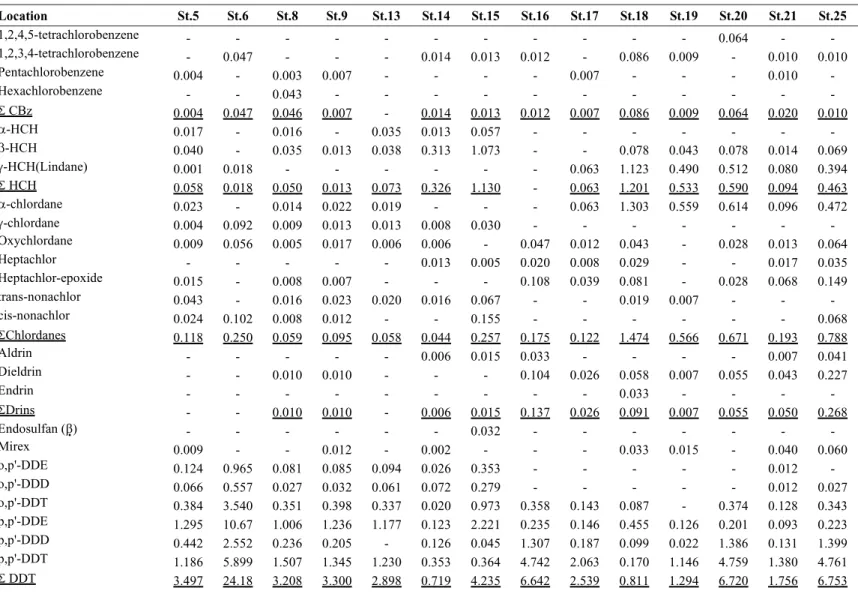
o,p'-DDE 0.124 0.965 0.081 0.085 0.094 0.026 0.353 - - - - - 0.012 - o,p'-DDD 0.066 0.557 0.027 0.032 0.061 0.072 0.279 - - - - - 0.012 0.027 o,p'-DDT 0.384 3.540 0.351 0.398 0.337 0.020 0.973 0.358 0.143 0.087 - 0.374 0.128 0.343 p,p'-DDE 1.295 10.67 1.006 1.236 1.177 0.123 2.221 0.235 0.146 0.455 0.126 0.201 0.093 0.223 p,p'-DDD 0.442 2.552 0.236 0.205 - 0.126 0.045 1.307 0.187 0.099 0.022 1.386 0.131 1.399 p,p'-DDT 1.186 5.899 1.507 1.345 1.230 0.353 0.364 4.742 2.063 0.170 1.146 4.759 1.380 4.761 6 DDT 3.497 24.18 3.208 3.300 2.898 0.719 4.235 6.642 2.539 0.811 1.294 6.720 1.756 6.753
Table 4. Concentration (ng/g lipid) of pesticides and PCBs in Pseudosciaena crocea muscle (continued)
N. Kannan e
t al
. /
E
nv
ir
onm
ent
A
si
a 3(1) (2010) 20-31
26
Location St.5 St.6 St.8 St.9 St.13 St.14 St.15 St.16 St.17 St.18 St.19 St.20 St.21 St.25
CB8 - 0.18 - - - 0.093 - - - 0.006 0.037 0.092
CB18 - - 0.004 - 0.007 0.022 0.019 - - 0.128 - - - -
CB28 - - 0.008 - 0.015 0.021 - - 0.01 0.003 0.012 - 0.009 -
CB29 0.006 - - - - 0.005 - - - 0.438 0.014 - - -
CB44 0.012 0.094 - 0.007 - 0.004 - 0.07 0.045 0.045 0.009 - 0.029 0.057
CB52 0.043 0.126 0.023 0.018 0.028 0.02 0.027 0.048 0.025 - - 0.029 0.015 0.093
CB66 - 0.179 - - - 0.014 - 0.057 0.022 0.044 0.011 0.05 0.03 -
CB87 0.021 - 0.011 - 0.022 0.033 - - 0.046 - - 0.002 0.017 0.046
CB101 0.049 0.264 0.023 0.031 - 0.849 0.074 0.087 0.041 0.027 0.063 0.1 0.033 0.116
CB105 - - 0.005 - 0.006 - - -
CB110 0.036 0.129 0.036 0.022 - 0.021 0.072 0.059 0.038 0.034 0.035 0.118 0.023 0.074
CB118 - 0.221 0.053 0.028 0.066 0.017 0.161 0.09 - 0.122 0.041 0.119 - 0.102
CB128 - 0.049 - 0.008 0.134 - - 0.035 0.033 0.274 - - 0.027 0.05
CB138 0.058 0.42 0.047 0.047 - 0.009 - 0.157 - 0.109 0.038 0.209 0.051 0.181
CB153 0.083 0.59 0.01 0.075 0.014 0.025 0.006 0.214 0.089 0.082 0.064 0.288 0.067 0.287
CB170 - - 0.003 - - 0.003 - 0 - 0.139 - - - -
CB180 - - - 0.076 - 0.014 - - - - 0.127 0.248 0.117 -
CB187 0.018 0.131 - 0.019 0.021 0.012 0.01 0.05 0.049 0.124 0.004 0.033 0.036 0.063
CB195 - 0.038 0.007 0.005 - 0.006 - 0.014 - - - - 0.003 -
CB200 - - 0.276 - 0.311 1.092 0.369 - - 0.015 - - - -
CB206 - - - 0.007 - 0.028 - - - -
CB209 0.02 - - 0.068 - - - 0.067 - 0.048 0.034 0.082
6PCB 0.347 17.3 0.507 0.405 0.622 2.166 0.739 0.98 0.398 1.681 0.418 1.249 0.527 1.241
6
6
6
6
6
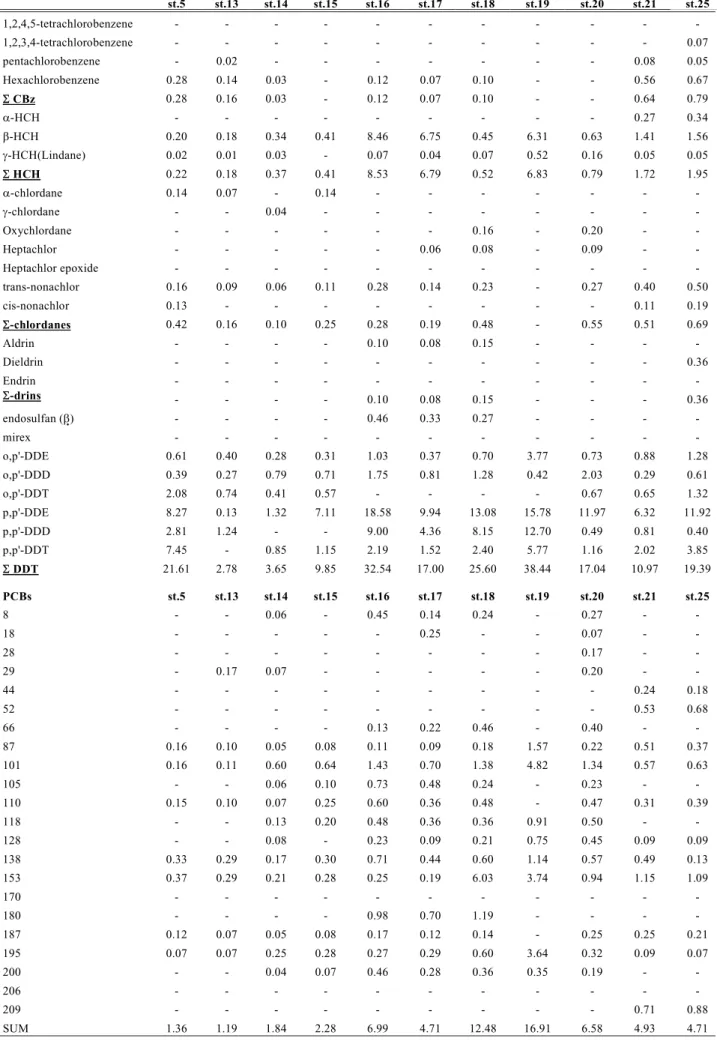
Table 5. Concentration (ng/g lipid) of pesticides and PCBs in Pseudosciaena crocea liver
N. Kannan et al. / EnvironmentAsia 3(1) (2010) 20-31
27
st.5 st.13 st.14 st.15 st.16 st.17 st.18 st.19 st.20 st.21 st.25
6
6
6
6
6
1,2,4,5-tetrachlorobenzene - - - - - - - 1,2,3,4-tetrachlorobenzene - - - - - - - 0.07
pentachlorobenzene - 0.02 - - - 0.08 0.05
Hexachlorobenzene 0.28 0.14 0.03 - 0.12 0.07 0.10 - - 0.56 0.67
6 CBz 0.28 0.16 0.03 - 0.12 0.07 0.10 - - 0.64 0.79
D-HCH - - - - - - - 0.27 0.34
E-HCH 0.20 0.18 0.34 0.41 8.46 6.75 0.45 6.31 0.63 1.41 1.56
J-HCH(Lindane) 0.02 0.01 0.03 - 0.07 0.04 0.07 0.52 0.16 0.05 0.05
6 HCH 0.22 0.18 0.37 0.41 8.53 6.79 0.52 6.83 0.79 1.72 1.95
D-chlordane 0.14 0.07 - 0.14 - - - -
J-chlordane - - 0.04 - - - - - - - -
Oxychlordane - - - - - - 0.16 - 0.20 - -
Heptachlor - - - - - 0.06 0.08 - 0.09 - -
Heptachlor epoxide - - - - - - -
trans-nonachlor 0.16 0.09 0.06 0.11 0.28 0.14 0.23 - 0.27 0.40 0.50
cis-nonachlor 0.13 - - - - - - 0.11 0.19
6-chlordanes 0.42 0.16 0.10 0.25 0.28 0.19 0.48 - 0.55 0.51 0.69
Aldrin - - - - 0.10 0.08 0.15 - - - -
Dieldrin - - - - - - - 0.36
Endrin - - - - - - -
6-drins - - - - 0.10 0.08 0.15 - - - 0.36
endosulfan (E) - - - - 0.46 0.33 0.27 - - - -
mirex - - - - - - -
o,p'-DDE 0.61 0.40 0.28 0.31 1.03 0.37 0.70 3.77 0.73 0.88 1.28 o,p'-DDD 0.39 0.27 0.79 0.71 1.75 0.81 1.28 0.42 2.03 0.29 0.61
o,p'-DDT 2.08 0.74 0.41 0.57 - - - - 0.67 0.65 1.32
p,p'-DDE 8.27 0.13 1.32 7.11 18.58 9.94 13.08 15.78 11.97 6.32 11.92 p,p'-DDD 2.81 1.24 - - 9.00 4.36 8.15 12.70 0.49 0.81 0.40 p,p'-DDT 7.45 - 0.85 1.15 2.19 1.52 2.40 5.77 1.16 2.02 3.85
6 DDT 21.61 2.78 3.65 9.85 32.54 17.00 25.60 38.44 17.04 10.97 19.39
PCBs st.5 st.13 st.14 st.15 st.16 st.17 st.18 st.19 st.20 st.21 st.25
8 - - 0.06 - 0.45 0.14 0.24 - 0.27 - -
18 - - - - - 0.25 - - 0.07 - -
28 - - - - - - - - 0.17 - -
29 - 0.17 0.07 - - - - - 0.20 - -
44 - - - - - - - 0.24 0.18
52 - - - - - - - 0.53 0.68
66 - - - - 0.13 0.22 0.46 - 0.40 - -
87 0.16 0.10 0.05 0.08 0.11 0.09 0.18 1.57 0.22 0.51 0.37
101 0.16 0.11 0.60 0.64 1.43 0.70 1.38 4.82 1.34 0.57 0.63
105 - - 0.06 0.10 0.73 0.48 0.24 - 0.23 - -
110 0.15 0.10 0.07 0.25 0.60 0.36 0.48 - 0.47 0.31 0.39
118 - - 0.13 0.20 0.48 0.36 0.36 0.91 0.50 - -
128 - - 0.08 - 0.23 0.09 0.21 0.75 0.45 0.09 0.09
138 0.33 0.29 0.17 0.30 0.71 0.44 0.60 1.14 0.57 0.49 0.13
153 0.37 0.29 0.21 0.28 0.25 0.19 6.03 3.74 0.94 1.15 1.09
170 - - - - - - -
180 - - - - 0.98 0.70 1.19 - - - -
187 0.12 0.07 0.05 0.08 0.17 0.12 0.14 - 0.25 0.25 0.21
195 0.07 0.07 0.25 0.28 0.27 0.29 0.60 3.64 0.32 0.09 0.07
200 - - 0.04 0.07 0.46 0.28 0.36 0.35 0.19 - -
206 - - - - - - -
209 - - - - - - - 0.71 0.88
SUM 1.36 1.19 1.84 2.28 6.99 4.71 12.48 16.91 6.58 4.93 4.71 .
6
6
6
6
6
n=12 G I G II G III G IV
N. Kannan et al. / EnvironmentAsia 3(1) (2010) 20-31
28 cis- and trans-chlordane, trans-nonachlor, and heptachlor. Heptachlor, a separate pesticide, is unlikely to be a major source of contamination to fish.
Apart from these pesticides, aldrin, dieldrin, endrin, endosulfan (E, mirex were also determined in fish tissues. However, the occurrence of these chemicals was limited to a few stations.
Concentration (ng/g lipid) of 22 individual PCB congeners and their sum in muscle and liver tissues of C. niveatus and P. crocea are given in Table 2 to 5. The sum of PCBs in C. niveatus muscle is higher than in P. crocea muscle. The fat content of C.niveatus muscle is several fold higher than P. crocea and this correlates to the PCB concentration in that tissue (correlation co-efficient=0.61). In the species P. crocea the content of PCBs was several folds higher in the liver than in the muscle. A good correlation between PCB uptake by this species and the fat content of the tissues was observed (correlation co-efficient=0.75). Thus, it is very clear that the PCB accumulation in YSLME fish is fat dependent (lipophilic) and the fat content of the fish determines the PCB accumulation. Hence, the PCB content in this communication is lipid normalized, though it is not uncommon in Korean publications to see PCB concentrations on wet or dry weight basis.
Congener specific PCB composition in such complex data set can be compared only with data reduction. This was carried out using the Principle Component Analysis (PCA) using SIMCA. The content (ng/g lipid) was normalized to molar % of the sum CBs and SIMCA analysis was carried out. The loadings and scores of two principle factors were derived and plotted. The score plots reveal the similarity or differences between the congener patterns in the data set. Such a plot for muscle tissue in both fish species is presented in Fig. 3. PCA identifies several congeners that determine the distribution pattern. These congeners are CB101, 110, 118, -138 and -153. In addition, congeners 8 and 18 in C. niveatus is enriched and CB-200 in P.crocea.
On the other hand, loadings of PCA reveal ‘hot spots’ or other distinguishing features in the data matrix. The loadings of two principle factors thus derived for muscle tissue in both species of fish are plotted in Fig. 4. It is possible to distinguish northern and southern sectors in the plot. The northern sector is close to Korean peninsula and thus close to industrialized coastal zone. The southern sector is close to Jeju Island and to open sea. Jeju Island is a touristic place with limited industrial significance. Most of the Korean heavy industries are on the peninsular coastline and inland. PCA identifies stations that are close to the principle off shore dumpsite of Korea in Yellow Sea. Recent analysis of water samples for phenolic pollutants in that region showed elevated concentrations as well (data not shown).
3.1. Metabolism
The investigation of metabolism in organisms is facilitated by a classification of CBs on the basis of structure-activity-relations (Boon et al., 1992; Kannan et al., 1995; Bruhn et al., 1995). The criteria are the presence or absence of vicinal hydrogen atoms in meta, para and/or ortho, meta positions as well as the number of ortho-Cls. These structural characteristics determine whether a molecule can be metabolized by the cytochrome P450IA and/or IIB isozymes. The CBs are grouped as follows: Group I: Congeners with vic. Hs in m,p or o,m positions. These molecules are considered to be easily metabolizable. Group II: Congeners with vic. Hs in m,p positions. These are metabolized by PB-type P450 isozymes. Group III: Congeners with vic. Hs in o,m positions. They are metabolized by MC-type P450 isozymes. Group IV: congeners with no vic. Hs in m,p oro,m positions. These molecules are considered to be persistent.
Though metabolic transformation index of PCBs and other chemicals were developed based on mammalian studies, several studies indicate that Cytochrome P-450 enzyme induction is prevalent in Table 6. Average value of CB X/153 noticed in the liver of croakers in four metabolic groups (see the text for explanation).
a) Pseudosciaena crocea
Average 0.24 0.94 0.45 0.36
STD Div 0.23 0.87 0.56 0.47
b) Collichthys niveatus
n=12 G I G II G III G IV
Average 0.15 0.11 0.60 0.13
fish living in contaminated waters (Stein et al., 1995; Whiteet al., 1997; Schlezinger and Stegeman, 2000; Doiet al., 2000; Jung et al., 2006).
The metabolic status of a congener can be understood from its relationship to the sum of all congeners measured or with reference to the most persistent congener. CB-153 (2,2,4,4',5,5'-hexaCB) is an ideal candidate (biomarker) as it occurs often at the highest concentrations in biota and particles. The X/153 ratios for CB congeners determined in the liver tissue of croakers, the priciple organ of drug metabolism, are presented in Table 6. As expected, the X/153 ratio of Group I congeners are very low in both species indicating efficient metabolism. Low ratios in Group II and III indicate induction of Cytochrome IIb and IA isozymes in the fish. Accordingly, Collichthys niveatus shows induction of P450 IIb enzymes whereas Pseudosciaena crocea shows
Figure 4. Principle component analysis of PCB congeners (based on molar % of individual congener to the total) in Yellow Sea fishes. The loadings of factor 1 and 2.
induction of P4501A enzymes. This fact can be derived from their pesticide metabolism as well. For example, DDT, DDE, and DDD are inducers of cytochrome P450 IIB proteins and, to a lesser extent, cytochrome P450 IIIA proteins, but not cytochrome P450 1A proteins (ATSDR, 2004). But, hexachlorobenzene induces a wide range of hepatic cytochrome P450 enzymes including those in the CYPIIIA family (“Phenobarbital inducible”) and the CYP1A1/2 family (“3-methylcholanthrene-inducible”) (Linko et al., 1986; Li et al., 1989). All these potential inducers are determined in the Yellow Sea fish. The composition of pesticides and PCBs in Yellow Sea croakers suggests ecotoxicological stress in these species, as the induction of these enzymes causes other deleterious effects to the organism such as reproductive failure etc. Several fish studies using bottom living flounder (Paralichthys olivaceous) in our laboratory indicated that fish living Figure 3. Principle component analysis of PCB congeners (based on molar % of individual congener to the total) in Yellow Sea fishes. Score plot of factor 1 and 2.
N. Kannan et al. / EnvironmentAsia 3(1) (2010) 20-31
in contaminated waters have high induction of CYP1A enzymes compared to those living in clean waters (Junget al., 2008).
3.2. Levels of Persistent Contaminants: a global comparison
It is difficult to obtain global data on all the groups of compounds mentioned in this report for comparison and hence only the popularly monitored compounds such as PCBs, HCHs, and DDTs are compared here. Additionally, data on Yellow Sea fish is almost negligible. The levels of PCBs in Yellow Sea fish can be compared to levels in the Baltic herring (Atuma et al., 1996). This is true for HCHs, DDTs and HCB as well.
The concentration of POPs in Yellow Sea indicates levels that are far below the levels reported in North Sea (Weber and Goerke 1996) and in the USA (Bilger et al., 1999). It is important to mention that this survey covers only the off-shore waters of Korea and an extensive survey in the Yellow Sea covering Chinese waters may reveal a different picture altogether. This survey identified spots in the off shore coast of Korea, especially the ones close to dump sites, that need further monitoring in the future.
Acknowledgement
This study has been supported by the Ministry of Environment as a part of Eco-Technopia-21 Project (PN533-00). As a visiting scientist at KORDI, N.Kannan is supported by Korea Research Foundation grant (MOEHRD) (KRF-2006-210-C00008).
References
Atuma SS, Linder C-E, Wicklund-Gtynn A, Andersson O, Larsson L. Survey of consumption fish from Swedish waters for chlorinated pesticides and polychlorinated biphenyls. Chemosphere 1996; 33: 791-99.
Bilger MD, Brightbill RA, Campbell HL. Occurrence of organochlorine compounds in whole fish tissue from streams of the lower Susquehanna River basin, Pennsylvania and Maryland, 1992. Water-Resources Investigations Report 99-4065 U.S. Geological Survey Branch of Information Services, Box 25286, Denver, Colorado 80225-0286, USA. 1999; 1-23.
Boon JP, van Arnhem E, Jansen S, Kannan N, Petrick G, Schulz D, Duinker JC, Reijnders PJH, Goksoeyr A. The toxicokinetics of PCBs in marine mammals with special reference to possible interactions of individual congeners with the cytochrome P-450 dependent monooxygenase system - an overview. In: Persistent pollutants in marine ecosystems (Eds: Walker CH, Livingstone DR). Pergamon Press, Oxford. 1992; 119-59.
Bruhn R, Kannan N, Petrick G, Schulz-Bull DE, Duinker JC. CB pattern in the harbour porpoise: Bioaccumulation, metabolism and evidence for Cytochrome P450 IIB activity. Chemosphere 1995; 31, 3721-32.
Doi AM, Lou Z, Holmes E, Li C-LJ, Venugopal CS, James MO, Kleinow KM. Effect of micelle fatty acid composition and 3,4,3',4'-tetrachlorobiphenyl (TCB) exposure of intestinal [14C]-TCB bioavailability and biotransformation in channel catfish in situ prepararations. Toxicological Sciences 2000; 55: 85-96. Hong SH, Yim UH, Shim WJ, Oh JR, Lee IS. Horizontal and vertical distribution of PCBs and chlorinated pesticides in sediments from Masan Bay, Korea. Marine Pollutution Bulletin 2003; 46: 244-53.
Jung JH, Yim UH, Jeon JK, Lee JS, Kim DJ, Han CH, Shim WJ. Induction and inhibition of CYP1A gene expression and steroidgenesis in olive flounder Paralichthys olivaceus exposed to Tributyltin and Benzo[a]pyrene. Journal of Fisheries Science and Technology 2006; 9: 64-69.
Jung JH, Kim SJ, Lee TK, ShimWJ. Biomarker responses in caged rockfish (Sebastes schlegeli) from Masan Bay and Haegeumgang, South Korea. Marine Pollution Bulletin 2008; 57: 599–606.
Kannan N, Reusch TBH, Schulz-Bull DE, Petrick G, Duinker JC. Chlorobiphenyls: Model compounds for metabolism in food chain organisms and their potential use as ecotoxicological stress indicators by application of the metabolic slope concept. Environmental Science and Technology 1995; 29: 1851-959.
Lauenstein GG, Cantillo AY. National Benthic Surveillance and Mussel Watch Projects, Sampling and Analytical Methods of the National Status and Trends Program, 1984-1992, Vol. 4. NOAA Tech. Memo. NOS ORCA 1993; 71.
Lauenstein GG, Cantillo AY. Sampling and Analytical Methods of the National Status and Trends Program Mussel Watch Project: 1993-1996 Update. NOAA Tech. Memo NOS ORCA 1998; 130.
Li SMA, Denomme MA, Leece B. Hexachlorobenzene: Biochemical effects and synergistic toxic interactions with 2,3,7,8-tetrachlorodibenzo-p-dioxin. Toxicological and Environmental Chemistry 1989; 22: 215–27. Linko P, Yeowell HN, Gasiewicz TA, Goldstein JA. Induction
of cytochrome P-450 isozymes by hexachlorobenzene in rats and aromatic hydrocarbon Ah-responsive mice. Journal of Biochemical Toxicology 1986; 12: 95–107. Oh JR, Choi HK, Hong SH, Yim UH, Shim, WJ, Kannan N. A
preliminary report of persistent organochlorine pollutants in the Yellow Sea. Marine Pollution Bulletin, 2005; 50: 217-22.
Schlezinger JJ, Stegeman JJ. Dose and Inducer-Dependent Induction of Cytochrome P450 1A in Endothelia of the Eel, including in the Swimbladder Rete Mirabile, a Model Microvascular Structure. Drug Metabolism and Disposition 2000; 28: 701-08.
She J. Monitoring and researches on pollution/environment and their ecological effects in YSLME Yellow Sea Large Marine Ecosystem. Journal of Oceanography of Huanghai and Bohai Seas 1993; 11: 61-69.
N. Kannan et al. / EnvironmentAsia 3(1) (2010) 20-31
Sloan CA, Adams NG, Pearce RW, Brown DW, Chan SL. NOAA Technical Memorandum, Northwest fisheries science center organic analytical procedures. NOS ORCA 71: 53-97, NOAA, Mayland, USA, 1993. Stein JE, Hom T, Collier TK, Brown DW, Varanasi U.
Contaminant exposure and biochemical effects in outmigrant juvenile chinook salmon from urban and nonurban estuaries of Puget Sound, Washington. Environmental Toxicology and Chemistry 1995; 14: 1019-29.
Weber K, Goerke, H. Organochlorine compounds in fish off the Antarctic Peninsula. Chemosphere 1996; 33: 377-92.
White RD, Shea D, Stegeman JJ. Metabolism of the Aryl Hydrocarbon Receptor Agonist 3,3,4,4-Tetrachlorobiphenyl by the Marine Fish Scup (Stenotomus chrysops) In Vivo and In Vitro. Drug Metabolism and Disposition 1997; 25: 564-72. Young RG, John LS, Lisk DJ. Degradation of DDT by
goldfish. Bulletin of Environment Contamination and Toxicology 1971; 6: 351-54.
Received 29 December 2009 Accepted 5 February 2010
Correspondence to
Dr. Won Joon Shim South Sea Institute,
Korea Ocean Research and Development Institute, 391 Jangmok-ri, Jangmok-myon,
Geoje 656830, Republic of Korea Tel: +82 55 639 8671 Fax: +82 55 639 8689 E-mail: [email protected]
N. Kannan et al. / EnvironmentAsia 3(1) (2010) 20-31