LONGITUDINAL PROCESSES IN
SALTO GRANDE RESERVOIR (AMERICANA, SP, BRAZIL)
AND ITS INFLUENCE IN THE FORMATION
OF COMPARTMENT SYSTEM
ZANATA, L. H. and ESPÍNDOLA, E. L. G.
CRHEA, EESC, USP, Av. Trabalhador Sancarlense, no 400, C.P. 292, CEP 13560-970, São Carlos, SP, Brazil
Correspondence to: Lucí Helena Zanata, CRHEA, EESC, USP, Av. Trabalhador Sancarlense, no 400,
C.P. 292, CEP 13560-970, São Carlos, SP, Brazil, e-mail: [email protected] Received July 6, 2001 – Accepted August 17, 2001 – Distributed May 31, 2002
(With 5 figures)
ABSTRACT
Studies on the longitudinal processes in reservoirs, involving physical, chemical and biological processes have been thoroughly appraised, suggesting the existence of a longitudinal organization controlled by the entrance and circulation of water which inserts modifications in the structuring of the system. To evaluate this effect, the Salto Grande reservoir (Americana, SP) was analyzed in 11 sampling stations in its longitudinal axis, in the rainy and dry seasons of 1997 considering the physical chemical and biological variables. Analyzing the results in agreement with the declining concentration degree of the river–barrage direction, a more significant correlation was verified in the dry period for total phos-phorus (r2 = 0.86), dissolved total phosphate (r2 = 0.83), nitrite (r2 = 0.93), inorganic phosphate (r2 = 0.89), ammonium (r2 = 0.84) and suspended material (r2 = 0.85). In the rainy period, only nitrite (r2 = 0.90) and conductivity (r2 = 0.89) presented correlation with the distance of the dam, which demonstrates the effects of precipitation and the operational mechanism of the dam, as well as the distinction among the physical (sedimentation), chemical (oxidation) and biological (decomposition) processes in spatial heterogeneity of the system. These factors were decisive in the organization of these communities, with higher occurrence of rotifers and copepods in relation to cladocerans, the first ones being more abundant in the entrance of the Atibaia river, decreasing towards the dam direction, while copepods presented an inverse pattern. A distribution pattern similar to Copepoda was also verified for the Cladocera, evidencing a tendency to increase the density of organisms in the stations distant to the entrance of the Atibaia river, not being registered, however, a distribution gradient in the longitudinal axis, as observed for rotifers and copepods. In relation to the trophic degree a longitudinal gradient was also verified from eutrophic to oligotrophic depending on the location of the sampling station in relation to the longitudinal axis and period of analysis. The differences obtained, relating to the distribution of the environmental variables, demonstrate a characteristic pattern for reservoirs, with a longitudinal gradient in the sense river–barrage that inserts changes in the physical and chemical composition of the water, contributing to the differentiated establishing of biological communities.
Key words: reservoirs, longitudinal gradients, formation of compartment.
RESUMO
Processos longitudinais no reservatório de Salto Grande (Americana, SP) e sua influência na formação de compartimentos do sistema
va-riáveis físicas, químicas e biológicas. Analisando-se os resultados de acordo com o grau de decaimento das concentrações no sentido rio–barragem, verificou-se correlação mais significativa no período seco do que no chuvoso para fósforo total (r2 = 0,86), fosfato total dissolvido (r2 = 0,83), nitrito (r2 = 0,93), fosfato inorgânico (r2 = 0,89), amônio (r2 = 0,84) e material em suspensão (r2 = 0,85). No período chu-voso, apenas nitrito (r2 = 0,90) e condutividade (r2 = 0,89) apresentaram correlação com a distância da barragem, o que demonstra o efeito da precipitação e do mecanismo operacional da barragem, bem como a distinção entre os processos físicos (sedimentação), químicos (oxidação) e biológicos (decomposição) na heterogeneidade espacial do sistema. Esses fatores foram determinantes na orga-nização das comunidades, com maior abundância de rotíferos e copépodos em relação aos cladóceros, sendo os primeiros mais abundantes na entrada do rio Atibaia, decrescendo em direção à barragem, enquanto copépodos apresentaram padrão inverso. Padrão de distribuição semelhante aos copépodos também foi verificado para os cladóceros, evidenciando tendência ao aumento da densidade de organismos nas estações distantes da entrada do rio Atibaia, não sendo registrado, porém, gradiente de distribuição no eixo longitudinal, como observado para rotíferos e copépodos. Em relação ao grau de trofia também se verificou gradiente longitudinal de eutrófico a oligotrófico, dependendo da localização da estação de amostragem em relação ao eixo longitudinal e período analisado. As diferenças obtidas quanto à distribuição das variáveis ambientais demonstram um padrão característico para reservatórios, com gradiente longitudinal no sentido rio–barragem que insere modificações na composição física e química da água, contribuindo para o estabelecimento diferenciado das comunidades biológicas.
Palavras-chave: reservatórios, gradiente longitudinal, formação de compartimentos.
INTRODUCTION
Artificial reservoirs are distinguished from other natural aquatic ecosystems because of ope-ration mechanisms that alter the conditions of the setting, which together with functions of natural forces, cause the heterogeneous distribution of the organisms in the environment (Tundisi, 1988; Straskraba et al., 1993). In this system, the water
time of residence and material contribution input a longitudinal zonation usually associated with the increase of particulate material sedimentation in the river–barrage direction (Thomaz et al., 1997),
where each compartment will constitute a section along the longitudinal axis (lotic, transition and lentic) with differentiated characteristics, where the degree of space heterogeneity is influenced by morphometry, flow and stratification conditions, the hydrodynamic conditions are the main causes of the horizontal variability in most of the reservoirs (Straskraba & Tundisi, 1999).
Studies developed by Armengol et al. (1999)
and Zanata (1999) suggest the existence of a lon-gitudinal organization in reservoirs controlled by water circulation, which is related to the physical and chemical characteristics and to the biotic com-munities of the system. This spatial and tempo-ral heterogeneity in the environmental conditions is a decisive factor in the continuous organization process of the communities in the aquatic
envi-ronment (Espíndola, 1994), causing the diversity of habitats, which is considered fundamental for the occurrence of biological diversity (Tundisi et al., 1988).
Considering the importance of water resources, the present study seeks to characterize the physical, chemical and biological processes in the longitudinal axis of the Salto Grande reservoir (Americana, SP), during two seasons of the year (summer and winter), which influence the ecology of the system.
STUDY AREA
This work was developed in the Salto Grande reservoir, located in the eastern-central area of the State of São Paulo, in the municipal district of Americana, in the coordinates 22o44'S and 47o20'W, at 530 meters of altitude and inserted in the hydro-graphic basin of the Atibaia river (one of the tribu-taries of the Piracicaba river, in the headboard area of the upper basin of the Paraná river), which covers an area of 2,724 km2. The reservoir area is 11.5 km2, with a 64 km perimeter, 17 km of length, maximum volume of 106 × 106 m3, ma-ximum depth of 9 m and a 30-day average water time of residence.
industrial effluents from the cities of Paulínia and Campinas. Moreover, it receives significant contri-bution of organic load from small rivers and streams that receive sanitary sewers without treatment from other cities (Rocha, 1972; Carvalho, 1979; Shimizu, 1981), as well as the material contribution from agricultural activities.
MATERIAL AND METHODS
To evaluate the longitudinal processes in the reservoir of Salto Grande, 11 collection stations were horizontally distributed in the dam, taking into consideration mainly the longitudinal axis in direction to the entrance of the Atibaia river, main affluent towards the dam. The collecting was carried out on February 14 (higher temperature and higher precipitation) and June 30, 1997 (lower temperature and lower precipitation).
Samples were collected integrating the water column with a suction pump for analysis of phy-sical, chemical and biological parameters, as well as suspended material (Teixeira et al., 1965; Tundisi,
1969), chlorophyll-a (Nusch, 1980) plus total and dissolved nutrients (Golterman et al., 1978; Standard
Methods, 1995; Koroleff, 1976; Mackereth et al.,
1978), conductivity, temperature and dissolved oxygen analysis were made through a HORIBA-U10 field meter, in all the collection stations. Water transparency analysis was accomplished by means of a Secchi disc, through which the limit of the euphotic zone was obtained (Cole, 1975). The obtained results were used for determination of the trophic state of the system in agreement with methodology of Toledo et al. (1983). The samples
for analysis of zooplankton (Rotifera, Copepoda and Cladocera) were collected in both periods and in 9 stations with a suction pump and using a plankton net with 30 µm of mesh opening. The samples were conditioned in flasks and preserved with formaline 4% for subsequent analysis in labo-ratory, specialized methodology and bibliography was used considering the composition and density of the organisms.
RESULTS
Limnological characteristics of the Salto Grande reservoir
The results obtained for the limnological variables are presented in Tables 1 and 2; the
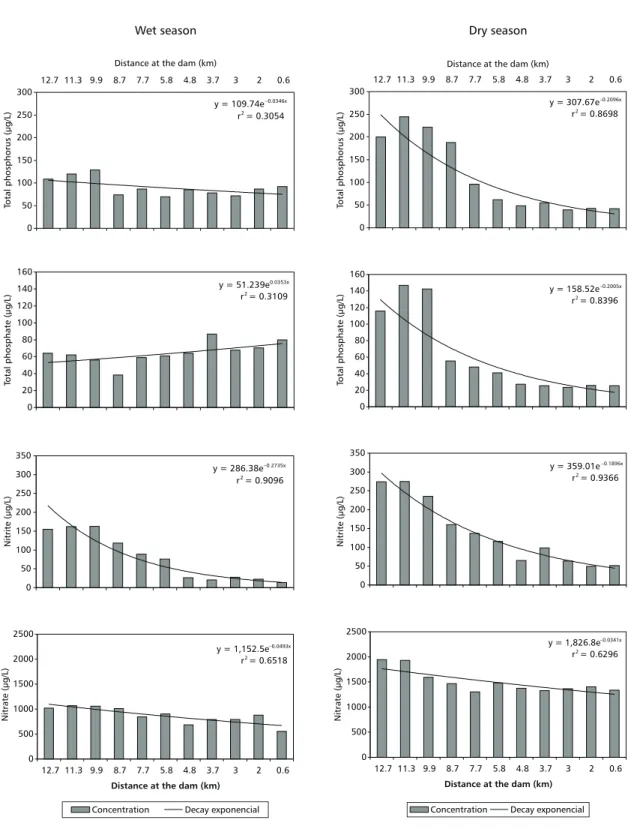
diffe-rentiation in the water quality in the longitudinal axis of the system was verified, with higher values for some variables in the stations closest to the entrance of the Atibaia river. The conductivity values, for instance, varied from 87 to 238 µS/ cm and from 99 to 157 µS/cm in the dry and rainy period, respectively. Significant variation was also obtained for suspended material (from 2.79 to 12.50 mg/L in the dry period and from 9.33 to 64.9 mg/L in the rainy period), with higher organic fraction in the dry period (except in stations closer to the Atibaia river) and the inorganic fraction predominating in the rainy period. The higher carriage of aloctone material in the rainy period contributed to the reduction of the euphotic zone limit (from 0.6 to 2.1 m in the rainy period and from 1.8 to 6.5 m in the dry period), verifying that in the dry period all the stations presented more than 50% of the water column with light. The chlorophyll-a concentrchlorophyll-ation wchlorophyll-as lchlorophyll-arger in the rchlorophyll-ainy period (from 1.95 to 11.86 µg/L) than in the dry period (from 0.46 to 6.51 µg/L). For total and dissolved nutrients, in general, a concentration decline in the Atibaia river-barrage direction was verified, mainly in the dry period. The concentrations of total phosphorus varied from 69.58 to 128.85 µg/L in the rainy period and from 39.63 to 244.22 µg/L in the dry period. Among the phosphate compounds, it was only during the rainy period that the total dissolved phosphate and inorganic phosphate did not present a decreasing distribution of concentration. It was also verified for the longitudinal pattern higher concentrations of nitrogen compounds in stations close to the en-trance of the Atibaia river and lower concentrations in stations close to the barrage. For nitrite, for instance, a variation was verified from 13.68 to 162.86 µg/L in the rainy period, while that variation occurred from 49.30 to 274.76 µg/L in the dry season (Tables 1 and 2).
Composition and dominance of the zooplanktonic community
Stations Variable
1 2 3 4 5 6 7 8 9 10 11
Maximum depth (m) 4.0 2.5 1.7 5.0 10.0 3.7 5.5 7.0 2.7 13.5 19.5 Euphotic limit (m) 0.6 0.9 0.9 0.9 1.5 0.9 2.1 1.8 1.9 1.5 0.6 Conductivity (µS/cm) 145 148 157 130 123 117 108 108 105 103 99 Total suspended material
(mg/L) 64.90 35.85 36.87 17.01 19.04 10.72 9.33 11.71 10.78 11.83 14.40 Organic material (mg/L) 22.5 13.7 10.3 5.9 5.3 3.8 3.0 3.8 4.1 4.1 3.6 Inorganic material
(mg/L) 42.4 22.2 26.6 11.1 13.8 6.9 6.3 7.9 6.7 7.7 10.8 Chlorophyll-a (µg/L) 4.88 6.28 6.98 11.86 3.49 7.67 2.23 6.98 10.46 10.46 1.95 Total phosphorus (µg/L) 108.72 119.99 128.85 73.57 86.67 69.58 85.17 78.34 71.51 86.55 91.85 Total dissolved
phosphorus (µg/L) 64.03 62.12 56.21 38.41 58.95 61.08 64.08 86.85 67.78 70.51 79.74 Inorganic phosphate
(µg/L) 33.30 33.43 32.57 26.13 31.67 30.99 28.06 33.27 37.26 28.41 48.84 Total organic nitrogen
(mg/L) 3.28 6.06 6.09 2.00 1.60 2.14 1.82 1.97 1.58 1.47 2.08 Ammonium (µg/L) 617.03 776.24 896.06 539.43 691.28 453.97 451.25 260.27 248.23 276.27 464.94 Nitrate (µg/L) 1,020.6 1,066.9 1,060.3 1,009.1 843.6 902.9 684.0 789.8 791.7 877.7 552.8 Nitrite (µg/L) 155.21 162.42 162.86 118.25 88.87 76.18 26.67 20.72 27.85 22.23 13.68 Silicate (mg/L) 5.58 5.14 5.22 5.37 4.33 3.83 3.59 3.38 4.46 3.70 4.31
TABLE 1
Comparison of limnological data in Salto Grande reservoir in the wet season. river, and Copepoda and Cladocera in stations
inter-mediate and close to the dam.
The Cyclopoida copepods were the most abundant in the reservoir during the two analyzed periods. In the rainy period, this group represented 76.2% of a total of 898,607 ind./m3.
In the dry period, Cyclopoida contributed with 88.2% of a total of 1,481,051 ind./m3. Ca-lanoida represented 23.8% and 11.8% of the copepods found in the rainy and dry periods, respectively. The occurrence of Harpacticoida copepods was only observed in the rainy period, in stations 1 and 2, with 20 ind./m3 and station 3, with 75 ind./m3 (Table 5).
In the rainy period, rotifers contributed with 50.39% of the total of individuals. Station 3
pre-sented a larger abundance of organisms (306, 600 ind./m3), in which was also observed the largest relative abundance of rotifers (89.90%), while the smallest contributions occurred in stations 8, 10 and 11, where the relative abundance of roti-fers varied from 15.79% to 28.95%. In those stations, the copepods were the dominant organisms (Table 3).
TABLE 2
Comparison of limnological data in Salto Grande reservoir in the dry season.
Stations Variable
1 2 3 4 5 6 7 8 9 10 11
Maximum depth (m) 3 3 2 7.5 11 5.7 6.5 8.5 12 9 7.5 Euphotic limit (m) 2.4 2.4 1.8 6.3 6.3 5.7 6.5 6.3 6 6
Conductivity (µS/cm) 225 238 219 87 91 154 157 158 163 116 111 Total suspended
material (mg/L) 12.50 13.75 11.62 6.74 5.05 4.83 3.47 2.79 3.29 2.99 3.30 Organic material
(mg/L) 6.0 6.2 4.5 3.9 2.6 2.4 2.3 2.1 1.6 2.3 1.7 Inorganic material
(mg/L) 6.5 7.6 7.1 2.9 2.5 2.5 1.2 0.7 1.7 0.7 1.6 Chlorophyll-a (µg/L) 2.32 2.79 4.18 6.04 2.79 6.04 6.51 0.46 2.32 3.72 5.11 Total phosphorus
(µg/L) 199.97 244.22 221.56 188.15 96.21 61.68 48.34 55.06 39.63 42.75 42.26 Total dissolved
phosphorus (µg/L) 115.61 146.87 142.41 55.52 48.01 41.08 27.30 25.57 23.52 25.74 25.44 Inorganic phosphate
(µg/L) 78.34 89.96 90.65 33.32 28.38 17.10 7.59 13.24 7.88 8.04 6.11 Total organic nitrogen
(mg/L) 1.37 1.31 1.37 0.88 0.81 1.11 0.57 2.43 1.88 1.9 1.58 Ammonium (µg/L) 1,314.5 1,519.9 1,538.5 761.3 1,047.1 536.5 293.5 575.6 365.5 218.0 267.1 Nitrate (µg/L) 1,944.8 1,932.7 1,591.8 1,464.8 1,304.0 1,483.1 1,377.7 1,325.7 1,368.0 1,404.9 1,335.0 Nitrite (µg/L) 274.09 274.76 235.79 160.10 137.19 115.71 65.05 98.31 64.01 49.30 51.61 Silicate (mg/L) 6.87 6.26 6.88 5.95 4.90 4.71 4.93 2.34 5.06 3.47 5.00
TABLE 3
Density (ind./m3) and the relative abundance (%) of Copepoda, Cladocera, Rotifera and other organisms in the wet season.
Copepoda Cladocera Rotifera Other organisms* Total Stations
Density % Density % Density % Density % Density
1 3,600 2.48 70 0.05 115,600 79.77 25,650 17.70 144,920
2 5,150 2.77 120 0.06 148,800 80.09 31,710 17.07 185,780
3 10,125 2.97 7,885 2.31 306,600 89.90 16,445 4.82 341,055
5 145,578 35.87 31,455 7.75 228,480 56.30 315 0.08 405,828
6 131,983 39.50 72,715 21.76 129,285 38.70 109 0.03 334,092
8 150,624 54.45 51,912 18.77 74,100 26.79 0 276,636
9 145,299 45.29 33,260 10.37 142,200 44.32 86 0.03 320,845
10 191,488 56.41 47,900 14.11 98,280 28.95 1,760 0.52 339,428
11 114,800 66.35 30,229 17.47 27,310 15.79 672 0.39 173,011
Total 898,647 275,546 1,270,655 76,747
% 35.64 10.93 50.39 3.04 2,521,595
TABLE 4
Density (ind./m3) and the relative abundance (%) of Copepoda, Cladocera, Rotifera and other organisms in the dry season.
Copepoda Cladocera Rotifera Other organisms* Total Stations
Density % Density % Density % Density % Density
1 4,459 6.41 2,698 3.88 56,733 81.55 5,675 8.16 69,565
2 1,093 1.92 20 0.04 33,893 59.47 21,987 38.58 56,993
3 460 0.97 35 0.07 40,950 86.75 5,760 12.20 47,205
5 138,575 17.84 70,888 9.13 567,100 73.03 0 776,563
6 243,114 25.87 148,401 15.79 548,340 58.34 0 939,855
8 218,055 19.09 92,721 8.12 831,600 72.80 0 1,142,376
9 250,191 32.79 152,403 19.97 360,427 47.24 0 763,021
10 331,778 34.58 62,438 6.51 564,960 58.89 227 0.02 959,403
11 293,326 38.34 91,257 11.93 380,457 49.73 78 0.01 765,118
Total 1,481,051 620,861 3,384,460 33,727
% 26.83 11.25 61.31 0.61 5,520,099
TABLE 5
Comparison of density (ind./m3) and the relative abundance (%) of Copepoda (Cyclopoida, Calanoida and Harpacticoida) in the wet and dry season.
* Insecta larvae, Annelida and Ostracoda.
Wet season Dry season
Cyclopoida Calanoida Harpacticoida Cyclopoida Calanoida Stations
Density % Density % Density % Total Density % Density % Total 1 3,500 95.6 140 3.8 20 0.5 3,660 2,282 51.2 2,178 48.8 4,460 2 5,130 99.6 0 20 0.4 5,150 1,060 97.0 33 3.0 1,093 3 10,005 98.8 45 0.4 75 0.7 10,125 445 96.7 15 3.3 460 5 105,374 72.4 40,204 27.6 145,578 111,485 80.5 27,090 19.5 138,575 6 91,434 69.3 40,549 30.7 131,983 198,275 81.6 44,839 18.4 243,114 8 93,600 62.1 57,024 37.9 150,624 207,545 95.2 10,509 4.8 218,054 9 120,790 83.2 24,409 16.8 145,199 235,043 93.9 15,148 6.1 250,191 10 156,904 81.9 34,584 18.1 191,488 283,071 85.3 48,707 14.7 331,778 11 97,828 85.2 16,972 14.8 114,800 266,743 90.9 26,583 9.1 293,326 Total 684,565 213,927 115 1,305,949 175,102
% 76.2 23.8 0.01 898,607 88.2 11.8 1,481,051
The density of Cladocera varied from 70 ind./ m3 (station 1) to 72,715 ind./m3 (station 6), in a total of 275,546 ind./m3, in the rainy season and of 20 ind./m3 (station 2) to 152,403 ind./m3 (station 9), in a total of 620,861 ind./m3, in the dry period, during the two analyzed periods cladocerans were less frequent than copepods and rotifers. Other
organisms were found in the analyzed samples, such as larvae insects, annelids and some ostracods, which, in the rainy period and in the dry period (Tables 3 and 4) were more abundant in the stations close to the entrance of the river Atibaia.
Co-pepoda (1,481,051 ind./m3), Cladocera (620,861 ind./m3) and other organisms (33,727 ind./m3) added to a total of 5,520,099 ind./m3, while in the rainy period the density of Rotifer (1,270,655 ind./ m3), Copepoda (898,647 ind./m3), Cladocera (275,546 ind./m3) and other organisms (76,747 ind./ m3) added to 2,521,595 ind./m3 (Tables 3 and 4).
DISCUSSION
Spatial and temporal characterization of the environmental variables in the Salto Grande reservoir
The distribution of all the presented environ-mental variables demonstrates a characteristic pattern for reservoirs, as thoroughly discussed by Armengol et al. (1999). According to these
authors, nutrients can be diluted by water, resul-ting in the establishment of a longitudinal gradient in the composition of the water of a reservoir, which contributes to the qualitative and quan-titative differentiated establishment of the bio-logical communities.
As mentioned previously, in the Salto Grande reservoir an accentuated longitudinal gradient of distribution of some variables was verified, de-monstrating the heterogeneity of the system and the variation of the conditions of the reservoir, in both study periods. To evaluate the variation and the decline degree in relation to the chemical com-position of the water, an analysis similar to that developed by Armengol et al. (1999) was made,
in which the author calculates the existent corre-lation between a certain variable and the distance of the barrage. The obtained results are presented in Fig. 1, verifying a more significant correlation in the dry than in the rainy period for total match (r2 = 0.86), dissolved total phosphate (r2 = 0.83), nitrite (r2 = 0.93), inorganic phosphate (r2 = 0.89), ammonium (r2 = 0.84) and suspended material (r2 = 0.85). In the rainy period, only nitrite (r2 = 0.90) and conductivity (r2 = 0.89) presented correlation with the distance of the barrage, which clearly demonstrates the outstanding effect of the preci-pitation and of the operational mechanism of the barrage in the space heterogeneity of the system. As also presented by Armengol et al. (1999),
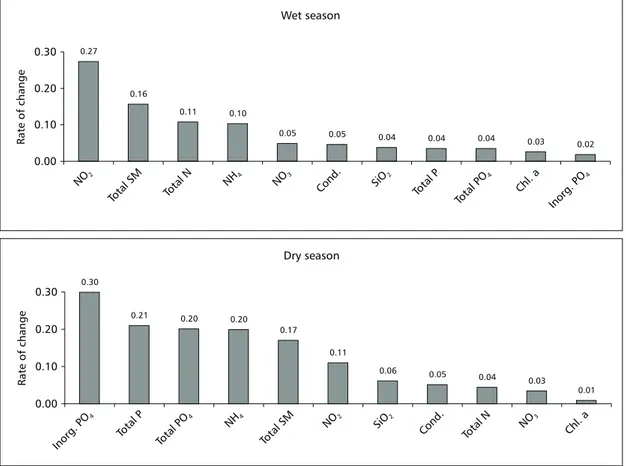
it is possible, through the comparison of the expo-nents of the declining equation, to measure the efficiency of the processes involved in the reduction of the concentration of variables analyzed along the Salto Grande reservoir (Fig. 2). As shown in
Fig. 2, small variations occurred in conductivity (0.05 – rainy and dry period), demonstrating simi-larity with the results obtained by Armengol et al.
(1999) in the Sau reservoir (Spain), this fact being attributed to the dilution by small tributaries, morphology of the basin or precipitation. Other components showed high rates of decrease in the longitudinal axis, such as suspended material (0.16-0.17 – rainy and dry period, respectively), probably due to the sedimentation process, already observed by Leite (1998) for that system. The results obtai-ned for ammonium ion (0.10-0.20, in the rainy and dry periods, respectively) and phosphate compounds (0.20-0.30, in the dry period) were similar to those observed by Armengol et al. (1999), this being
attributed to the precipitation that can happen to phosphate compounds and the chemical transfor-mation, such as the case of ammonium nitrification, processes in which the activity of organisms is essential.
Through the calculation of the variation rate (Fig. 1) and of the analysis of the decline equation (Fig. 2) it is possible to verify if processes are of biological origin or not, evidenced by the role of the sedimentation, chemical transformation, preci-pitation and biological activity, although, for the most part, a combination of morphologic, climato-logical and trophic degree factors occurred, which serve as support so that other processes can take place in the system.
In the case of the Salto Grande reservoir, the depositional process is important for the impro-vement of the water quality, making it function as a sedimentation basin or play the part of a tertiary treatment in response to the entrance of polluted water from the Atibaia river. However, biological activities related to production and decomposition are also important for the establishment of a gradient in the reservoir, once the communities are organized in relation to a trophic gradient.
Fig. 1— Evolution of the chemical, physical and biological variables in the Salto Grande reservoir from the Atibaia river to the dam. The equations are relating of each variable with the distance at the dam.
Wet season Dry season
y = 286.38e–0.2735x
r2= 0.9096
0 50 100 150 200 250 300 350
y = 359.01e–0.1896x
r2= 0.9366
0 50 100 150 200 250 300 350
y = 307.67e–0.2096x
r2= 0.8698
0 50 100 150 200 250 300
12.7 11.3 9.9 8.7 7.7 5.8 4.8 3.7 3 2 0.6 Distance at the dam (km)
y = 109.74e–0.0346x
r2= 0.3054
0 50 100 150 200 250 300
12.7 11.3 9.9 8.7 7.7 5.8 4.8 3.7 3 2 0.6 Distance at the dam (km)
y = 51.239e0.0353x
r2= 0.3109
0 20 40 60 80 100 120 140 160
y = 158.52e–0.2005x
r2= 0.8396
0 20 40 60 80 100 120 140 160
y = 1,152.5e–0.0493x
r2= 0.6518
0 500 1000 1500 2000 2500
12.7 11.3 9.9 8.7 7.7 5.8 4.8 3.7 3 2 0.6 Distance at the dam (km)
Concentration Decay exponencial
y = 1,826.8e–0.0341x
r2= 0.6296
0 500 1000 1500 2000 2500
12.7 11.3 9.9 8.7 7.7 5.8 4.8 3.7 3 2 0.6 Distance at the dam (km)
Concentration Decay exponencial
Fig. 1— (Continued).
Wet season Dry season
y = 4.567e–0.1081x
r2= 0.4975
0 1 2 3 4 5 6 7
12.7 11.3 9.9 8.7 7.7 5.8 4.8 3.7 3 2 0.6 Distance at the dam (km)
Concentration Decay exponencial
y = 0.9841e0.0439x
r2= 0.1183
0 1 2 3 4 5 6 7
12.7 11.3 9.9 8.7 7.7 5.8 4.8 3.7 3 2 0.6
Distance at the dam (km)
Concentration Decay exponencial y = 5.5106e–0.0381x
r2= 0.5145
0 1 2 3 4 5 6 7 8
y = 2,027e–0.1989x
r2= 0.8405
0 500 1000 1500 2000 y = 877.3e–0.1026x
r2= 0.593
0 500 1000 1500 2000
y = 7.1066e–0.0612x
r2= 0.4138
0 1 2 3 4 5 6 7 8 y = 29.224e0.0185x
r2= 0.1355
0 20 40 60 80 100
12.7 11.3 9.9 8.7 7.7 5.8 4.8 3.7 3 2 0.6 Distance at the dam (km)
y = 128e–0.2992x
r2= 0.896
0 20 40 60 80 100
12.7 11.3 9.9 8.7 7.7 5.8 4.8 3.7 3 2 0.6 Distance at the dam (km)
Inorganic
phosphate
(
g/L)
µ
Inorganic
phosphate
(
g/L)
µ
Silicate
(mg/L)
Silicate
(mg/L)
Ammonium
(
g/L)
µ
Ammonium
(
g/L)
µ
Total
org.
nitrogen
(mg/L)
Total
org.
nitrogen
Fig. 1— (Continued).
Wet season Dry season
y = 45.474e–0.1556x
r2= 0.6633
0 10 20 30 40 50 60 70
12.7 11.3 9.9 8.7 7.7 5.8 4.8 3.7 3 2 0.6 Distance at the dam (km)
Concentration Decay exponencial
y = 14.831e–0.1699x
r2= 0.8581
0 10 20 30 40 50 60 70
12.7 11.3 9.9 8.7 7.7 5.8 4.8 3.7 3 2 0.6 Distance at the dam (km)
Concentration Decay exponencial y = 6.7092e–0.0258x
r2= 0.0196
0 5 10 15
12.7 11.3 9.9 8.7 7.7 5.8 4.8 3.7 3 2 0.6 Distance at the dam (km)
y = 3.3767e–0.0088x
r2= 0.0015
0 5 10 15
12.7 11.3 9.9 8.7 7.7 5.8 4.8 3.7 3 2 0.6 Distance at the dam (km)
y = 159.02e–0.0461x
r2= 0.8981
0 100 200 300
y = 200.33e–0.0505x
r2= 0.2273
0 100 200 300
Chlorophyll-a
(
g/L)
µ
Chlorophyll-a
(
g/L)
µ
Conductivity
(
S/cm)
µ
Conductivity
(
S/cm)
µ
Suspended
material
(mg/L)
Suspended
material
(mg/L)
In the dry period, the lowest water flow and larger residence time (caused by low indexes of pluviosity), as well as the morphometry of the system, favored the sedimentation of the aloctone material that arrived mainly through the Atibaia river. That process might have caused a longitu-dinal gradient in the reservoir, leading to a more eutrophic condition in areas close to the entrance of the Atibaia river to a less eutrophic condition close the barrage (Fig. 3).
Considering all the obtained information, it is verified that the Salto Grande reservoir is a highly impacted system by the punctual and
Wet season
0.27
0.16
0.11 0.10
0.05 0.05 0.04 0.04 0.04
0.03 0.02
0.00 0.10 0.20 0.30
Dry season
0.30
0.21 0.20 0.20 0.17
0.11
0.06 0.05
0.04 0.03 0.01 0.00
0.10 0.20 0.30
Rate
of
change
Rate
of
change
Inorg. PO4
Total P
Total
PO4 NH4 Total
SM NO2 SiO2
Cond. Total N
NO3 Chl.a NO2
Total SM
Total N
NH4 NO3 Cond. SiO2 Total
P
Total PO4
Chl. a
Inorg. PO4
Fig. 2— Measure of the efficiency of the processes involved in the reduction of the concentrations of the variables ana-lyzed in the Salto Grande reservoir.
1 2 3 4 5 6 7 8 9 10 11
34 44 54 64 74
Oligotrophic Mesotrophic Eutrophic
Station
Wet season
34 44 54 64 74
Dry season
Trophic
state
index
0 20 40 60 80 100
1 2 3 5 6 8 9 10 11
Dry season
Rotifera Copepoda Cladocera
0 20 40 60 80 100
1 2 3 5 6 8 9 10 11
Wet season
Rotifera Copepoda Cladocera
River Station Dam
River Station Dam
Relative
abundance
(%)
Relative
abundance
(%)
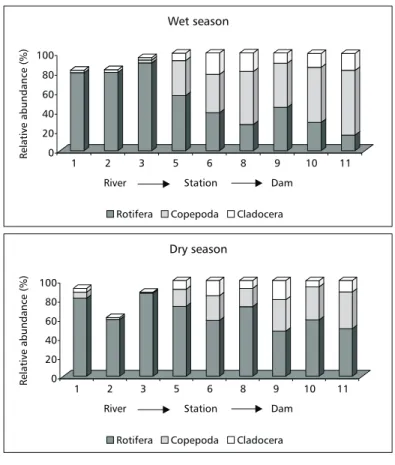
Fig. 4 — Longitudinal distribution of the relative abundance of zooplankton community in the Salto Grande reservoir Space and temporal heterogeneity of the
zooplanktonic community
In the Salto Grande reservoir, the heterogeneity did not only occur in the distribution, but also in the composition and density of organisms of the zooplanktonic community while comparing the analyzed periods. It can be observed that the phy-sical, chemical and biological characteristics of the reservoir favored a larger abundance of Rotifer and Copepoda.
In the rainy period, in spite of the density of those organisms being similar, considering the longitudinal axis of the system, its spatial dis-tribution was differentiated. Rotifers were more abundant in the entrance of the Atibaia river, pre-senting a decreasing gradient in direction to the barrage, while, in relation to copepods, an inverse distribution was verified, being these organisms more abundant in the stations distant to the river entrance (Fig. 4).
In relationship to rotifers, the literature has demonstrated that its dominance is associated to the increase of the trophic degree (Esteves & Sendacz, 1988), which is related to the feeding habits of this group, which include the ingestion of small particles such as bacteria and organic debris, usually abundant in eutrophic systems (Nogueira, 1996). In that way rotifer distribution in the Salto Grande reservoir might have been influenced by the suspension material concentration that also presented a decreasing gradient in the entrance of the reservoir in barrage direction. That sedimentation was directly related with the morpho-metry of the system (Leite, 1998).
However, the temporal variation in the density of the organisms was also sure for the operational regime of the reservoir. The smallest densities for rotifers were verified in the rainy season, in which the reservoir presents smaller time of residence of water. According to Rocha
et al. (1999), organisms such as rotifers, protozoans
and nauplii copepods are more susceptible to the
intense flow due to their size and location in the water column.
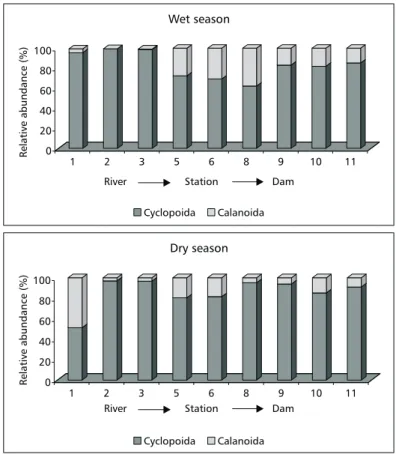
The inverse distribution of copepods in rela-tion to the rotifers possibly occurred as a funcrela-tion of food supply. Besides its distribution, the compo-sition of this group can also be related to feeding habits. In the Salto Grande reservoir the dominance of Cyclopoida in relation to Calanoida took place during the rainy and dry period. In general, the distribution of copepods in the longitudinal axis of the Salto Grande reservoir evidenced a better adaptation of the organisms in the stations distant to the entrance of the Atibaia river (Fig. 4). However, considering the horizontal distribution of Cyclo-poida and Calanoida (Fig. 5) in the rainy period, a better adaptation tendency of Calanoida was observed in the stations distant to the entrance of the river Atibaia, while Cyclopoida was present in the whole reservoir, with superior density. In the dry period the dominance of Cyclopoida among the copepods was evident, however its distribution didn’t present a defined pattern (Fig. 5).
0 20 40 60 80 100
1 2 3 5 6 8 9 10 11
Cyclopoida Calanoida
0 20 40 60 80 100
1 2 3 5 6 8 9 10 11
Cyclopoida Calanoida
Dry season Wet season
River Station Dam
River Station Dam
Relative
abundance
(%)
Relative
abundance
(%)
The density of organisms was also related with the water retention time in the reservoir. As for Copepoda, Rotifera and Cladocera, the density of organisms was directly proportional to the time of retention, in other words, the larger the time of retention the higher the density of organisms. As discussed above, the communities are sensitive to the operational regime, mainly the smallest ones, such as rotifers (Rocha et al., 1999). In that way,
it is possible that the numeric likeness between rotifers and copepods in the rainy period has oc-curred due to the effect of the intense water flow being more negative on rotifers than on copepods. In the dry period, when the time of retention was larger, the dominance of rotifers on other groups was more evident.
In relation to the cladocerans, it was observed that this group did not numerically dominate the zooplanktonic community in any of the stations during the studied periods and they were better adapted in the stations distant to the entrance of the Atibaia river, where the characteristics of the system are more similar to a lake.
Acknowledgments — The authors wish to express their
appre-ciation for the financial support of the Brazilian research institutions, FAPESP and CAPES, as well as the PPG-SEA/ EESC-USP.
REFERENCES
ARMENGOL, J., GARCIA, J. C., COMERMA, M., ROMERO, M., DOLZ, J., ROURA, M., HAN, B. H., VIDAL, A. & SIMEK, K., 1999, Longitudinal processes in canyon type reservoir: the case of Sau (N.E. SPAIN), pp. 313-345. In:
J. G. Tundisi & M. Straškraba (eds.), Theoretical reservoir ecology and its applications. Brazilian Academy of Sciences and Backhuys Publishers, 585p.
CARVALHO, M. A. J., 1979, A Represa de Americana, São Paulo: aspectos físico-químicos e variação das popula-ções de Copepoda Cyclopoida de vida livre. Tese de Dou-torado, Instituto Biológico, Universidade de São Paulo, São Paulo, 148p.
COLE, G. A., 1975, Textbook of limnology. Mosby Company, St. Louis, 427p.
ESPÍNDOLA, E. L. G., 1994, Dinâmica da associação conge-nérica das espécies de Notodiaptomus (Copepoda, Cala-noida) no reservatório de Barra Bonita (SP). Tese de
Doutorado, Escola de Engenharia de São Carlos, Uni-versidade de São Paulo, São Carlos, 363p.
ESTEVES, K. E. & SENDACZ, S., 1988, Relações entre a bio-massa do zooplâncton e o estado trófico de reservatórios do Estado de São Paulo. Acta Limnol. Brasil., 2: 587-604.
GOLTERMAN, H. L., CLYMO, R. S. & OHNSTAD, M. A. M., 1978, Methods for physical and chemical analysis of freshwaters. 2nd ed., Blackwell Scientific, IBP
Hand-book, London, 213p.
KOROLEFF, F., 1976, Determination of nutrients, pp. 117-181. In: K. Ggrasshoff (ed.), Methods of seawater
analisys. Verlag. Chemie. Weinhein, 317p.
LEITE, M. A., 1998, Variação espacial e temporal da taxa de sedimentação no reservatório de Salto Grande (Ame-ricana, SP) e sua influência sobre as características lim-nológicas do sistema. Dissertação de Mestrado, Escola de Engenharia de São Carlos, Universidade de São Paulo, São Carlos, 170p.
LIJKLEMA, L., 1994, Nutrient dynamics in shallow lakes: effects of changes in loading and role of sediment-water interactions. Hydrobiologia, 275/276: 335-348.
MACKERETH, F. J. H., HERON, J. & TALLING, J. F., 1978,
Water analysis: some revised methods for limnologists.
(Freshwater Biological Association Scientific Publica-tion, 36), Titus Wilson & Sons Ltda, Kendal, 117p. NOGUEIRA, M. G., 1996, Comparação, abundância e
dis-tribuição espaço-temporal das populações planctônicas e das variáveis físico-químicas na represa de Jurumirim, Rio Paranapanema, SP. Tese de Doutorado, Escola de
Engenharia de São Carlos, Universidade de São Paulo, São Carlos, 439p.
NUSCH, E. A., 1980, Comparison of different methods for Chlorophyll and phaeopigments determination. Arch. Fur Hydrobiol., 14: 14-36.
ROCHA, A. A., 1972, Estudo sobre a fauna bentônica da Re-presa de Americana no Estado de São Paulo. Dissertação de Mestrado, Universidade de São Paulo, São Paulo, 65p. ROCHA, O., MATSUMURA-TUNDISI, T., ESPÍNDOLA, E. L. G., ROCHE, K. F. & RIETZLER, A. C., 1999, Ecological theory applied to reservoir zooplankton, pp. 457-476. In: J. G. Tundisi & M. Straškraba (ed.), Theoretical reservoir ecology and its applications. Brazilian Academy of Sciences
and Backhuys Publishers, 585p.
SHIMIZU, G. Y., 1981, Represa de Americana: um estudo de distribuição batimétrica da fauna bentônica. Tese de Doutorado, Instituto de Biociências, Universidade de São Paulo, São Paulo, 148p.
STANDARD METHODS, 1995, For examination of water and wastwater. In: A. D. Eaton et al. (eds.), 19th ed.
Ame-rican Public Health Association, Washington, 1268p. STRAŠKRABA, M. & TUNDISI, J. G., 1999, Reservoir water
quality management. In: Guidelines of lake management. International Lake Environment Committee, 229p. STRAŠKRABA, M., TUNDISI, J. G. & DUNCAN, A., 1993,
Introduction, pp.7-9. In: M. Straškraba, J. G. Tundisi
& A. Duncan (eds.), Comparative reservoir limnology and water quality management. Kluwer Academic Publishers, Dordrecht, 291p.
TOLEDO, A. P., TALARICO, M., CHINEZ, S. J. & AGUDO, E. G., 1983, A aplicação de modelos simplificados para a avaliação do processo da eutrofização em lagos e reser-vatórios tropicais. In: 12o Congresso Brasileiro de
En-genharia Sanitária e Ambiental. Anais, Camboriú, SC. THOMAZ, S. M., BINI, L. M. & ALBERTE, S. M., 1997, Limnologia do reservatório de Segredo: padrões de va-riação espacial e temporal, pp. 19-37. In: A. A. Agostinho
& L. C. Gomes (eds.), Reservatório de Segredo: bases ecológicas para o manejo. Editora da Universidade Esta-dual de Maringá, Maringá, 387p.
TONISSI, F. B., 1999, Avaliação ecotoxicológica do reser-vatório de Salto Grande, Americana (SP), como subsídio para a análise da qualidade ambiental do sistema. Dis-sertação de Mestrado, Escola de Engenharia de São Carlos, Universidade de São Paulo, São Carlos, 130p. TUNDISI, J. G., 1969, Produção primária, “standing-stock”
e fracionamento do fitoplâncton na região lagunar de Cananéia. São Paulo, Tese de Doutorado, Universidade
de São Paulo, 131p.
TUNDISI, J. G., 1988, Impactos ecológicos da construção de represa: aspectos específicos e problemas de manejo, pp. 1-76. In: J. G. Tundisi (ed.), Limnologia e manejo de represas. Série Monografias em Limnologia, 1o vol.,
Tomo 1, 506p.
TUNDISI, J. G., MATSUMURA-TUNDISI, T., HENRY, R., ROCHA, O. & HINO, K., 1988, Comparação do estado trófico de 23 reservatórios do Estado de São Paulo: Eu-trofização e manejo, pp. 165-204. In: J. G. Tundisi (ed.),
Limnologia e manejo de represas. Série Monografias em Limnologia, 1o vol., Tomo 1, 506p.