Note
CALIBRATION OF A CAPACITANCE PROBE
IN A PALEUDULT
Cláudio Ricardo da Silva1; Aderson Soares de Andrade Júnior2*;José Alves Júnior3; Antonio Barros de Souza4; Francisco de Brito Melo2; Maurício Antonio Coelho Filho5
1
UFPI - Campus Cinobelina Elvas - Rod. BR 135 - km 3 - 64900-000 - Bom Jesus, PI - Brasil. 2
Embrapa Meio-Norte, C.P. 01 - 64006-220 - Teresina, PI - Brasil. 3
Embrapa Arroz e Feijão, Rod. Goiânia Nova Veneza km 12 Zona Rural 75375000 Santo Antonio, GO Brasil.
4
UFPI/CCA - Graduando em Agronomia. 5
Embrapa Mandioca e Fruticultura Tropical, C.P. 07 - 44380-000 - Cruz das Almas, BA -Brasil. *Corresponding author <aderson@cpamn.embrapa.br>
ABSTRACT: The use of capacitance sensors is one of the methods used to quantitatively measure soil water contents (θ, m3 m-3). Sensors provide readings at desired depths and time intervals. A
capacitance probe (Diviner 2000) was calibrated for a Rhodic Paleudult from the Piaui State, Brazil. Six access tubes were installed in a 5 × 2 m grid arrangement. Three moisture levels (saturated, moist and dry) were used in two replications. Probe readings and soil samplings to determine θwere made at 0.1 m depth intervals down to a depth of 1.0 m. A power calibration equation was developed for each depth as well as for the entire soil profile (Root Mean Square Error = 0.014, R2 = 0.93) for a θrange of
0.068 to 0.264 m3m-3. A separate calibration for each depth improves the correlation coefficient and
minimizes RMSE. Site-specific calibration improves the accuracy for soil water monitoring. Key words: FDR probe, sensor, irrigation, soil water content
CALIBRAÇÃO DE UMA SONDA DE CAPACITÂNCIA
EM UM ARGISSOLO
RESUMO: Sensores de capacitância são alternativas aos métodos comuns de quantificação do teor de água do solo (θ, m3 m-3), provendo leituras em profundidade de forma segura e rápida. Neste estudo,
uma sonda de capacitância (Diviner 2000) foi calibrada em um Argissolo vermelho-amarelo do Estado do Piauí, Brasil. Seis tubos de acesso foram instalados em uma grade de 5 m × 2 m. Três níveis de umidade (saturado, úmido e seco) foram aplicados em duas repetições. Efetuaram-se leituras do equipamento, para cada 0.1 m de solo, até 1.0 m de profundidade, juntamente com amostras de solo para a determinação de θ. Uma equação de potência foi desenvolvida para cada profundidade como também para o todo perfil do solo (RMSE = 0.014, R2 = 0.93) em um intervalo de 0.068 a 0.264 m3 m-3 of
θ. A calibração para cada profundidade melhora o coeficiente de correlação e minimiza o erro das estimativas. Calibrações locais melhoram a acurácia do monitoramento da água no solo.
Palavras-chave: sonda de FDR, sensor, irrigação, teor de água do solo.
INTRODUCTION
Irrigation control based on soil water status is one of the most useful methods of scheduling due to its practicability and low cost (Silva et al., 2005). The most common methods that have been used to mea-sure soil water contents are the gravimetric and neu-tron thermalization (Gardner et al., 1991). Recently in Brazil, the capacitance method has also been used to measure soil water content.
The capacitance method includes a probe with a pair of electrodes or electrical plates that behave as
a capacitor. When activated, the soil-water-air matrix works as a dielectric of capacitor and completes an oscillating circuit (Heng et al., 2002). Changes in the resonant frequency (F) of the circuit depend on the
changes in the capacitance, which is given by F =
[2π√(LC)]-1, where L and C are circuit inductance and total capacitance, respectively (Paltineanu & Starr, 1997). The method has several attractive features: it is safe, measurements are rapid, and can be used to automate data collection using a data logger.
ac-curately. Despite of the availability of a manufacturer universal calibration, results have shown that the cali-bration for individual soils improves the accuracy (Paltineanu & Starr, 1997; Baumhardt et al., 2000; Mor-gan et al., 1999; Leib et al., 2003; Fares et al., 2004; Groves & Rose, 2004). However, field calibration is laborious and has to be made carefully to give yield results.
The objectives of this study were (i) to deter-mine the field calibration equation for a capacitance probe in a Rhodic Paleudult from the Piaui State, Bra-zil; and (ii) to compare it to the manufacturer calibra-tion equacalibra-tion.
MATERIAL AND METHODS
Experimental area
The calibration was conducted in Teresina, State of Piaui, Brazil (05°05’S, 42°48’W and elevation 74.4 m) from 10/30/2005 to 12/20/2005, which has a tropi-cal climate with average annual air temperature and rela-tive humidity of 27.9°C and 69.2%, respecrela-tively, and annual rainfall of 1,299 mm (Bastos & Andrade Júnior, 2000). There are about 1.5 million hectares of Paleudults in Piaui State. About 82% of the area has potential for pasture and agriculture, especially with irrigation (Embrapa, 1989). Table 1 shows the physical and chemical soil proprieties of the experimental area.
Capacitance probe
A capacitance probe (model Diviner 2000, Sentek Pty Ltd., Stepney South Australia) was used in this experiment. The sensor is a hand-held, por-table soil moisture monitoring device consisting of a display/logger unit, connected by a cable to an auto-matic depth-sensing probe that is moved up and down in an access tube. During calibration, the manufacturer recommends normalizing the probe using the scaled frequency (SF) values for air and water (≈25°C).
SF = (Fa – Fs)(Fa – Fw)-1
where: Fa is the SF in air; Fs is the SF in soil; Fw is
the SF in water.
The normalization is necessary to obtain mean-ingful data continuously, since it is impossible to tune on all sensors to count the exact frequency when mea-suring a particular standard, e.g. in a container of water (Sentek, 2000). The values for Fa and Fwwere fixed
at 164919 and 121850, respectively.
Access tube installation
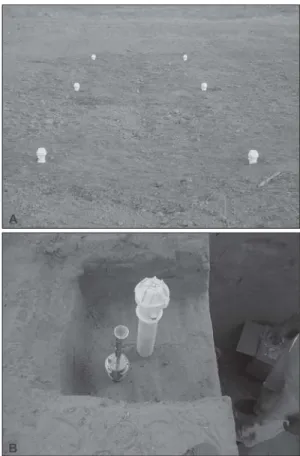
Six PVC plastic access tubes were installed us-ing a 5 × 2 m spacing (Figure 1a). The installation of the tubes was made following the procedures suggested by the manufacturer (Sentek, 2000) to ensure good contact between the soil and the access tube wall. Briefly, the access tubes were driven into the soil in
≈0.15 m increments using a sledgehammer, extract-ing the soil inside the tubes with a 47 mm soil auger. This procedure reduces air gaps and variations in soil bulk density adjacent to the access tubes. Tubes were 1.5 m long with internal and external diameters of 51 and 56.5 mm. After the installation, 4 cm of the ac-cess tubes were left above the soil surface to prevent water entrance. A plastic top cap was firmly fitted to the upper end of each access tube. After 15 days, three trenches (3 × 1.5 × 1.5 m) were excavated about 0.4 m away from each access tube.
As recommended by the manufacturer (Sentek, 2001), three moisture levels: saturated, moist and dry were used to cover the soil water content range at the site. Two access tubes were installed for each moisture level. For the saturated level, approxi-mately 200 L of water were applied in a cylindric infiltrometer (0.5 m ∅) so that the wetted front passed the 1.0 m soil depth. For the intermediate level the amount of applied water was reduced by half. Since the experiment was carried out in the end of dry pe-riod (November), no addition of water was required for the dry level.
Sampling procedure and calibration
Three scaled frequency (SF) readings per tube
were recorded at depth intervals of 0.1 m, down to 1.0 m. Immediately after the readings, a soil platform at each 0.1 m depth increment was made to determine
Table 1 - Selected physical and chemical properties from a Rhodic Paleudult in Teresina, Brazil (12/13/2005).
†Soil bulk density; *Organic matter. h
t p e
D Layer Granulometry ρ† O.M.* Texturalclass d
n a
S Sitl Clay
) m
( gkg-1 kgm-3 gdm-3
5 1 . 0 -0 0 .
0 Ap 785.8 78.5 136.0 1.63 9.25 Loamysand
5 3 . 0 -5 1 .
0 A12 675.5 98.5 226.0 1.71 9.76 Sandyclayloam 5
6 . 0 -5 3 .
0 Bt12 606.5 97.5 296.0 1.54 6.59 Sandyclayloam 5
6 . 0
the soil gravimetric water content and bulk density. Soil core samples around the tube were collected and kept in an aluminum can. To determine the bulk den-sity, two undisturbed soil samples were carefully col-lected by using rings (52.4 mm ∅ by 48.7 mm high) placed horizontally in such a way that the center of sampling ring was in the middle of each layer and at a distance of about 8 cm from the of tube (Figure 1b). Oven drying was made at 105oC for 48 hours. Regression analyses were conducted using SF
read-ings and their corresponding volumetric soil water content for each sampling depth as well as for the entire profile using the software TableCurve v.5.01 (SYSTAT Software Inc., San Jose, CA, USA). A t test was used to verify whether the means of esti-mated soil water content (θ) were different when dif-ferent calibrations curves are used for the whole soil profile.
RESULTS AND DISCUSSION
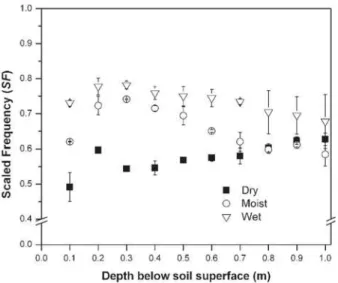
The SF values corresponded to the chosen soil
moisture levels, i.e., 0.57 (dry), 0.65 (moist) and 0.74 (saturated), confirming that the methodology was ad-equate to obtain SF values in a wide range of soil
wa-ter contents (0.068 to 0.264 m3 m-3, Figure 2). The highest and lowest SF values were 0.7819 (saturated,
0.3 m depth) and 0.4916 (dry, 0.1 m depth). At the 0.2 m depth, there was a peak in SF values for all
moisture levels, probably influenced by soil compac-tion. Because of this, an individual calibration for each soil may be more accurate (Baumhardt et al., 2000; Leib et al., 2003).
Individual calibrations per depth (Table 2) im-proved almost all correlation coefficients and mini-mized the Root Mean Square Error (RMSE) when compared to a unique calibration for the entire profile (0 - 1.0 m). Exceptions were at 0.9 and 1.0 m depth,
Table 2 - Calibration equations for the capacitance probe for different soil layers using a power model.
†The coefficients a and b are for the calibration θ = a SFb, where SF, θ, and N are the scaled frequency readings, the soil water content (m3 m-3), and the number of samples used per analysis, respectively. ‡One outlier data point was disregarded. *RMSE = Root Mean Square Error.
n o z i r o
H a† b R2 RMSE* N Soliwatercontentrange
w o
L High
m --- m3m-3---------
-1 .
0 ‡ 0.742 3.782 0.98 0.011 5 0.067 0.233
2 .
0 0.503 3.144 0.98 0.009 6 0.098 0.247
3 .
0 0.457 2.553 0.98 0.009 6 0.099 0.264
4 .
0 0.484 2.596 0.99 0.007 6 0.101 0.252
5 .
0 0.506 2.707 0.93 0.017 6 0.104 0.242
6 .
0 0.542 2.923 0.97 0.011 6 0.104 0.238
7 .
0 0.524 2.923 0.94 0.014 6 0.104 0.221
8 .
0 0.476 2.640 0.92 0.013 6 0.116 0.216
9 .
0 0.527 3.051 0.90 0.012 6 0.116 0.210
0 .
1 0.503 2.813 0.56 0.021 6 0.121 0.198
0 . 1
-0 0.492 2.757 0.93 0.014 59 0.067 0.264
probably due to the low range between saturated and dry soil as well as the high SF deviation observed for
the saturated soil (Figure 2). However, within the 1.0 m soil depth, the mean estimated (θ) with individual calibration for each depth was not different (P > 0.05)
from that of the entire soil profile (θ= 0.492 SF 2.757).
Table 3 shows the differences between the lo-cal lo-calibration, the manufacturer lo-calibration and other previous field calibrations (Morgan et al., 1999; Fares et al., 2004). The power model for the local calibra-tion had a high correlacalibra-tion coefficient as compared to the other field calibrations, but the RMSE was higher than that obtained by Morgan et al. (1999).
Values of θestimated with the manufacturer calibration were not different from those estimated with the local calibration equation (P > 0.05)
accord-ing to the t-test. The mean difference was 0.014 m3 m-3. The acceptable performance of the manufacturer calibration was, probably, because it was based on data from samples of sand and sandy loam soil textural classes, very similar to those used in this experiment.
The manufacturer calibration resulted in a 9.24% underestimation when compared to the local
Table 3 - Data source, equations, coefficients of determination (R2), root mean square errors (RMSE), and the number of observations (N) from different calibrations developed for capacitance probes under field conditions.
1where SF and θ are the scaled frequency readings and the estimated soil water content (m3 m-3). e c r u o s a t a
D Equation1 R2 RMSE N
n o i t a r b il a c r e r u t c a f u n a
M θ =0.494SF3.017 0.99 -
-) 9 9 9 1 ( .l a t e n a g r o
M θ =0.451SF2.121 0.83 0.008
-) 4 0 0 2 ( .l a t e s e r a
F θ =0.440SF1.549-0.040 0.88 0.029 60
n o i t a r b il a c l a c o
L θ =0.492SF2.757 0.93 0.014 59
Figure 2 - Scaled Frequency (SF) through the soil profile (0.1-1.0 m) under three soil moisture levels (dry, moist, saturated). Symbols represent averages of two data points. Standard deviations around the mean are also indicated.
Figure 3 - Calibration of Diviner 2000 capacitance probe in a Rhodic Paleudult of the Piaui State in the 0.068 to 0.264 m3 m-3θ range and soil water trends estimated by the manufacturer calibration.
calibration (Figure 3). Despite the suitable results by the t-test and by the small mean difference, an under-estimation in θcanencourage slight over-irrigation if absolute soil water content values are used. Moreover, individual calibrations for each depth in the soil pro-file improve correlation coefficients. Thus, site-specific calibration improves the accuracy of soil water moni-toring and is recommended especially for areas in the Northeast of Brazil that have a limited water supply.
ACKNOWLEDGEMENTS
To CNPq and the Piaui Research Foundation (FAPEPI) for financial support.
REFERENCES
BASTOS, E.A.; ANDRADE JÚNIOR, A.S. Dados agrometeorológicos para o município de Teresina, PI (1980-1999). Teresina: Embrapa Meio-Norte, 2000. 25p. (Embrapa Meio-Norte. Documentos, 47).
BAUMHARDT, R.L.; LASCANO, R.J.; EVETT, S.R. Soil material, temperature, and salinity effects on calibration of multisensor capacitance probes. Soil Science Society of America Journal, v.64, p.1940-1946, 2000.
FARES, A.; BUSS, P.; DALTON, M.; EL-KADI, A.I.; PARSONS, L.R. Dual field calibration of capacitance and neutron soil water sensors in a shirinking-swelling clay soil. Vadose Zone Journal, v.4, p.1390-1399, 2004.
GARDNER, C.M.K.; BELL, J.P.; COOPER, J.D; DEAN, T.J.; HODNETT, M.G.; GARDNER, N. Soil water content. In: SMITH, R.A.; MULLINGS, C.E. (Ed.) Soil analysis: physical methods. New York: Marcel Dekker, 1991. cap.1, p.1-73. GROVES, S.J.L; ROSE, S.C.L. Calibration equations for Diviner
2000 capacitance measurements of volumetric soil water content of six soils. Soil Use and Management, v.20, p.96-97, 2004.
HENG, L.K.; CAYCI, G.; KUTUK, C.; ARRILLAGA, J.L.; MOUTONNET, P. Comparison of soil moisture sensors between neutron probe, Diviner 2000 and TDR under tomato crops. In: SYMPOSIUM OF TOWARDS INTEGRATED SOIL, WATER AND NUTRIENT MANAGEMENT IN CROPPING SYSTEMS: THE ROLE OF NUCLEAR TECHNIQUES, 59., Bangkok, 2002. Proceedings. Bangkok: Soil Science, 2002. (CD-ROM). LEIB, B.G.; JABRO, J.D.; MATTHEWS, G.R. Field evaluation and performance comparation of soil moisture sensors. Soil Science, v.168, p.396-408, 2003.
Received March 22, 2006 Accepted September 03, 2007
MORGAN, K.T.; PARSONS, L.R.; WHEATON, T.A.; PITTS, D.J.; OBREZA, T.A. Field calibration of a capacitance water content probe in fine sand soils. Soil Science Society of America Journal, v.63, p.987-989, 1999.
PALTINEANU, I.C; STARR, J.L. Real-time soil water dynamics using multisensor capacitance probes: laboratory calibration.
Soil Science Society of America Journal, v.61, p.1576-1585, 1997.
SENTEK. Calibration of Sentek Pty Ltd soil moisture sensors. Stepney: Sentek Pty Ltd., 2001.
SENTEK. Diviner 2000: user guide version 1.21. Stepney: Sentek Pty Ltd., 2000.