ACPD
8, 18457–18497, 2008Contribution of processes affecting
atmospheric dynamics
M. Gonc¸alves et al.
Title Page
Abstract Introduction
Conclusions References
Tables Figures
◭ ◮
◭ ◮
Back Close
Full Screen / Esc
Printer-friendly Version
Interactive Discussion
Atmos. Chem. Phys. Discuss., 8, 18457–18497, 2008 www.atmos-chem-phys-discuss.net/8/18457/2008/ © Author(s) 2008. This work is distributed under the Creative Commons Attribution 3.0 License.
Atmospheric Chemistry and Physics Discussions
This discussion paper is/has been under review for the journalAtmospheric Chemistry
and Physics (ACP). Please refer to the corresponding final paper inACPif available.
Contribution of atmospheric processes
a
ff
ecting the dynamics of air pollution in
south-western Europe during a typical
summertime photochemical episode
M. Gonc¸alves1, P. Jim ´enez-Guerrero2, and J. M. Baldasano1,2
1
Projects Engineering Department, Technical University of Catalonia, Barcelona, Spain
2
Barcelona Supercomputing Center, Barcelona, Spain
Received: 15 July 2008 – Accepted: 25 August 2008 – Published: 23 October 2008
Correspondence to: J. M. Baldasano ([email protected])
ACPD
8, 18457–18497, 2008Contribution of processes affecting
atmospheric dynamics
M. Gonc¸alves et al.
Title Page
Abstract Introduction
Conclusions References
Tables Figures
◭ ◮
◭ ◮
Back Close
Full Screen / Esc
Printer-friendly Version
Interactive Discussion
Abstract
The southern Mediterranean region frequently experiences critical levels of
pho-tochemical pollutants during summertime. In order to account for the
contribu-tion of different atmospheric processes during this type of episodes, the
WRF-ARW/HERMES/CMAQ modelling system was applied with high resolution (1 km2, 33
5
sigma vertical layers, 1 h) to assess the different dynamics in a coastal environment
and an inland-continental zone: the North-eastern and Central Iberian Peninsula (NEIP and CIP, respectively). The former is characterized by a very complex terrain, while the
latter behaves as a flat area, which clearly affects the pattern of local flows. A
rep-resentative type of photochemical pollution episode (occurring over 78% of summer 10
days) which occurred during 17–18 June 2004 is selected as the study period. The CMAQ Integrated Process Rate provides the hourly contributions of atmospheric
pro-cesses to net O3, NOxand NMVOCs concentrations. The O3photochemical formation
occurs mainly in downwind areas from the main NOxemission sources during midday.
At surface level it accounts for 50 to 75µg m−3h−1. The urban areas and main roads,
15
as main sources of NOx emissions, act as O3 sinks, quenching up to −200µg m−
3
per hour during the traffic circulation peaks. The O3concentration gradient generated,
larger during daytime, increases the contribution of diffusion processes to ground-level
O3 (up to 200µg m−
3
h−1 fluxes, mainly from upper vertical layers). The maximum
positive contributions of gas-phase chemistry to O3occur in the coastal domain at high
20
levels, while in the continental domain they take place in the whole atmospheric column under the PBL. The transport of ozone precursors by advective flows sets the location
of the maximum O3 surface concentrations. The O3 chemical formation involves the
oxidation of less NMVOCs in the NEIP than in the CIP domains, due to differences in
chemical sensitivity between these areas. The dry deposition is an important sink in the 25
lowest layer of the model, together with vertical diffusion flows. Finally, the contributions
ACPD
8, 18457–18497, 2008Contribution of processes affecting
atmospheric dynamics
M. Gonc¸alves et al.
Title Page
Abstract Introduction
Conclusions References
Tables Figures
◭ ◮
◭ ◮
Back Close
Full Screen / Esc
Printer-friendly Version
Interactive Discussion
nor cloudiness. This process analysis provides new quantitative information about the
origin of the peaks of O3and its precursors, aiding the design of abatement strategies
in south-western Europe.
1 Introduction
Atmospheric chemistry transport model simulations suggest that summertime O3 is
5
enhanced in the entire Mediterranean troposphere, contributing substantially to the ra-diative forcing of climate and air quality issues (Lawrence et al., 1999; Hauglustaine and Brasseur, 2001; Jim ´enez et al., 2006). Specifically the south-western Europe and the Iberian Peninsula (IP) frequently experience photochemical pollution episodes
during summertime, in which O3 and PM10 exceedances of the European air quality
10
targets are registered. Atmospheric modelling is a fundamental tool to assess the air quality levels in these situations. Nevertheless, the air quality models usually provide the net concentration of pollutants, without the capabilities of understanding and isolat-ing the atmospheric processes involved, which would explain the reasons for a model’s
predictions and show the relative importance of each process (Jeffries and Tonnesen,
15
1994; Jang et al., 1995a, b). For the Mediterranean area, these issues have been stud-ied by measurement campaigns, but also combining both modelling and experimental techniques (e.g. Mill ´an et al., 1996; 1997; Lelieveld et al., 2002; Lawrence et al., 2003; Roelofs et al., 2003; Cros et al., 2004; Dufour et al., 2005; Jonson et al., 2006, among others). Currently, some Eulerian grid models, such as the Models-3 Community Mul-20
tiscale Air Quality Model – CMAQ (Gipson, 1999), permits to assess the contribution
of different atmospheric processes to the net concentrations of pollutants.
This analysis is useful not only for a better understanding of the atmospheric be-haviour of an specific area, i.e. New York (Jang et al., 1995a, b) or the Puget Sound Region, USA (Jiang et al., 2002); but also for assessing which are the models or the 25
models’ configurations presenting better skills (Jeffries and Tonnesen, 1994; O’Neil
ACPD
8, 18457–18497, 2008Contribution of processes affecting
atmospheric dynamics
M. Gonc¸alves et al.
Title Page
Abstract Introduction
Conclusions References
Tables Figures
◭ ◮
◭ ◮
Back Close
Full Screen / Esc
Printer-friendly Version
Interactive Discussion
on episodic events (San Jos ´e et al., 2002; O’Neil and Lamb, 2005), although annual (Zhang et al., 2006) and even climatologic simulations (Hogrefe et al., 2005) have been also performed.
This work pretends to assess and quantify the contribution of different atmospheric
processes to the concentration of O3 and its precursors in south-western Europe by
5
means of the Integrated Process Rate (IPR) analysis tool available in the CMAQv4.6
model. In order to highlight the different behaviour of atmospheric dynamics in a coastal
environment and an inland-continental zone, the North-eastern and Central Iberian Peninsula domains (NEIP and CIP, respectively) have been selected. These areas
show different topographic patterns, the former being a coastal region characterized by
10
a very complex terrain and the latter a continental inner region with a much simpler
to-pography, which brings different locally-driven flows. Moreover, they house the largest
Spanish urban centres, Barcelona and Madrid, and therefore photochemical pollution
episodes are of special concern by their direct effects on population.
2 Methods
15
2.1 Modeling system
The WRF-ARW/HERMES-2004/CMAQ modelling system is applied with high spatial
(1 km2) and temporal resolution (1 h) to the study areas. The fine scale used is
essen-tial in complex terrains such as those studied (Jim ´enez et al., 2005, 2006).
The Weather Research and Forecasting (WRF) Model (Michalakes et al., 2005; Ska-20
marock et al., 2005) provides the meteorology parameters as inputs to CMAQ. The ini-tial and boundary conditions are obtained from the National Centers for Environmental Prediction (NCEP) reanalysis data (available at the standard pressure levels for every
6 h with 0.5×0.5 degree resolution). Four nested domains are defined over each study
area (Table 1), covering the final domains (D4; Fig. 1): the NEIP (322×259 km2) and
25
ACPD
8, 18457–18497, 2008Contribution of processes affecting
atmospheric dynamics
M. Gonc¸alves et al.
Title Page
Abstract Introduction
Conclusions References
Tables Figures
◭ ◮
◭ ◮
Back Close
Full Screen / Esc
Printer-friendly Version
Interactive Discussion
(up to 50 hPa≈20 km), with 12 layers under the PBL.
The High Elective Resolution Emission Modelling System (HERMES) has been
de-veloped for Spain with a high spatial (1 km2) and temporal (1 h) resolution (Baldasano
et al., 2008). This model focuses on the estimation of gas and particulate matter pol-lutants, including the ozone precursors. HERMES considers the emissions from the 5
following sources:
1. power generation plants,
2. industrial installations,
3. domestic and commercial fossil fuel use,
4. domestic and commercial solvents use, 10
5. road transport,
6. ports,
7. airports and
8. biogenic emissions;
using a bottom-up approach except for the domestic and commercial fossil fuel use, 15
where a top-down approach was adopted and regional emissions were allocated to fine grid cells by surrogate indexes. It follows the methodologies and criteria of previ-ous emission models developed for the eastern Iberian Peninsula: EMICAT2000 (Parra et al., 2004, 2006) and EMIVAL (Ar ´evalo et al., 2004). The reference year chosen is 2004, since it is the most recent year in which all the needed data for the HERMES 20
development are available. HERMES generates results according to the European En-vironmental Agency’s Selected Nomenclature for Air Pollution (SNAP). Furthermore, HERMES has the capacity of presenting results according to individual installations, industrial activities, land use classification or type of pollutant or process (fugitive, evap-orative, hot or cold emissions).
ACPD
8, 18457–18497, 2008Contribution of processes affecting
atmospheric dynamics
M. Gonc¸alves et al.
Title Page
Abstract Introduction
Conclusions References
Tables Figures
◭ ◮
◭ ◮
Back Close
Full Screen / Esc
Printer-friendly Version
Interactive Discussion
The chemistry transport model used to compute the concentrations of photochemi-cal pollutants is CMAQ (Byun and Schere, 2006). The initial and boundary conditions
were derived from a one-way nested simulation covering a domain of 1392×1104 km2
centred in the Iberian Peninsula, that used EMEP emissions for 2004, disaggregated
to 18 km. A 48-h spin-up was performed to minimize the effects of initial conditions for
5
the final domains. The chemical mechanism selected for the simulations following the criteria of Jim ´enez et al. (2003) was Carbon Bond IV (CBM-IV) (Gery et al., 1989) in-cluding aerosols and heterogeneous chemistry. The CMAQ model configuration uses the Yamartino-Blackman Cubic scheme (YAM) for the advection and convection
trans-port and the Eddy diffusion scheme for the vertical and horizontal diffusion. NOx and
10
volatile organic compounds (VOC) speciation of HERMES emissions are detailed in Parra et al. (2006). The vertical and horizontal resolution of the final domains (D4;
Fig. 1) are the same as those used in the meteorological simulation (1 km2, 33
verti-cal layers) and the species concentration and atmospheric processes contributions are estimated hourly.
15
The high resolution employed and the huge number of variables involved in the at-mospheric integrations (not only the pollutants concentrations, but also the process analysis) require high-performance computing. The availability of the MareNostrum supercomputer hold in the BSC-CNS, together with the advances in the parallelization of air quality codes, has allowed these simulations.
20
2.2 Integrated process rate (IPR)
The contributions of different processes are assessed by means of the Integrated
Pro-cess Rate (IPR) analysis available in the CMAQv4.6 model. It provides the effects of all
the physical processes and the net effect of chemistry on model predictions, which is
the fraction of the mass or concentration in each model cell (or group of cells) in terms 25
of the process that gave rise to this portion of the mass or concentration. More details
can be found in Jeffries and Tonnesen (1994); Jang et al. (1995a, b) and Gipson (1999).
ACPD
8, 18457–18497, 2008Contribution of processes affecting
atmospheric dynamics
M. Gonc¸alves et al.
Title Page
Abstract Introduction
Conclusions References
Tables Figures
◭ ◮
◭ ◮
Back Close
Full Screen / Esc
Printer-friendly Version
Interactive Discussion
gas-phase chemistry, the net transport (horizontal and vertical advection), horizontal
and vertical diffusion, emissions, dry and wet deposition and clouds interactions
contri-butions to the net concentration of pollutants. The main assumptions of the modelling system are summarized below in order to clarify the subsequent discussion of results (Gipson, 1999):
5
1. Net transport: It considers horizontal and vertical advection sum, which is the transport of pollutants due to the mean wind fields. The advection scheme used is globally mass-conserving. The horizontal advection is estimated by the YAM scheme (Yamartino, 1993), deriving a vertical velocity component at each grid cell that satisfies the mass continuity equation using the driving meteorology model’s 10
air density. The vertical advection module works with no mass-exchange
bound-ary conditions at the bottom or top of the model. In this work the net effect of
horizontal and vertical advection is considered to obtain comparable contributions with the rest of the processes. As already pointed out by Jiang et al. (2003), in some cases it could be more meaningful to aggregate the contributions of several 15
processes instead of considering each of them separately.
2. Gas phase chemistry: CBM-IV mechanism is used with the Euler Backward Iter-ative (Hertel et al., 1993) solver.
3. Diffusion: The diffusion involves sub-grid scale turbulent mixing of pollutants.
Hor-izontal diffusion is estimated by a diffusion coefficient based on local wind
defor-20
mation. Vertical diffusion is estimated using the Eddy diffusivity theory.
4. Dry deposition: The deposition process is simulated as a flux boundary condition
that affects the concentration in the lowest layer.
5. Clouds chemistry and wet deposition: Clouds play a key role in aqueous chemical reactions, vertical mixing of pollutants and removal of pollutants by wet deposition. 25
They also indirectly affect the concentration of pollutants by altering the solar
ACPD
8, 18457–18497, 2008Contribution of processes affecting
atmospheric dynamics
M. Gonc¸alves et al.
Title Page
Abstract Introduction
Conclusions References
Tables Figures
◭ ◮
◭ ◮
Back Close
Full Screen / Esc
Printer-friendly Version
Interactive Discussion
of biogenic emissions. CMAQ models sub-grid convective precipitating clouds, sub-grid non-precipitating clouds, and grid-resolved clouds. The cloud module vertically redistributes pollutants for the sub-grid clouds, calculates in-cloud and precipitation scavenging, performs aqueous chemistry, and accumulates wet de-position amounts. The used scheme is a RADM based cloud processor that uses 5
the asymmetric convective model to compute convective mixing.
6. Aerosols: The third generation aerosol module takes chemical species concen-trations and reactivity rates from the chemistry solvers and primary particulate concentrations from the emissions processor to compute fine and coarse particu-late concentrations. The primary aerosols emissions are estimated by HERMES, 10
not taking into account marine aerosols. The deposition velocity for particles is estimated from the aerosol size distribution, which is calculated from the mass
and number concentration for each of the modes considered: Aitken (0–0.1µm),
accumulation (0.1–2.5µm), and coarse (2.5–10µm)
The contribution of processes in this work is analyzed in several ways: 15
2.2.1 Analysis focused on model evaluation
The contribution of processes to the concentration of gaseous pollutants in the low-est vertical level is assessed for specific points in the domains, coincident with the location of characteristic air quality stations (AQS): rural background AQS and urban
background AQS. The contributions are obtained as concentration (µg m−3) variation
20
for the surface cell. The weighted contributions are also obtained taking into account
the Eq. (1), where: %PCi is the relative contribution of thei process to the net fluxes
from or to the specific cell or domain (including chemical contributions) and PCj is the
contribution of each process, beingj=gas-phase chemistry, transport (horizontal plus
vertical advection), emissions, horizontal and vertical diffusion, dry deposition, clouds
ACPD
8, 18457–18497, 2008Contribution of processes affecting
atmospheric dynamics
M. Gonc¸alves et al.
Title Page
Abstract Introduction
Conclusions References
Tables Figures
◭ ◮
◭ ◮
Back Close
Full Screen / Esc
Printer-friendly Version
Interactive Discussion
processes and aerosols processes.
%PCi=
PCi
P
j
abs PCj·100 (1)
Note that the sum of %PCi for alli is not 100%, being the sum of abs(%PCi) exactly
100%.
2.2.2 Analysis of the dynamics of pollutants during the episode
5
The processes are analyzed for the selected domains and up to the selected top of the atmosphere (33 sigma vertical layers up to 50 hPa) depicting contribution maps.
2.2.3 Analysis of specific locations with high O3levels during the episode
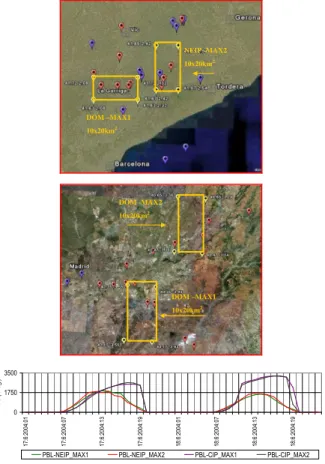
Finally, the contribution of the different processes is assessed for four selected
subdo-mains (20×10 km2) in which maximum O3 concentrations occur during the episode.
10
Positive and negative contributions expressed as pollutants density under the PBL
(height obtained from the model) in g m−2 are assessed for O3, NOx and NMVOCs
in each subdomain.
2.3 Domains description
The coastal domain (NEIP) covers 83 398 km2 and is located in the Mediterranean
15
littoral (Fig. 1 – left). It is characterized by a very complex terrain, dominated in the northern part by the Pyrenees mountains (up to 3400 m), and with two mountain chains parallel to the coast: the Pre-coastal (1000–1500 m height) and Coastal chains (500 m average height). The Ebro valley is located in the Southern region and acts as an important channel for local wind flows. The Central Plateau covers the inland area. 20
ACPD
8, 18457–18497, 2008Contribution of processes affecting
atmospheric dynamics
M. Gonc¸alves et al.
Title Page
Abstract Introduction
Conclusions References
Tables Figures
◭ ◮
◭ ◮
Back Close
Full Screen / Esc
Printer-friendly Version
Interactive Discussion
area; and the road network connecting the Iberian Peninsula with France, all of them located along the coastal axis. Also inland some industrial areas have an important contribution to pollutants emissions (i.e. the Cercs power plant). The HERMES model
estimates 299 t d−1of NOxemitted during the episode, being 57% produced by on-road
traffic, which constitutes the main source of primary pollutants in the region (Costa and
5
Baldasano, 1996; Parra et al., 2006; Baldasano et al., 2008), contributing also by 24%
of the 692 t d−1of NMVOCs emitted in the coastal domain. In this particular case 48%
comes from biogenic sources. The industrial and power generation sectors are the
main emitters of SO2and primary particles, accounting for 94% and 71% of the mass
emissions (125 t d−1, 45 t d−1), respectively.
10
The continental (CIP) domain covers an area of 38 734 km2 in the centre of the
Iberian Peninsula (Fig. 1 – right). The main topographic features in the region are the Central System located in the north-western area of the domain, with summits reaching
2500 m, and the Tajo valley in the southern area. Both clearly affect the wind flows
dur-ing the episode, characterized by the dominance of mesoscale phenomena. The main 15
emission sources in the region are the Madrid urban area, the Spanish administra-tive capital, which accounts for 5.8 million inhabitants; the road network that connects Madrid with surrounding conurbations and several industrial sources, mainly located in the south-western part of the domain. The HERMES emissions model indicates that
on-road traffic accounts for 75% of total NOx emissions within the region (231 t d−1),
20
and 19% of NMVOCs (790 t d−1 in the whole area), being the biogenic sources the
main contributors to these primary pollutants (64%). Industrial and power generation
emissions of SO2and primary particulate matter account for 90% and 65% of the total
emissions (66 t d−1and 36 t d−1, respectively).
2.4 Episode selection
25
condi-ACPD
8, 18457–18497, 2008Contribution of processes affecting
atmospheric dynamics
M. Gonc¸alves et al.
Title Page
Abstract Introduction
Conclusions References
Tables Figures
◭ ◮
◭ ◮
Back Close
Full Screen / Esc
Printer-friendly Version
Interactive Discussion
tions dominate 45% of the annual and 78% of the summertime transport patterns over the coastal Mediterranean areas (Jorba et al., 2004) and 36% of the annual and 45% of the summertime situations in the central-continental areas of the Iberian Peninsula. They are frequently associated with local-to-regional episodes of air pollution related
to high levels of O3during summer (e.g. Toll and Baldasano, 2000; Barros et al., 2003;
5
Ortega et al., 2004; Taghavi et al., 2004; Cousin et al., 2005; Coll et al., 2005; Jim ´enez et al., 2006, among others), being the study case one of the most polluted episodes of 2004 in the considered areas. The weak synoptic forcing and the stagnant conditions dominate the Iberian Peninsula. Therefore the mesoscale phenomena induced by the particular topography of the regions control the superficial wind flows. In these condi-10
tions the sea breezes and mountain-valley winds, and the development of the Iberian thermal low are characteristic features of the region (Jorba et al., 2004). The main pro-cesses inland are the convective circulations developed by the surface heating and the formation of compensatory subsiding flows in coastal areas (Mill ´an et al., 1997; P ´erez et al., 2004).
15
3 Results and discussion
3.1 Summary of the model evaluation for the 17–18 June 2004 episode
The surface concentrations of pollutants predicted by the WRF-ARW/HERMES/CMAQ model are evaluated against hourly data from 45 AQS (provided by the Environmental Departments of the Catalonia and Madrid Governments, Spain). The evaluation results 20
for O3accomplish the recommendations of the European Union, set by the European
Directives 1999/30/EC and 2002/3/EC (uncertainty of 50% for the air quality objec-tive for modelling assessment methods), and the US Environmental Protection Agency
guidelines (US-EPA, 1991, 2005), which suggest values of±10–15% for the mean
nor-malized bias error (MNBE),±15–20% for the unpaired peak prediction accuracy (UPA)
25
ACPD
8, 18457–18497, 2008Contribution of processes affecting
atmospheric dynamics
M. Gonc¸alves et al.
Title Page
Abstract Introduction
Conclusions References
Tables Figures
◭ ◮
◭ ◮
Back Close
Full Screen / Esc
Printer-friendly Version
Interactive Discussion
prescribed threshold to be met by simulated O3to be considered for regulatory
applica-tions. The averaged MNBE for O3is 7.95%; the MNGE, 25.89% and the UPA,−0.39%
(Table 2). Moreover, the modelled NO2, SO2and PM10surface levels agree with
obser-vations, with values for these statistical parameters lower or around 50%. The largest
deviations are observed in the NO2 predictions accounting for 50.92% MNGE,
never-5
theless the reliability of the modelling system is acceptable being MNBE and the UPA
−12.68% and −28.35%, respectively; and the average absolute error and the mean
bias accounting for 27µg m−3and−16µg m−3, respectively.
The O3 concentrations are overpredicted by the model both in the NEIP and CIP
domains (Table 2), being the average normalized bias 5.85% in the former and 12.98% 10
in the latter. Previous studies (Jim ´enez et al., 2006) point that under low pressure gra-dient situations mesoscale models tend to underestimate daytime wind flows, which
would favour the O3 accumulation. The O3peaks are overestimated in the CIP (UPA:
11.02%), while an underprediction is assessed for the NEIP domain (UPA:−5.18%).
The flow patterns in both domains differ, presenting the NEIP a very complex behaviour,
15
with layering of pollutants and multiday accumulations that may be not accurately re-produced by the model, causing this underprediction in peak concentrations.
NO2 concentrations are overpredicted in the CIP domain (positive bias of 5.89%),
which can be attributed to the weaknesses of the model to represent wind flows un-der this low pressure gradient situation. The unun-derprediction in the coastal domain 20
(MNBE: −27.12%) could be related with inaccuracies in the modelled chemical
be-haviour, linked to O3chemistry that may be causing also the high levels estimated for
this pollutant. The NO2peak concentrations are underestimated in both domains (UPA:
−26.3% in the CIP domain and−23.73% in the NEIP domain). Jim ´enez-Guerrero et
al. (2008) run the WRF-ARW/HERMES/CMAQ model for the NEIP indicating an under-25
prediction of NO2 due to the relatively low vertical resolution in the lower troposphere
that could generate an artificial vertical exchange between the boundary layer and the
free troposphere, enhancing the NOx venting. In this case, doubling the vertical
ACPD
8, 18457–18497, 2008Contribution of processes affecting
atmospheric dynamics
M. Gonc¸alves et al.
Title Page
Abstract Introduction
Conclusions References
Tables Figures
◭ ◮
◭ ◮
Back Close
Full Screen / Esc
Printer-friendly Version
Interactive Discussion
This fact suggests that discrepancies between modelled and measured levels do not only depend on transport patterns, but also on the chemical behaviour represented by the model.
The underestimation in SO2 concentrations in both domains (MNBE of −32.77%
and −41.73% in the NEIP and CIP domains, respectively) and in peak levels (UPA
5
of −29.23% and −47.53%) could reflect a slight underestimation on sulphur oxides
emissions.
On average, the PM10 concentrations are also slightly underpredicted (MNGE of
−15.86% and UPA −48.42%), which could be related not only to the inaccuracies in
representing accumulation and transport patterns during this low gradient pressure 10
situation, but also to the limitations related to the emissions model (HERMES) that does not take into account natural sources of primary particulates such as erosive or saltation processes or marine aerosols (Vautard et al., 2005).
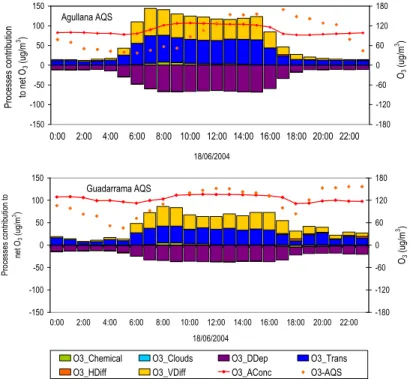
The contribution of processes in the first simulated layer (0–38 m a.g.l.) provides
useful information about the performance of the model for predicting surface O3
con-15
centrations. The surface O3concentration in rural background stations of the coastal
domain (such as Agullana, Ponts and Rub´ı) and the continental domain (i.e. SM
Valdei-glesias, Guadarrama and Buitrago de Lozoya) is overestimated during the morning and underestimated in the afternoon (the average bias is negative for the costal domain
sta-tions,−8.1%, −7.1% and −11.8%, respectively, and−8.01%, 10.27% and 2.21% for
20
the continental domain AQS aforementioned). The representative sites selected reflect a common behaviour (see Fig. 2) independently of their location, which may indicate
slight deviations in modelled advection fluxes. The vertical diffusion accounts for 33%
of the net processes contribution to the surface cells, but is compensated by 32% re-moval of dry deposition. The processes controlling the total change in these cells’ 25
concentration are the net transport term (horizontal+ vertical advection, accounting
on average for 8%) and chemical production (7%). If the vertical transport (diffusion+
de-ACPD
8, 18457–18497, 2008Contribution of processes affecting
atmospheric dynamics
M. Gonc¸alves et al.
Title Page
Abstract Introduction
Conclusions References
Tables Figures
◭ ◮
◭ ◮
Back Close
Full Screen / Esc
Printer-friendly Version
Interactive Discussion
viations in model predictions on the coastal domain stations occur specifically in the 16:00 to 20:00 UTC period, when the daytime breezes decrease and the land breezes and night-time winds start developing. The surface winds during this period are over-estimated by the meteorological model which in turn favours pollutants venting in the chemistry transport model simulation. In the CIP concentrations are underestimated 5
from 10:00 UTC, but maximum deviations are found in the 19:00–22:00 UTC period. Previous works confirm the trend of the mesoscale meteorological models, and specifically the WRF-ARW, to underpredict the land breezes and underestimate the advective flows in the latter hours of the day (Jim ´enez-Guerrero et al., 2008), which
causes overprediction in O3concentrations during night-time. The average processes
10
contributions to net O3 concentrations assessed during this period indicates that net
transport accounts for 56% and chemical destruction for−26%, when considering the
combined effect of vertical processes (vertical diffusion+dry deposition).
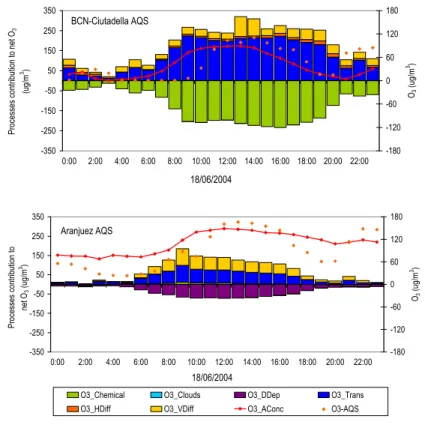
In the locations of urban background stations (such as Barcelona-Ciutadella and
Tarragona in the NEIP, or Aranjuez and Chapineria in the CIP) the modelled O3has a
15
similar behaviour (Fig. 3). Albeit during the morning there is an overestimation trend, during the afternoon and night-time the model predictions are frequently below the
measured levels. The chemical regime in the NEIP domain involves O3photochemical
destruction in the first layer accounting for −46% of net night-time fluxes and −44%
of net daytime fluxes on average, when considering the vertical fluxes as a whole 20
(being the sum of vertical diffusion and dry deposition a positive term that accounts
for 10% and 13%, respectively). In the CIP the periods of O3 net formation occur in
the first vertical layer during daytime, not existing in the urban background stations
of the NEIP. On average the net effect of daytime gas phase chemistry accounts for
−5% of total fluxes of O3. The main positive contributions come from net transport,
25
involving 86% of net concentration variation in the surface cells. During night-time
main sinks of O3 are chemical destruction (−27%) and the vertical flux term (vertical
diffusion plus dry deposition, that combined remove −12% of net O3 fluxes). In the
ACPD
8, 18457–18497, 2008Contribution of processes affecting
atmospheric dynamics
M. Gonc¸alves et al.
Title Page
Abstract Introduction
Conclusions References
Tables Figures
◭ ◮
◭ ◮
Back Close
Full Screen / Esc
Printer-friendly Version
Interactive Discussion
even during daytime, probably due to the O3titration by NOxemissions. On-road traffic
plays an important role in this sense being the major NOx emitter the Barcelona city
area.
This behaviour is also reproduced by the model in urban stations such as
Barcelona-Eixample, Constant´ı or L’Hospitalet (NEIP) and Majadahonda, Coslada or Legan ´es
5
(CIP) where main contributions to surface O3 come from transport and vertical diff
u-sion, and the main sinks are gas-phase chemistry and dry deposition.
3.2 Dynamics of pollutants in the coastal and central south-western Mediterranean
The results of the photochemical simulations for the coastal and central-continental
domains show the maximum O3 concentrations occurring in downwind areas from
10
Barcelona (NEIP) and Madrid (CIP) conurbations after the maximum photochemical activity hours (Fig. 4). During the day the increase of the solar radiation and the
tem-perature (reaching 30–35◦C in both domains) promote the high levels of O3,
exceed-ing in some cases the population information threshold (180µg m−3). The gas-phase
chemistry accounts in these cases for 50 to 75µg m−3h−1 in the first layer cells. In
15
the urban areas and main roads, as main sources of NOx, chemical destruction of O3
occurs up to−200µg m−3per hour during the tra
ffic circulation peaks. The O3
concen-tration gradient generated in these areas, larger during daytime, increases the
contri-bution of diffusion processes to ground-level O3 (up to 200µg m−
3
h−1 fluxes, mainly
from upper vertical layers). Surface O3 concentrations are larger in the continental
20
than in the coastal domain. While in the NEIP the breezes and mountain-valley winds regime involves the accumulation and recirculation of pollutants aloft, in the CIP the main flows are dominated by thermal phenomena that transport pollutants within the convective recirculation cell. The PBL height reaches its maximum at midday, being higher in the central-continental domain – around 3200 m a.g.l. – than in the coastal 25
ACPD
8, 18457–18497, 2008Contribution of processes affecting
atmospheric dynamics
M. Gonc¸alves et al.
Title Page
Abstract Introduction
Conclusions References
Tables Figures
◭ ◮
◭ ◮
Back Close
Full Screen / Esc
Printer-friendly Version
Interactive Discussion
The emitted NOx and NMVOCs in the central-continental domain during the
morn-ing react formmorn-ing O3, the surface heating generates a convective cell and the
pho-tochemical pollution plume rises, reaching 2500–3000 m a.g.l. (Figs. 5–6) and moves
downwind, affecting the southern area during the 17 June and the eastern area on
the 18 June. The maximum surface O3concentrations occur at midday (from 13:00 to
5
16:00 UTC of 17 June and 12:00 to 14:00 UTC of 18 June). During the afternoon and dusk the convective cell weakens and falls over the Madrid downwind areas, the PBL
height reduction involves high O3surface concentrations even when the photochemical
production diminishes. At night-time, the O3generation ceases, and the concentration
of photochemical pollutants decays. The katabatic winds dominant in the Central sys-10
tem area enhance the effect of the wind shift, being the main flows channelled by the
Tajo valley towards the south-western area (hourly maximum concentrations in this period are located in this area, see Fig. 4).
The coastal domain behaviour differs, being more favourable to several days
pho-tochemical episodes, due to the reservoir layers formed over the Mediterranean Sea 15
during night-time (Figs. 5–6). Specifically, the main emission sources are located in the coastal area. When the mesoscale phenomena dominate the pollutants transport, the breeze regime development in during the morning transports the primary pollutants inland. The littoral mountain chain acts as a barrier at dawn, recirculating the pollutants towards the Mediterranean Sea; these return flows are enhanced by the development 20
of anabatic winds. As the day advances the sea breeze regime develops and reaches the Pre-littoral chain, higher than the previous (1000–1500 m), producing a second recirculation flow aloft. On the other hand, the river valleys and main roads act chan-nelling the pollutants flow inland. The pollution plume reaches flat inland areas, where it accumulates during the afternoon and dusk, because of the Pyrenees barrier cutting 25
the flows to the northern area. In fact maximum O3surface concentrations during the
ACPD
8, 18457–18497, 2008Contribution of processes affecting
atmospheric dynamics
M. Gonc¸alves et al.
Title Page
Abstract Introduction
Conclusions References
Tables Figures
◭ ◮
◭ ◮
Back Close
Full Screen / Esc
Printer-friendly Version
Interactive Discussion
the mesoscale wind regime shifts, katabatic winds and land breezes involve a return flow of the pollutants plume over the Mediterranean Sea. Moreover, previous studies (e.g. Jim ´enez et al., 2006) have detected a layer of pollutants outbreak in altitude with peninsular origin (3000–3500 m a.g.l.) that contributes in this kind of episodes to the high concentration of pollutants in the area.
5
On the other hand, the urban plume reactivity differs, being the Madrid airshed more
favourable to O3 formation in situ, while in Barcelona O3 titration by NOx emissions
involves a sink of O3in the surface layer. Formation occurs mainly in upper levels and
in areas located around 100 km away from the city (Fig. 5).
In summary, the main contributors to O3 surface concentrations are the net
trans-10
port and vertical diffusion, while the main sink is dry deposition. The wet deposition
and cloud processes are negligible during the episode, due to the low cloudiness and the absence of precipitation, typical in a summertime period such as the one studied. The aerosols interaction with photochemical gaseous pollutants is also negligible. The
chemical contribution differs depending on the location and the NOx-VOCs ratio. The
15
process analysis indicates that maximum chemical production of O3does not occur in
the first vertical layer of the model, but in layers aloft during the central hours of the
day (Fig. 5). This effect will be deeply discussed in the next section. The horizontal
and vertical advective transport determine the areas that will be affected by these
pol-lutants, being the transport patterns much simpler in the central domain than in the 20
coastal area, where stratified layers and accumulation of pollutants are frequent dur-ing summertime episodes with stagnant conditions, as shown in Fig. 6. The process analysis confirms the results of previous experimental and modelling studies carried out in these areas (e.g. Baldasano et al., 1994; Mill ´an et al., 1997; Soriano et al., 2001; P ´erez et al., 2004; Jim ´enez et al., 2006).
25
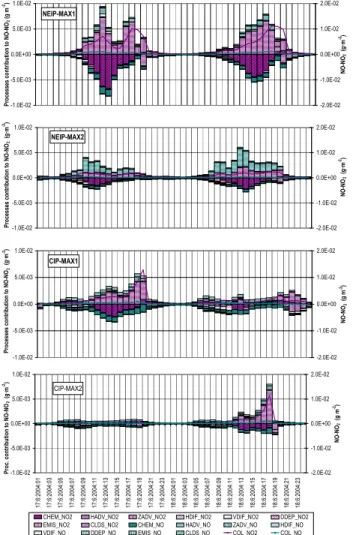
3.3 Processes contribution to O3-NOx-NMVOCs concentrations
In order to define the origins of maximum O3 concentrations in the coastal and
con-ACPD
8, 18457–18497, 2008Contribution of processes affecting
atmospheric dynamics
M. Gonc¸alves et al.
Title Page
Abstract Introduction
Conclusions References
Tables Figures
◭ ◮
◭ ◮
Back Close
Full Screen / Esc
Printer-friendly Version
Interactive Discussion
sidering the areas where the maximum concentrations are estimated by the model on
the first and second day of the episode, respectively (Fig. 7). The O3, NO, NO2 and
NMVOCs density (g m−2) in the atmospheric column under the PBL is assessed
to-gether with the contributions of different processes leading to these levels. All values
are obtained as an hourly average for the whole subdomain areas (200 km2). The
5
night-time modelled PBL height (Fig. 7) is near surface level (around 20 m a.g.l.), then the pollutants density and processes contribution are negligible versus those of daytime periods.
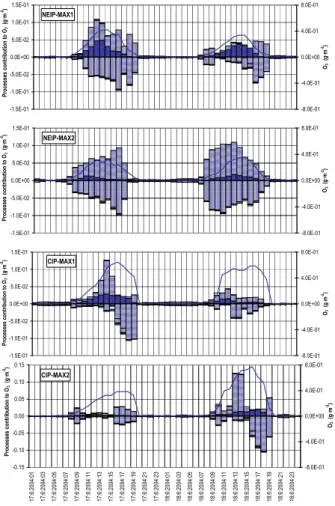
The O3 maximum concentrations during the 17 June occur in the MAX1 domains.
In the costal-MAX1 the horizontal advective transport to the area constitutes the ma-10
jor positive contribution to net O3 until 16:00 UTC (0.042 g m−2h−1 on average from
09:00 to 16:00 UTC). There is also a significant vertical advective transport removing
O3 from the PBL (−0.052 g m−
2
h−1). Later on, until 19:00 UTC, the horizontal
advec-tive flows remove O3from this area (0.057 g m−2h−1on average), due to the transport
of the pollutants plume towards the Mediterranean Sea. The O3 chemical production
15
from 07:00 UTC to 17:00 UTC is the second source of importance (0.019 g m−2h−1).
The continental-MAX1 domain presents a similar behaviour, being the horizontal
ad-vective transport the most important positive contribution to net O3until 15:00 UTC, on
average 0.042 g m−2h−1(Fig. 8). Then, the wind shift involves a negative contribution
of horizontal advection until 19:00 UTC (−0.079 g m−2h−1). In this case there are no
20
important vertical injections, being the contributions of vertical advection almost negli-gible compared to horizontal advection and chemical production (i.e. vertical transport
causes a removal of−0.006 g m−2h−1 on average in the 11:00 to 15:00 UTC period).
The complex topography in the coastal area explains, as already commented, the verti-cal transport flows of pollutants caused by the breeze regimes mechaniverti-cally enhanced 25
by the mountain chains located along the coast. Meanwhile, in the continental domain the vertical flows promote the transport of pollutants under the PBL; these are thermally produced and they have no orographic forcing involving injections in upper levels.
ACPD
8, 18457–18497, 2008Contribution of processes affecting
atmospheric dynamics
M. Gonc¸alves et al.
Title Page
Abstract Introduction
Conclusions References
Tables Figures
◭ ◮
◭ ◮
Back Close
Full Screen / Esc
Printer-friendly Version
Interactive Discussion
concentrations during the second day of the episode. As discussed for the first day,
the contributions to net O3 density are mainly transport; the continuous horizontal
advective flows involve high O3 densities in the coastal-MAX2 subdomain (horizontal
transport contributes on average with 0.064 g m−2h−1 during the 08:00 to 19:00 UTC
period). Once again, the vertical injections are the major sink of O3 in the region
5
(−0.062 g m−2h−1 on average). Chemical production in this case is lower than in
ar-eas nearer from the Barcelona urban area, such as MAX1 domain (0.009 g m−2h−1
on average), and the O3 concentrations estimated by the model are clearly affected
by horizontal advection. The continental-MAX2 domain is characterized by an impor-tant horizontal advection during the central hours of the day, from 12:00 to 15:00 UTC 10
contributing with 0.062 g m−2h−1on average; then the horizontal flows remove O3from
the domain (−0.078 g m−2h−1until 18:00 UTC). The relatively high O3density observed
from 14:00 to 16:00 UTC is due to the chemical production (0.015 g m−2h−1from 13:00
to 18:00 UTC) and the larger integration height (PBL height 3134 to 3220 m a.g.l. as observed in Fig. 7) considered.
15
The NEIP subdomains (coastal) are characterized by the low weight of emissions in
the NOx budget under the PBL (Fig. 9) when compared to CIP (continental).
Specifi-cally in the NEIP-MAX1, the horizontal advection is the main source of NO-NO2 until
16:00 UTC (3.4×10⁻⁴ and 0.0022 g m−2h−1, respectively) and chemical reaction
in-volves the main sink of these oxides (−4.4×10⁻⁴and−0.0016 g m−2h−1, respectively).
20
From then on the horizontal transport removes NO2and vertical transport from layers
above the PBL contributes positively until 18:00 UTC. While NO continues oxidizing and chemical destruction is still the main sink of this compound, from 18:00 to 20:00 UTC
net chemical production of NO2 in situ is observed (2.07×10−
4
g m−2h−1). The
min-imum NOx density observed on 17 June around 15:00–16:00 UTC reflects the direct
25
effect of the peaks of traffic emissions during the early morning and the afternoon in
closer areas (such as Barcelona city), which is the main origin of the advected NOx.
The CIP subdomains present a similar behaviour concerning NOx(Fig. 9), being the
ACPD
8, 18457–18497, 2008Contribution of processes affecting
atmospheric dynamics
M. Gonc¸alves et al.
Title Page
Abstract Introduction
Conclusions References
Tables Figures
◭ ◮
◭ ◮
Back Close
Full Screen / Esc
Printer-friendly Version
Interactive Discussion
NO and 0.0011 g m−2h−1 for NO2until 19:00 UTC) and the main sinks the gas-phase
chemical reactions (−5.810−4g m−2h−1and −4.2×10⁻⁴g m−2h−1, respectively).
Nev-ertheless the emissions of NO have limited importance in these subdomains, and specifically in the CIP-MAX1 domain, where NO emissions contribute with an
approx-imately constant density, from 04:00 UTC to 19:00 UTC (4.9×10⁻⁴g m−2h−1). The
in-5
crease in NO2density during the 15:00–18:00 UTC period due to the advective
trans-port and the lower chemical destruction may be related to the high O3 density
ob-served. The NOx levels in the central-MAX2 domain are low during the 17 June and
increase considerably by horizontal advection during the 18 June. In the early morning
(until 10:00 UTC) losses of NOx by vertical diffusion (−2.8×10−
5
g m−2h−1for NO and
10
−1.2×10⁻⁴g m−2h−1for NO2) to upper layers are estimated by the model.
In the coastal-MAX1 domain the NMVOCs levels are relatively high (Fig. 10).
Hor-izontal advection until 17:00 UTC (contributing on average with 7.5×10⁻⁵g m−2h−1)
and vertical advection from upper layers until 19:00 UTC (3.6×10⁻⁵g m−2h−1) are their
main sources. The daytime average contribution of emissions is low and accounts for 15
1.2×10⁻⁵g m−2h−1. During the morning, until 10:00 UTC, some NMVOCs are injected
in layers above the PBL by vertical diffusion (−1.5×10⁻⁵g m−2h−1) and vertical
advec-tive processes (−2.5×10⁻⁵g m−2h−1 on average until 16:00 UTC), involving a sink of
these organic compounds, together with chemical reaction (−1.3×10⁻⁵g m−2h−1 on
average during daytime). Nevertheless, the net transport (advection and diffusion)
in-20
volves a positive contribution during daytime on average of 3.8×10⁻⁵g m−2h−1. From
11:00 UTC the vertical diffusion contributes positively to the NMVOCs density under
the PBL, nevertheless its contribution is almost negligible compared to the net trans-port by advection. The NEIP-MAX2 behaviour is more homogeneous, being the hor-izontal advective flows the main contributors to net NMVOCs density under the PBL 25
(5.6×10⁻⁵g m−2h−1) and vertical advection the main sink (−3.8×10⁻⁵g m−2h−1),
to-gether with chemical reaction (−6.5×10⁻⁶g m−2h−1) and vertical diffusion specially
during the morning (−1.3×10⁻⁵g m−2h−1until 11:00 UTC).
ACPD
8, 18457–18497, 2008Contribution of processes affecting
atmospheric dynamics
M. Gonc¸alves et al.
Title Page
Abstract Introduction
Conclusions References
Tables Figures
◭ ◮
◭ ◮
Back Close
Full Screen / Esc
Printer-friendly Version
Interactive Discussion
largest contribution to net NMVOCs density under the PBL until 16:00 UTC (Fig. 10,
average contribution of 1.27×10⁻⁴g m−2h−1), then the winds shift removes these
com-pounds by the same process. The chemical destruction reaches its maximum during
the 14:00–15:00 UTC, accounting for−2.0×10⁻⁵g m−2h−1. Vertical advection and
dif-fusion remove NMVOCs from the PBL, but in a lower extent. The specific study area 5
is not characterized by a high emissions rate; therefore the contribution of this pro-cess is almost negligible compared to transport propro-cesses. The CIP-MAX2 presents
a similar behaviour during the 18 June, when it is directly affected by the horizontal
advective flows. The winds shift occurs one hour earlier, being the horizontal transport
the main sink of NMVOCs in the area from 16:00 UTC (−6.5×10⁻⁵g m−2h−1). The
10
maximum removal by chemical destruction also occurs in the 14:00–15:00 UTC period
(−1.7×10⁻⁵g m−2h−1).
Differences in chemical sensitivity are observed for the studied domains (Fig. 11).
The coastal domains present a similar chemical behaviour; the NMVOCs are the only
locally emitted precursors, which react with transported NOx generating O3 by
gas-15
phase chemistry. The CIP-MAX1 domain includes emitters of NOx and NMVOCs,
which react forming O3, nevertheless the O3 chemistry does not involve destruction
of NMVOCs in the same magnitude as the coastal domains. This is due to the more
NOx sensitive regime of this area. In absence of solar radiation, when the O3stopped
forming, the NO oxidation continues producing net NO2 (18:00–19:00 UTC period). In
20
the CIP-MAX2 domain the NMVOCs emissions are an important source, which from
10:00 to 19:00 UTC on 17 June are chemically destroyed, being the generation of O3
by chemistry relatively low. It could be explained by the absence of locally emitted
NOx and the slight contribution of net transport of these oxides in this specific day to
the area. On the second day of the episode the horizontal advection directly affect
25
the MAX2 involving a much higher net chemical production of O3, being the chemical
ACPD
8, 18457–18497, 2008Contribution of processes affecting
atmospheric dynamics
M. Gonc¸alves et al.
Title Page
Abstract Introduction
Conclusions References
Tables Figures
◭ ◮
◭ ◮
Back Close
Full Screen / Esc
Printer-friendly Version
Interactive Discussion
4 Conclusions
The Integrated Process Rate implemented in the CMAQ model was applied to obtain
quantitative information about atmospheric processes affecting the concentration of
pollutants in typical coastal and continental environments located in south-western Eu-rope: the North-eastern Iberian Peninsula (NEIP) and Central Iberian Peninsula (CIP) 5
domains, respectively. A representative summertime photochemical pollution episode characterized by stagnant conditions over the area was selected.
The model performance agrees with US-EPA and European Directives recommenda-tions, nevertheless specifically in background air quality stations tends to overestimate
the O3 morning concentrations and underestimate the O3levels during the afternoon.
10
The chemical destruction may be underpredicted during night-time, which favours the high estimated morning concentrations, while the overpredicted flows during the last hours of the day and night-time could cause an enhanced venting of pollutants. The mesoscale meteorological models have shown inaccuracies in predicting wind flows during the dominant stagnant conditions; they play a fundamental role in these devi-15
ations. NO2 is clearly linked to O3, with both inaccuracies in transport and chemical
behaviour being the main cause of the errors in the simulated concentrations. On the
other hand, O3peaks and NO2 underprediction in the coastal domain may be related
to difficulties for the model to define the accumulation layers formed and characteristic
recirculation of pollutants due to the very complex terrain. In the case of SO2and PM10
20
a slight underestimation of emissions could be the main cause for the underestimation of these pollutants.
Applying the Integrated Process Rate tool to the first vertical layer simulated provides information about the surface concentration of pollutants estimated by the model and permits to test the mass consistency. In order to perform a deeper study of the con-25
ACPD
8, 18457–18497, 2008Contribution of processes affecting
atmospheric dynamics
M. Gonc¸alves et al.
Title Page
Abstract Introduction
Conclusions References
Tables Figures
◭ ◮
◭ ◮
Back Close
Full Screen / Esc
Printer-friendly Version
Interactive Discussion
height.
The process analysis indicates that the maximum concentration of photochemi-cal pollutants occur due to transport phenomena. Specifiphotochemi-cally in the coastal domain
(NEIP), the high surface O3levels are not produced in situ, but come from horizontally
advected flows during the morning and gas-phase chemical contributions occurring 5
aloft. During the afternoon and dusk vertical advective flows inject the pollutants in lay-ers above the PBL, which accumulate due to the stagnant conditions over the region and contribute positively to surface concentrations the next simulated day. The
central-continental domain (CIP) behaviour slightly differs, with horizontal advection being also
the main contributor to O3 surface concentrations, but having the chemical formation
10
some importance at low levels. The transport patterns differ between the coastal and
the continental area, where the O3 precursors are homogeneously distributed in the
whole atmospheric column under the PBL and vertical injections of pollutants above the PBL are less frequent.
The dry deposition is an important sink for pollutants in the lowest layer of the model, 15
coupled in the present simulation with vertical diffusion flows. In spite of the
stag-nant conditions dominating during the episode, the diffusive processes contributions
to net pollutants concentrations under the PBL are relatively low, and in particular the
horizontal diffusion is negligible compared to other atmospheric processes. Vertical
diffusion compensates the loss of O3in surface layers due to NO titration, contributing
20
positively to net O3concentrations in the road network and urban areas. The O3peaks
at surface level are higher in the CIP domain, mainly due to the much simpler transport pattern compared to the coastal region, which involves that almost all the chemically
produced O3under the PBL contributes to surface concentrations when the convective
cell weakens. Controlling emissions of precursors in both domains is a decisive factor 25
in order to abate photochemical pollution episodes during summertime. The emitted NMVOCs have mainly a biogenic origin and therefore policies focused on reducing
NOx emissions must be addressed in these regions. Finally, the cloud processes, wet
ACPD
8, 18457–18497, 2008Contribution of processes affecting
atmospheric dynamics
M. Gonc¸alves et al.
Title Page
Abstract Introduction
Conclusions References
Tables Figures
◭ ◮
◭ ◮
Back Close
Full Screen / Esc
Printer-friendly Version
Interactive Discussion
episode, characterized by a high solar radiation and no precipitation or cloudiness. This work explores the possibilities of applying process analysis to high resolution simulations proving that it could be useful not only to better evaluate the simulation results, but also to perform more accurate source apportionment of pollutants over a region.
5
Acknowledgements. The authors gratefully acknowledge E. L ´opez for the implementation of
HERMES, O. Jorba for the meteorological input data and T. Loridan for his help in generating 3-D images. This work was funded by the projects CICYT CGL2006-08903 and CGL2006-11879 of the Spanish Ministry of Education and Science and CALIOPE project 441/2006/3-12.1 of the Spanish Ministry of the Environment. Simulations were carried out in the MareNostrum 10
supercomputer: 94.21 Teraflops of theoretical performance peak; 10240 processors PowerPC 970MP (2560 JS21 blades); Fig. 7 was obtained from Google Maps, © 2007 – Images Digital-Globe, Terrametrics, NASA.
References
Ar ´evalo G., Salvador, R., Gass ´o, S., Millan, M., and Baldasano, J. M.: Application of a high-15
resolution emission model in Valencia Community (Spain), in: Air Pollution 2004, Ed. WIT-press, Rhodes, Greece, 31–40, 2004.
Baldasano, J. M., Cremades, L., and Soriano, C.: Circulation of air pollutants over the Barcelona geographical area in summer, in: Proceedings of Sixth European Symposium Physico-Chemical Behaviour of Atmospheric Pollutants, Varese, Italy, 18–22 October 1993, 20
Report EUR 15609/1 EN, 474-479, 1994.
Baldasano, J. M., G ¨uereca, P., L ´opez, E., Gass ´o, S., and Jim ´enez-Guerrero, P.: Development of a high resolution (1 km×1 km, 1 h) emission model for Spain: the High-Elective Resolution Modelling Emission System (HERMES), Atmos. Environ, 42, 7215–7233, 2008.
Barros, N., Borrego, C., Toll, I., Soriano, C., Jim ´enez, P., and Baldasano, J. M.: Urban pho-25
tochemical pollution in the Iberian Peninsula: Lisbon and Barcelona airsheds, J. Air Waste Manage., 53, 347–359, 2003.
ACPD
8, 18457–18497, 2008Contribution of processes affecting
atmospheric dynamics
M. Gonc¸alves et al.
Title Page
Abstract Introduction
Conclusions References
Tables Figures
◭ ◮
◭ ◮
Back Close
Full Screen / Esc
Printer-friendly Version
Interactive Discussion
and other components of the Models-3 Community Multiscale Air Quality (CMAQ) Modeling System, Appl. Mech. Rev., 59(2), 51–77, 2006.
Coll, I., Pinceloup, S., Perros, P. E., Laverdet, G., and Le Bras, G.: 3D analysis of high ozone production rates observed during the ESCOMPTE campaign, Atmos. Res., 74, 477–505, 2005.
5
Cousin, F., Tulet, P., and Rosset, R.: Interaction between local and regional pollution during ESCOMPTE 2001: impact on surface ozone concentrations (IOP2a and 2b), Atmos. Res., 74, 117–137, 2005.
Cros, B., Durand, P., Cachier, H., Drobinski, P., Fr ´ejafon, E., Kottmeier, C., Perros, P. E., Peuch, V.-H., Ponche, J.-L., Robin, D., Sa¨ıd, F., Toupance, G., and Wortham, H.: The ESCOMPTE 10
program: an overview, Atmos. Res., 69, 241–279, 2004.
Dufour, A., Amodei, M., Ancellet, G., and Peuch, V.-H.: Observed and modelled chemical weather during ESCOMPTE, Atmos. Res., 74, 161–189, 2005.
Gipson, L. G.: Science Algorithms of the EPA Models-3 Community Multiscale Air Quality (CMAQ) Modeling System: process analysis, EPA/600/R-99/030, US-EPA, http://www.epa. 15
gov/asmdnerl/CMAQ/CMAQscienceDoc.html, 37 pp., 1999.
Gery, M. W., Whitten, G. Z., Killus, J. P., and Dodge, M. C.: A photochemical kinetics mecha-nism for urban and regional scale computer modeling, J. Geophys. Res., 94, 12, 925–956, 1989.
Hauglustaine, D. A. and Brasseur, G. P.: Evolution of tropospheric ozone under anthropogenic 20
activities and associated radiative forcing on climate, J. Geophys. Res., 106, 32 337–32 360, 2001.
Hertel O., Berkowicz, R., Christensen, J., and Hov, O.: Test of two numerical schemes for use in atmospheric transport-chemistry models, Atmos. Environ., 27A, 2591–2611, 1993. Hogrefe, C., Lynn, B., Rosenzweig, C., Goldberg, R., Civerolo, K., Ku, J.-Y., Rosenthal, J., 25
Knowlton, K., and Kinney, P. L.: Utilizing CMAQ process analysis to understand the impacts of climate change on ozone and particulate matter, in: 4th Annual CMAS Models-3 Users’ Conference, 26–28 September 2005, Chapel Hill, NC, USA, 2005.
Huang, J. P., Fung, J., Zhang, Y., Lau, A., and Qin, Y.: Process analysis of different synoptic patterns of O3 episodes in Hong Kong, in: 86th Annual Meeting of AMS, 28 January–3 30
February, 2006, Atlanta GA, 2006.
ACPD
8, 18457–18497, 2008Contribution of processes affecting
atmospheric dynamics
M. Gonc¸alves et al.
Title Page
Abstract Introduction
Conclusions References
Tables Figures
◭ ◮
◭ ◮
Back Close
Full Screen / Esc
Printer-friendly Version
Interactive Discussion
21, 3085–3100, 1995a.
Jang, J. C., Jeffries, H. E., and Tonnesen, S.: Sensitivity of ozone to model grid resolution – II: Detailed process analysis for ozone chemistry, Atmos. Environ., 29, 3101–3114, 1995b. Jeffries, H. E. and Tonnesen, S.: A comparison of two photochemical reaction mechanisms
using mass balance and process analysis, Atmos. Environ., 28, 2991–3003, 1994. 5
Jiang, G., Lamb, B., and Westberg, H.: Using back trajectories and process analysis to in-vestigate photochemical ozone production in the Puget Sound region, Atmos. Environ., 37, 1489–1502, 2003.
Jim ´enez, P., Baldasano, J. M., and Dabdub, D.: Comparison of photochemical mechanisms for air quality modelling, Atmos. Environ., 37, 4179–4194, 2003.
10
Jim ´enez, P., Jorba, O., Parra, R., and Baldasano, J. M.: Evaluation of MM5-EMICAT2000-CMAQ performance and sensitivity in complex terrain: high-resolution application to the northeastern Iberian Peninsula, Atmos. Environ., 40, 5056–5072, 2005.
Jim ´enez, P., Lelieveld, J., and Baldasano, J. M.: Multiscale modelling of air pollutants dynamics in the northwestern Mediterranean basin during a typical summertime episode, J. Geophys. 15
Res., 111, D18306, doi:10.1029/2005JD006516, 2006.
Jim ´enez-Guerrero, P., Jorba, O., Baldasano, J. M., and Gass ´o, S.: The use of a modeling sys-tem as a tool for air quality management: annual high-resolution simulations and evaluation, Sci. Total Environ., 390, 323–340, 2008.
Jonson, J. E., Simpson, D., Fagerli, H., and Solberg, S.: Can we explain the trends in European 20
ozone levels?, Atmos. Chem. Phys., 6, 51–66, 2006, http://www.atmos-chem-phys.net/6/51/2006/.
Jorba, O., P ´erez, C., Rocadenbosch, F., and Baldasano, J. M.: Cluster Analysis of 4-Day Back Trajectories Arriving in the Barcelona Area (Spain) from 1997 to 2002, J. Appl. Meteorol., 43(6), 887–901, 2004.
25
Lawrence, M. G., Crutzen, P. J., Rasch, P. J., Eaton, B. E., and Mahowald, N. M.: A model for studies of tropospheric photochemistry: description, global distributions and evaluation, J. Geophys. Res., 104, 26 245–26 277, 1999.
Lawrence, M. G., Rasch, P. J., von Kuhlmann, R., Williams, J., Fischer, H., de Reus, M., Lelieveld, J., Crutzen, P. J., Schultz, M., Stier, P., Huntrieser, H., Heland, J., Stohl, A., Forster, 30
ACPD
8, 18457–18497, 2008Contribution of processes affecting
atmospheric dynamics
M. Gonc¸alves et al.
Title Page
Abstract Introduction
Conclusions References
Tables Figures
◭ ◮
◭ ◮
Back Close
Full Screen / Esc
Printer-friendly Version
Interactive Discussion
http://www.atmos-chem-phys.net/3/267/2003/.
Lelieveld, J., Berresheim, H., Borrmann, S., et al.: Global air pollution crossroads over the Mediterranean, Science, 298, 794–799, 2002.
Michalakes, J., Dudhia, J., Gill, D., Henderson, T., Klemp, J., Skamarock, W., and Wang, W.: The Weather Research and Forecasting Model: software architecture and performance, Pro-5
ceedings of the Eleventh ECMWF Workshop on the Use of High Performance Computing in Meteorology, edited by: Zwiefhofer, W. and Mozdzynski, G., World Scientific, European Cen-tre for Medium-Range Weather Forecasts, UK, 156–168, 2005.
Mill ´an, M., Salvador, R., Mantilla, E., and Art´ı˜nano, B.: Meteorology and photochemical air pol-lution in southern Europe: experimental results from EC research projects, Atmos. Environ., 10
30, 1909–1924, 1996.
Mill ´an, M., Salvador, R., Mantilla, E., and Kallos, G.: Photo-oxidant dynamics in the Mediter-ranean basin in summer: results from European research projects, J. Geophys. Res., 102, 8811–8823, 1997.
O’Neil, S. and Lamb, B.: Intercomparison of the Community Multiscale Air Quality Model and 15
CALGRID using Process Analysis, Environ. Sci. Technol., 39, 5742–5753, 2005.
Ortega, S., Soler, M. R., Beneito, J., and Pino, D.: Evaluation of two ozone air quality modelling systems, Atmos. Chem. Phys., 4, 1389–1398, 2004,
http://www.atmos-chem-phys.net/4/1389/2004/.
Parra, R., Gass ´o, S., and Baldasano, J. M.: Estimating the biogenic emissions of non-methane 20
volatile organic compounds from the North western Mediterranean vegetation of Catalonia, Spain, Sci. Total Environ., 329, 241–259, 2004.
Parra, R., Jim ´enez, P., and Baldasano, J. M.: Development of the high spatial resolution EMI-CAT2000 emission model for air pollutants from the north-eastern Iberian Peninsula (Catalo-nia, Spain), Environ. Pollut., 140, 200–219, 2006.
25
P ´erez, C., Sicard, M., Jorba, O., Comer ´on, A., and Baldasano, J. M.: Summertime re-circulations of air pollutants over the north-eastern Iberian coast observed from systematic EARLINET lidar measurements in Barcelona, Atmos. Environ., 38, 3983–4000, 2004. Roelofs, G. J., Scheeren, H. A., Heland, J., Ziereis, H., and Lelieveld, J.: A model study of
ozone in the eastern Mediterranean free troposphere during MINOS (August 2001), Atmos. 30
Chem. Phys., 3, 1199–1210, 2003, http://www.atmos-chem-phys.net/3/1199/2003/.
environ-ACPD
8, 18457–18497, 2008Contribution of processes affecting
atmospheric dynamics
M. Gonc¸alves et al.
Title Page
Abstract Introduction
Conclusions References
Tables Figures
◭ ◮
◭ ◮
Back Close
Full Screen / Esc
Printer-friendly Version
Interactive Discussion
ment, 53, C. A. BREBBIA, Wessex Institute of Technology, UK, and University of the West of England, Bristol, UK, 2002.
Skamarock, W. C., Klemp, J. B., Dudhia, J., Gill, D. O., Barker, D. M., Wang, W., and Pow-ers, J. G.: A Description of the Advanced Research WRF Version 2, NCAR Technical note NCAR/TN-468+STR, NCAR, 2005.
5
Sillman, S. and He, D.: Some theoretical results concerning O3-NOx-VOC chemistry and NOx -VOC indicators, J. Geophys. Res., 107(D22), 4659, doi:10.1029/2001JD001123, 2002. Soriano, C., Baldasano, J. M., Buttler, W. T., and Moore, K.: Circulatory Patterns of air pollutants
within the Barcelona air basin in a summertime situation: lidar and numerical approaches, Bound.-Lay. Meteorol., 98(1), 33–55, 2001.
10
Taghavi, M., Cautenet, S., and Foret, G.: Simulation of ozone production in a complex circula-tion region using nested grids, Atmos. Chem. Phys., 4, 825–838, 2004,
http://www.atmos-chem-phys.net/4/825/2004/.
Toll, I. and Baldasano, J. M.: Modeling of photochemical air pollution in the Barcelona area with highly disaggregated anthropogenic and biogenic emissions, Atmos. Environ., 34, 3060– 15
3084, 2000.
US EPA: Guideline for regulatory application of the urban airshed model, Office of Air and Ra-diation, Office of Air Quality Planning and Standards, Technical Support Division, Research Triangle Park, North Carolina, USA, US EPA Report No. EPA-450/4-91-013, 1991.
US EPA: Guidance on the use of models and other analyses in attainment demonstrations for 20
the 8-hour ozone NAAQS, Office of Air Quality Planning and Standards, Research Triangle Park, North Carolina, USA, US EPA Report No. EPA-454/R-05-002, 128 pp., 2005.
Vautard, R., Bessagnet, B., Chin, M., and Menut, L.: On the contribution of natural Aeolian sources to particulate matter concentrations in Europe: Testing hypotheses with a modelling approach, Atmos. Environ., 39, 3291–3303, 2005.
25
Yamartino, R. J.: Nonnegative, conserved scalar transport using grid-cell.centered spectrally constrained Blackman cubics for applications on a variable-thickness mesh, Mon. Weather Rev., 121, 753–763, 1993.
Zhang, Y., Vijayaraghavan, K., Huang, J., and Jacobson, M. Z.: Probing into Regional O3 and PM pollution: a 1-year CMAQ simulation and process analysis over the United States, 30