PROPOSAL FOR A STRATEGIC PLANNING FOR THE REPLACEMENT OF PRODUCTS IN STORES BASED ON SALES FORECAST
Cassius Tadeu Scarpin
1and Maria Teresinha Arns Steiner
2*Received February 10, 2010 / Accepted March 31, 2011
ABSTRACT.This paper presents a proposal for strategic planning for the replacement of products in stores of a supermarket network. A quantitative method for forecasting time series is used for this, the Artificial Radial Basis Neural Networks (RBFs), and also a qualitative method to interpret the forecasting results and establish limits for each product stock for each store in the network. The purpose with this strategic planning is to reduce the levels of out-of-stock products (lack of products on the shelves), as well as not to produce overstocking, in addition to increase the level of logistics service to customers. The results were highly satisfactory reducing the Distribution Center (DC) to shop out-of-stock levels, in average, from 12% to about 0.7% in hypermarkets and from 15% to about 1.7% in supermarkets, thereby generating numerous competitive advantages for the company. The use of RBFs for forecasting proved to be efficient when used in conjunction with the replacement strategy proposed in this work, making effective the operational processes.
Keywords: product replacement, Artificial Radial Basis Neural Networks, out-of-stock, forecasting time series, level of logistics services.
1 INTRODUCTION
The supermarket sector, a major retail, has been undergoing major transformations. Some histo-rical facts in the Brazilian economy, as the entry into force of the Code for Consumer Protection and Defense, the deployment of the Real plan and the control of the inflation rates have increa-sed, even more, the competition between the companies within this sector (ABRAS, 2005). In this competitive scenario, it becomes essential for a company to design effective and well defined strategies to achieve the goal of offering attractive prices to consumers, a varied mix of products,
*Corresponding author
1Universidade Federal do Paran´a (UFPR), Departamento de Engenharia de Produc¸˜ao, Programa de P´os-Graduac¸˜ao em M´etodos Num´ericos em Engenharia, P.O. Box 19081, 81531-990 Curitiba, PR, Brazil. E-mail: [email protected] 2Universidade Federal do Paran´a (UFPR), Programas de P´os-Graduac¸˜ao em M´etodos Num´ericos em Engenharia e em Engenharia de Produc¸˜ao; Pontif´ıcia Universidade Cat ´olica do Paran´a (PUC-PR), Programa de P ´os-Graduac¸˜ao em Enge-nharia de Produc¸˜ao e Sistemas, P.O.Box 19081, 81531-990 Curitiba, PR, Brazil.
in addition to quality services (Correa & Correa, 2004; Benetti et al., 2008). In this environ-ment, in which competition requires the completion of the activity with reduced profit margins, it is essential that commercial companies pay attention to their operational conditions ( ˆAngelo & Siqueira, 2000).
The supermarket sector represents 5.5% of the national GDP and provides about 800,000 direct jobs, according to data published in Revista Superhiper (ABRAS, 2005). The Annual Trade Survey of 2005, released by the Brazilian Institute of Geography and Statistics (IBGE, 2007), analyzes of supermarket and hypermarket sales and shows that their participation in retail sales in 2005 represented 24% of the total. On the other hand, data released in 2008 by the same Revista Superhiper (ABRAS, 2008) show that supermarkets account for 22.8% of retail jobs and pay wages 20% higher than the average retail. The development of this sector enables the retention of jobs and also the expansion of job places (Atamanczuk, 2009). This information showed the continued need for companies to improve management practices and strategic plan-ning for the achievement and maintenance of its consumer market (Bhargava, Daewon & Xu, 2006; Peter, 2006). Therefore, the increasing need for tools to help decision making, which may contribute to an increased level of the services offered by retailers (Anderson, Gavan & Sismester, 2006; Lucas Jr, 2006). A sector in these companies that can absorb new methods and tools is the operational sector, because excellence in customer service is directly related to the quality of operations, both internally and directly to the customer.
One of the most critical problems in retail is the rupture of products on the shelves of stores. Rupture or out-of-stock is the situation in which a product marketed by the company is not available in the consumer sales area at the time of purchase (Czpski, 2008). Estimates of out-of-stock levels have consistently exceeded the average of 8% in retail and, despite efforts, this value has remained high. Among the various causes are the diversification and the reduction of the products’ life cycle, which add to the lack of coordination of the supply chain (Campo, Gijsbrechts & Nisol, 2000).
In Brazil, there are few academic studies on the causes of out-of-stock and the possible solutions to avoid this fact. A survey carried out by the Retail Services Division of ACNielsen Brazil, in July 2004, analyzed the main causes and the reaction of consumers when confronted with the lack of a product on the shelves. The study concludes that major opportunities for improvement could come through “better communication” between the retailer’s Distribution Center (DC) and the shelves in the store. In another survey, this one by the Center for Research and Publication (ESPM – S˜ao Paulo) (Vasconcellos, Sampaio & Pastore, 2007), it was found in a survey with managers of supermarkets that the average out-of-stock level in supermarkets in S˜ao Paulo is of 8.3% with a standard deviation of 6.8%, which means that out of 10,000 products sold by a supermarket, about 830 products are not available on the shelves.
highlight the importance of deeper studies in order to obtain methods and strategies that seek solutions to reduce these out-of-stock levels.
Figure 1– Out-of-Stock levels found in Brazilian studies. Source: Authors.
The main Brazilian studies on out-of-stock levels also show significant results in relation to the reasons for the absence of a product in the sales area, which are diagrammed in Figure 2 below.
Figure 2– Reasons for the lack of a product in the sales area. Source: Adapted from ACNielsen (2004).
In his turn, De Luca (2004) shows that in Argentina the most important factor that influences the out-of-stock rates is the replacement operation at points of sale, so he recommends the ap-plication of optimization tools to assist in replacement planning, continuous measurements, im-provements in logistics practices and joint planning with suppliers. The conclusion of the work highlights the importance of reducing the out-of-stock levels because, according to the research, 35.85% of customers go to the competition for their purchases when they do not find a certain product on the shelves.
In North America, a similar study about out-of-stock levels was developed by Gruen (2007b), showing the out-of-stock rates of four locations worldwide: the U.S. with 7.9%, in Europe, including Eastern Europe, with 8.6%, other important regions, such as Latin America, with 8.2%, and data found on the internet about other different places in the world with 8.3% rates in average. It also states that for products in promotions, the out-of-stock rate in the U.S. rose from 7.9% to 17.1%. According to this research, the causes for out-of-stock situations in the U.S., in particular, are distributed as follows: 34% for problems on sales forecasts, 25% for failing to restore stock, 14% for non-delivery by suppliers, 13% for errors in orders to suppliers, 10% for problems in the Distribution Center and 4% for other causes. The paper concludes with suggestions to mitigate this problem, among them, to constantly measure and assess their levels by identifying causes, implementing and improving the solutions found and continuously keeping track of the situation the supermarket is in (Gruen, 2002, 2007a; Corsten & Gruen, 2003).
This paper proposes a strategic plan for forecasting and the consequent replacement of products in stores of the supermarket sector. The main focus of this proposal is to ensure that products are available at the company’s stores, thus reducing the out-of-stock level of each product. For the development of the replacement strategic planning the time series forecasting (Portugal & Fernandes, 1996) was used, through the use of Radial Basis Neural Networks (RBFs) (Haykin, 1994; Buchtala, Klimek & Sick, 2005) applied to each product. Then, based on the results obtained with the RBFs a procedure is presented to replace each of the products.
This work aims to propose an approach that will join the quality of logistics and the quantity of products suggested for replacement. Therefore, one will have a strategic plan with the utmost precision on the consumption customers are supposed to realize, thereby leading to a forecast of the necessary logistics operations minimizing the out-of-stock levels, as well as overstocking.
2 PROBLEM DESCRIPTION
A supermarket network was analyzed to better support the proposed strategic planning for the replacement of products in stores presented here. This company has 28 stores spread in the State of Paran´a, 15 in the capital, Curitiba, five in the metropolitan region of Curitiba and the other eight in the state’s countryside. These stores sell around 18,000 different products of which around 10,500 are concentrated products (suppliers deliver the products to the network’s DCs) and 7,500 suppliers deliver directly to the stores.
Among the centralized products around 8,000 are classified as Grocery Store (or “dry area”), including those products of the families Food, Health and Beauty, Cleaning, Pet Shop, Electro, Bazaar, Drinks and Imported items. The other 2,500 products are in the cold/frozen area as, for instance, products of the families Cold Cuts, Margarine, Meat, Frozen and Perishable Items. In this work the methodology was applied to the Grocery products.
The company has its own fleet to make daily deliveries for orders from the stores, and all inven-tory control, separation and shipment is made by the company itself. To control all the informa-tion the studied company developed a proprietary management system through its informainforma-tion technology team. This system contemplates, among other modules, the following systems: sales forecasting, automatic product replacement, separation of products at the DC and routing de-liveries, among many other managerial and administrative modules. This work is intended to optimize the automatic product replacement system using a more reliable sales forecast strategy, applying the results to automatically produce daily orders from the stores.
In this company, as well as in most supermarket retail stores, the most important sector is Gro-cery, which is about 85% of the company’s total turnover, which had, during the research, an out-of-stock rate of about 12%. It is worth emphasizing that the out-of-stock rate is measured when a product stock reaches zero at the store. As the modern techniques for business mana-gement emphasize low inventory, operators should adjust the maximum the level of its products and services to the customers’ needs (Dalla Costa, 2004; Bowersox & Closs, 1996, 2001). One must bear in mind that when people go to stores, they buy more than was planned, allowing the trade to profit greatly from the encouragement of impulse purchases. No matter how great the traders’ efforts are, actions will be pointless if there is no product availability at the stores’ shel-ves (Christopher, 1997, 2002). The out-of-stock situation of other products will not be included in this study, once their sales characteristics are different from the Grocery sector, thus deserving a special study.
The replacement system found in the company that was studied during the research was based on moving averages, as well as on orders from managers to stores, which was inefficient for a product replacement generalization. The automatic replacement strategy was calculated using the moving averages of the last 30 days and when the stock was smaller than the average, the replacement of that product was suggested in a predefined amount (Box & Jenkins, 1994).
will become too high causing overstocking. Similarly, if during one or more consecutive days, sales are much smaller than the natural tendency (due to rain or any other external factor) the average values will change (downwards), increasing the likelihood of an out-of-stock situation. This will occur especially if it coincides with the arrival of the weekend, since on Sundays there is no product replacement at stores.
In general one can say that when an out-of-stock situation occurs, in 45% of cases consumers replace their products, 31% change stores, 14% hardly return and 10% have mixed reactions (Vasconcellos, Sampaio & Pastore, 2007). It should be noted that out-of-stock shelves were, are and probably will always be an important management problem to be solved.
The out-of-stock levels in the company’s 28 stores amounted to almost 15% in some of them and were never lower than 8%, even in those stores considered as the company’s most efficient ones. What was considered and measured in this work, specifically, was the DC-Shop rupture, that is, products that are present at the DC, but reach an out-of-stock situation in the stores due to the lack of a more efficient replacement strategy. The out-of-stock situation caused by the replacement of products directly from the vendor was not considered here.
The replacement operations at the DC (product separation, truck loading and shipping) occur in greater quantity on Mondays, when the products sold during the weekends are replaced. The average number of boxes separated and loaded on Mondays was above 45,000, while on Wed-nesdays and Thursdays, this average was around 13,000. That meant a peak, both in assistance and in logistics operations at the beginning of each week, creating an operational bottleneck at the DC.
3 RELATED WORKS
Logistics is a topic that has gained increasing importance in the scientific and commercial lite-rature (Gr¨udtner, 2005; Ballou, 2006). In their work, Wanke & Fleury (1999) discuss the lean re-supply, featuring an integrated manner to address the concepts of lean re-supply (just-in-time philosophy) and cost analysis of the supply chain. ˆAngelo & Siqueira (2000) make an assessment of the logistical conditions in Brazilian supermarkets to check the conditions to implement the Efficient Consumer Response (ECR) philosophy. In his turn, Farah (2002) presents a discussion about the DCs and the challenges that can reduce logistics costs and streamline the delivery of products with the installation of DCs at strategic locations.
in information technology to monitor vehicles, control inventory and to have online indicators to measure performance and anticipate corrective actions can help the entire procedure.
Information management applied to logistics is the theme also brought by Carvalho, Oliveira & Jamil (2007), who argue that information management is a critical issue to optimize the physical distribution of a value chain to increase the level of the services offered to customers. With this same approach, Benettiet al. (2008) suggest a model to evaluate a DC’s logistics performance in the supermarket sector, establishing a relationship between theory and practice. Carreraet al. (2008) once again focus on the just-in-time system, applying it to administration in pursuit of excellence in its processes, commenting that this philosophy has become a commitment among all members who are part of the supply chain of a given product or service.
To assist in the product replacement logistics processes, time series analysis has been a theme much studied in this context. Fernandes, Portugal & Navaux (1996) use time-series forecasting by means of an algorithm using Artificial Neural Networks (ANN), highlighting their statistical characteristics. Correa & Portugal (1998) present an empirical assessment of the predictive abi-lity of ANN models and structural models, which showed in their study a performance that is slightly superior to that of ANNs. Dias (1998) made a proposal for a sales forecasting process for consumer goods designed to meet the choice and adjustment of forecasting techniques, and also for the forecasting function as a whole. He brings a comparison between quantitative and qualitative forecasting methods, as well as a comparison between softwares and their functions, and the methods of companies that use forecasting to support decision making.
Coelho & Canciglieri Jr. (2000) present the application of RBFs for the time series forecasting procedure, indicating that the proposed model is attractive to identifiy complex systems, financial applications and information systems. A comparative study of statistical methods and ANNs was presented by Lima & Almeida (2004) to explore the possibility of using a methodology that can decompose a time series through wavelets together with the existing models to forecast and compare the quality of the forecasts obtained. The results showed that the ANNs have a superior performance when there are periods of lower volatility in the financial market.
Caloba, Caloba & Saliby (2002) apply neural networks to forecast time series on beer sales in Australia. The authors add neural networks to the time series classical decomposition method achieving the best results in their study with this combination of forecasting techniques. The conclusions for this work were that neural networks reach great efficiency when dealing with non-linearity and that neural networks are positioned as a tool that allows a margin for improve-ment in the forecasting classical methods.
To forecast agricultural prices examining the theoretical aspects of Data Mining and the appli-cation of ANNs is the objective of the study by Lazzarotto, Oliveira & Lazzarotto (2006), who found that, although having some limitations, ANNs might constitute an interesting alternative to forecast prices. Applying the Mixture of Local Expert Models (MLEM) to forecast daily and monthly prices of the commodity sugar in New York’s stock exchange is the theme taken up by Melo, Milioni & Nascimento Jr (2007). The technique the authors explore can be seen as a method to forecast time series that perform simultaneously the data exploratory analysis and the mathematical modeling. They use one of the methodology’s steps, the Kohonen neural network, to perform the clustering of the set of initial data.
Fariaet al.(2008) show the use of the statistical techniques Simple Exponential Smoothing and Simple Moving Average to forecast time series, noting that, although they are simple forecasting methods, the results are reasonable. They also note that increasing the observations time window in the method of Simple Moving Average, also increases the forecasting errors. Garcia & Ferreira Filho (2009) propose a new approach to calculate the “point of order” (this is, the time when one must make an order), based on the demand forecasted for each period during the re-supply time, using the economic batch system with “point of order”. The authors compare the methodology proposed through inventory simulations with the “point of order” per economic batch classical method. The results obtained show that the authors’ proposal is a generalization of the classical model that expands the scope and the applicability of the classical model.
4 PROPOSED APPROACH AND RESULTS
The stock replacement system must be effective in organizations, this is, it should meet the sales demands and at the same time not cause overstocking in stores. The modern administration has constantly sought for new tools in the quest for excellence in its processes (Carreraet al., 2008). The approach suggested in this paper is to establish parameters for the automatic replacement of products, minimizing the rupture rates and helping the managers of each store in their decision making.
For each of the 8,000 products of each of the analyzed retailer’s 28 stores, one must calculate the sales forecasting and inventory levels according to the days of coverage established by the company’s inventory policy. For this calculation sales history is considered with the data being prepared, adjusted and then applied to a sales forecasting system (Dias, 2006). As previously mentioned, the forecasting method used here are the RBFs (Almeida & Siqueira, 1997).
The results of the sales forecast obtained through the RBFs are then used in the day-to-day definition of the replacement parameters which, in turn, are compared with the actual inventory information by the end of the day so as to suggest the automatic replacement, via system.
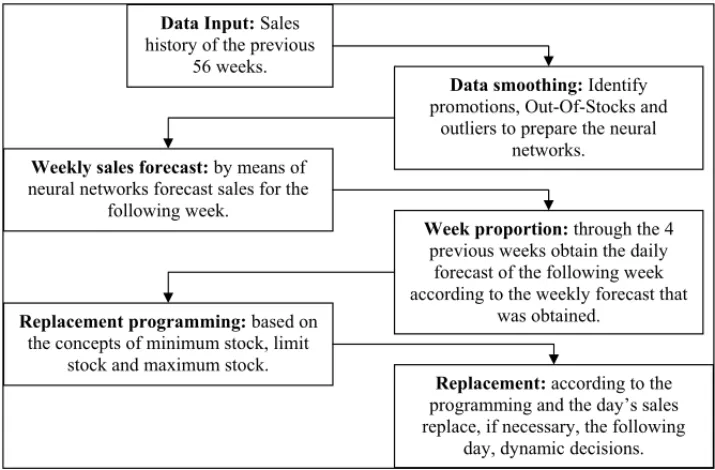
The general procedure of the approach here proposed is shown in Figure 3, below, and each of its steps is detailed in the following sections, from 4.1 to 4.4.
General Outline of the Proposed Methodology.
Sales history of the previous
56 weeks.
Identify promotions, Out-Of-Stocks and
outliers to prepare the neural networks.
by means of neural networks forecast sales for the
following week.
through the 4 previous weeks obtain the daily
forecast of the following week according to the weekly forecast that
was obtained. based on
the concepts of minimum stock, limit stock and maximum stock.
according to the programming and the day’s sales replace, if necessary, the following
day, dynamic decisions.
Figure 3– General Outline of the Proposed Methodology. Source: Authors.
ment for each product in the stores. The RBFs, implemented in Visual Basic 6, prepare the sales forecast taking into account the sales history of each product in each store. It is worth noting that other programs have this technique already implemented such as, for example, the mathemati-cal software MATLAB. The procedures for data smoothing and processing, however, should be generated separately.
4.1 Data Collection and Treatment
During the research, daily data was collected from the sales history concerning the last 56 weeks of sales (one year and one month), 392 (56×7), for each product. This volume of data was used
as follows: data from the first 52 weeks (one year) are used to train the RBFs, this is, it is one year of information to capture the natural seasonalities that are characteristic of each product and the data of the remaining four weeks (one month) are used to perform the tests in the RBFs already trained, this way obtaining the forecast error. The algorithm provides as answer the forecasted value of one week of sales for each one of the products.
In the retail market there are many variables that can influence the increase or decrease in sales of a given product. Many of them are qualitative variables, such as: market trend, customer preference and promotions. These variables do not provide precise indicators of “when” and “how much” the amount of products sold can change or end, once they do not portray the real sales value of the product in normal sales times.
(Lazarotto, Oliveira & Lazzarotto, 2006). Moreover, exclusive promotions from a store or unex-pected events in the vicinity of the store can also influence a product’s sales behavior. Thus, these data should be identified and removed from the original series, smoothing the data series and obtaining the closet behavior to the actual products sales.
Then, the treatment of the original data is proposed for each product through the following steps:
• Step 1. remove the data corresponding to the quantities sold in those days in which the product was on sale or out-of-stock;
• Step 2.put the remaining data in a list, in ascending order, removing 5% of the data from the lower end and 5% of the data from the upper end, minimizing the possibility of white noise (such strategy is based on the box plot statistical technique (Atkinson, Koopman & Shephard, 1997))
• Step 3. calculate the mean and the standard deviation of the remaining data, considered sales data with no influence;
• Step 4.generate, at random, data in the range centered on the mean and with radius equal
to one standard deviation, which will replace the data deleted in steps 1 and 2, in the same position and considering the time series sequence.
To treat the data it must be noted that the position of the information within the time series is essential to the quality of the desired forecast. In case the subtraction of the mean by the standard deviation is negative the interval is limited downwards with the value zero.
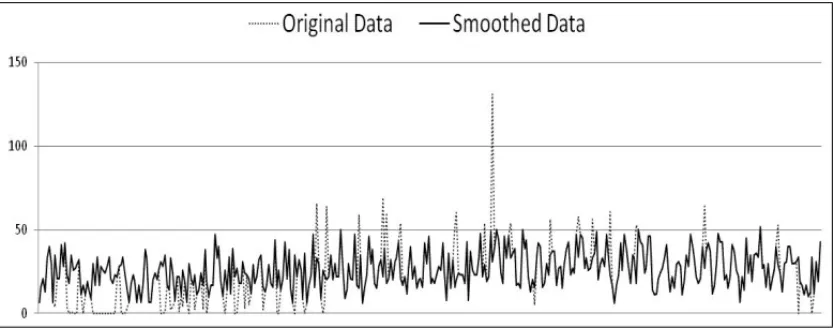
In this work, of the 392 original data shown in Figure 4, where there is the time series for the product “flour 1 kg”, were removed the values of the quantities sold in those days when the product was on sale and/or out-of-stock (zero sale and zero stock in that day). From all other data, 5% were removed from the lower end and 5% from the upper end. Then, new data were generated to replace those that were removed. Such “processed” data will be used to “feed” the RBFs.
4.2 Sales Forecast
There are several techniques for sales forecasting, whether qualitative or quantitative. In this work, as already mentioned, are used RBFs. This technique has several features in common with the traditional statistical and econometric models (Fernandes, Portugal & Navaux, 1996). ANNs operate conceptually in a manner similar to the human brain, trying to recognize patterns and regularities in the data (Rojaset al., 2000). They are able to learn from experience and make generalizations based on the knowledge previously accumulated.
The characteristics that make ANNs attractive for time series forecasting are, according to Co-elho & Canciglieri Jr (2000), the skills in dealing with nonlinear systems and they have fault tolerance, adaptability, learning, self-organization, generalization, training, parallel processing and abstraction. All these characteristics are observed due to the interconnected structures, cal-led neurons, which are connected through weights that are adjusted during the ANN training period. This adjustment takes place according to a set of learning rules, iteratively, until the data’s cause and effect relations are obtained (Gonzalezet al., 2006). If the conditions are al-tered in such a way that the model’s performance is no longer appropriate, one can submit the ANNs to a new training to “correct” their performance. ANNs may undergo periodic updates, resulting in a model that is self-adjusting in time (Musaviet al., 1992).
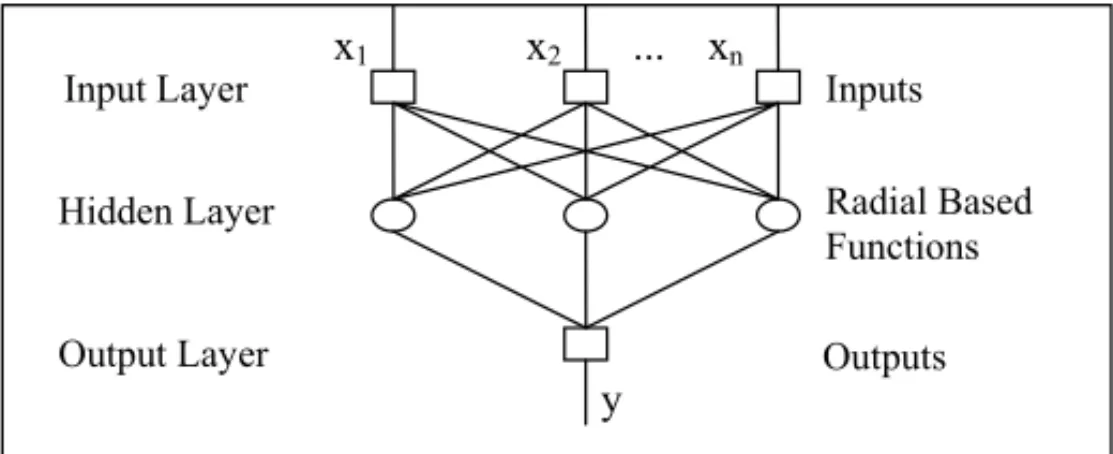
The RBFs that were used have as essential characteristic, as shown in Figure 5 below, their output layer that is a linear combination of signals from the hidden layer and also, this type of neural network uses only one hidden layer. RBFs allow a rapid procedure for updating weights, separa-ting the input patterns and providing a structure suitable for the construction of local mappings of the input and output data.
Architecture of the RBF with a hidden or intermediate layer. y
Input Layer
Hidden Layer
Output Layer
Inputs
Outputs
x1 x2 ... xn
Radial Based Functions
Figure 5– Architecture of the RBF with a hidden or intermediate layer. Source: Authors.
In this work were used data, already smoothed, of the sales quantities grouped by week. Thus, there are 56 values (56 weeks) for use by the RBFs. The input data (attributes) are formed by four values (vector with dimension 4), this is, the values of 4 consecutive weeks of sales and the output that was used was the value of the following week, this is, the 5thweek.
and the corresponding output is are the sales of week 6, and so on to the last pattern, which has as input the sales figures of weeks 48, 49, 50 and 51, and as output the sales figures of week 52. Once the RBF is trained, the test is made with weeks 53, 54, 55 and 56, thus obtaining the value of the forecast error. Finally, the forecast is made after training and testing the RBF with the input pattern formed by the sales figures of weeks 53, 54, 55 and 56 and the forecasted values are the sales reference expected for week 57.
Table 1 below shows the forecasts found for weeks 57 and 58, from the 56 weeks used to feed the RBFs. It was noticed that in all analyzed products, for the second week of forecast with the same 56 weeks input into the algorithm, the forecast error increases and this fact justifies the use of weekly forecasting (approach).
Table 1– Forecast sales of product “bleach 1 liter” for weeks 57 and 58. Source: Authors.
Product Description Date Forecast True Sales Forecast Deviation (%)
365378 Bleach 04/02 715 679 5.30
1 liter (week 57)
365378 Bleach 11/02 612 568 7.75
1 liter (week 58)
4.3 Limits Computation
Once the sales forecast value for each product in each store is obtained for the “following week”, the stock limits are then calculated.
To do this, there are the following steps based on the company’s staff day-to-day practices, here formalized:
• Step 1. Divide the expected value for a week in sales values for each day of that week.
For this, the proportionality of the day is used as daily forecast. The forecasted value is considered as 100% of sales for the following week and the percentage for each day of the week, from Monday through Sunday, is calculated by the percentage average sales share of that product during the previous four weeks.
For example, say that the sales forecast of a product for week 57 is 368 units (for the whole week). If the percentage for Monday of the sales value of week 53 is 14.4%, for weeks 54, 55 and 56 are 18%, 16.5% and 15.1% respectively, the average of these four percentages is 16%. Thus, we have that the quantity of products forecasted for sale on Monday of week 57 is 16%, resulting in a value of 59 items (already rounded to an integer value). Likewise, the percentages are calculated for the remaining days of the week.
• Step 2.The number of days that the replacement of a product must meet (days of coverage) is defined according to the company’s inventory policy. Based on this coverage the concept of values for minimum, limit and maximum stocks is created and their corresponding computations are made.
The minimum stock for a product for a particular day is the forecasted value for that day, the maximum stock is the sum of the forecasted values corresponding to the subsequent days of coverage and the limit stock is the arithmetic mean between the minimum and maximum.
Lets take, for example, the sales forecast for the product “bleach 1 liter”, for a given week of 408 units, as in Table 2 below. As explained above, this value is divided proportionally to the amounts of expected sales for each day of the week, thus determining the minimum stock that the store should have in each day.
Table 2– Example of calculation of the minimum, limit and maximum stocks. Source: Authors.
Product Bleach
Days of week Monday Tuesday Wednesday Thursday Friday Weekend
Minimum Stock 75 51 48 59 51 124
Limit Stock 126 99 107 110 175 199
Maximum Stock 174 158 158 234 25 250
In this example, it was decided that stock coverage is of three days and the minimum coverage, this is, the limit stock should cover two days. Thus, the limit stock for Monday is the sum of the forecasted values for Mondays and Tuesdays(75+51 = 126)and the maximum stock is the
sum of the minimum stock for Mondays, Tuesdays and Wednesdays(75+51+48=174). To calculate the maximum stock for Friday and the maximum and limit stocks for the weekend, the values for Mondays and Tuesdays are used, or else, sales forecast is run again in midweek.
The days of coverage to calculate the maximum stock can be defined by product, taking into account their market features. Thus, one can define few days of coverage for products with high turnover and, on the other hand, a greater number of days of coverage for products with low or very low turnover.
The correctness of days of coverage directly influences the replacement frequency, since the gre-ater the number of days of coverage, the lower is the amount of replacements and, consequently, the greater the risk of overstocking. On the other hand, if there are few days of coverage, the greater will be the amount of replacements and, consequently, stocks will be leaner with greater risk of having an out-of-stock situation.
4.4 Replacement Strategy
stock and the actual stock is calculated, for example, with the found value as the suggested product replacement for the following day.
The replacement strategy for a product or a marketing group is directly related to the number of days of coverage. Thus, finding the maximum stock days of coverage for each product or each marketing group in a store is an adjustment that should be planned jointly by the logistics mana-ger and the store manamana-ger, makiing the proposed replacement system suitable for any decision taken.
For the company analyzed here, it was set a period of four days of coverage for products with high turnover, five days for those with medium turnover, six days for those with low turnover and of 15 days for those with very low turnover. The computational time necessary to run the program that was developed is, on average, 15 minutes to forecast all products in a store, and the replacement schedule is weekly. It is important to keep in mind that the company has 28 stores, as already mentioned in Section 2.
4.5 Real Illustrative Example
Table 3, below, shows a comparison between the current replacement strategy and the one pro-posed in this paper. First, one must consider that the actual stock for a given product on 02/03 (Sunday) is of 186 units, while the simulated stock believes that on this Sunday stock is zero. The simulated stock is thus defined in order to compare the stock behavior at the end of each strategy’s day with the current strategy not interfering with the simulation results.
Table 3– Example comparing the actual replacement and simulated replacement for a particular product. Source: Authors.
Date Day
Promotion Actual Min. Lim. Max. End of
Actual
End of
Simul. year of the
Sales St. St. St. Day
Replac. Day
Replac.
2008 week Actual Simul.
St. St.
03/02 Weekend XX XX XX XX XX 186 XX XX XX
04/02 Monday No 4 22 41 60 182 0 56 60
05/02 Tuesday No 3 19 38 58 179 0 53 0
06/02 Wednesday No 6 19 39 64 173 0 47 0
07/02 Thursday No 28 20 45 93 145 0 19 0
08/02 Friday No 29 25 73 93 116 0 64 74
09/02
Weekend No 32 48 68 85 144 60 53 21
10/02 No 16 48 68 85 128 XX 37 XX
11/02 Monday No 12 20 37 54 164 48 25 0
12/02 Tuesday No 11 17 34 52 153 0 41 27
13/02 Wednesday No 18 17 35 57 135 0 23 0
14/02 Thursday No 24 18 40 75 111 0 51 52
15/02 Friday No 24 22 57 77 87 0 53 26
16/02
Weekend No 30 35 55 72 105 48 42 19
After the implementation of the proposed strategy, in a few days the actual stock shall stabilize at the stock levels desired by the approach, depending on the amount in stock of each product. This time is not relevant for the proposed strategy, because the proposal determines that no replacement of the product is made while the actual stock is not at the desired levels.
It can be seen in Table 3 that the number of stock replacements simulated by the proposal is larger than the current strategy, thus generating more operational work. However, the product stock level in a store is leaner, between 15% and 60% less stored product in the store’s inventory and with a sufficient safety stock for the sales of the day. The same happens when the new replacement strategy is simulated for all products in the store, this is, the amount of replacements by product increases, but the amount of product in every replacement is significantly reduced, ensuring a leaner stock in stores while, at the same time, ensuring the safety stock to avoid rupture.
It is noteworthy that there is a tradeoff in this situation: a larger number of replacements with fewer products in the optimized procedure versus fewer replacements with higher quantity of products in the procedure adopted by the company. The optimized procedure is the desired by the company, once it avoids rupture and, at the same time, is leaner. Thus, each of the stores will de able to diversify its product mix and, therefore, attract a greater number of customers.
On 02/07 (Thursday), for example, by the end of the day there are, in the simulated stock, 19 units. Since this value is lower than the limit stock for the next day, 02/08, (73 units), an order is automatically generated in the system for the product replacement of 74 units, to be delivered during the morning of 02/08. Thus, the store keeps a stock of 93 units (maximum stock for Friday, which shall meet the sales demand of this day, of Saturday (02/09) and Sunday (02/10)). The sales on Friday (02/08) were of 29 units, thus leaving the store, by the end of the day, with a stock of 64 units.
It can be observed that at the end of the day on Sunday (02/10), the stock is of 37 units, the same amount of limit stock for Monday (02/11), thereby generating no need for replacement (on Monday).
It is important to notice that replacement is not done on weekends and, therefore, it is conside-red that the minimum, limit and maximum stock for the weekend are based on the cumulative forecast for Saturday and Sunday. For instance, on Saturday (02/16) the forecast returns a value of 21 units and Sunday (02/17) the sales forecast is of 14 units, so the minimum stock for the weekend is considered as the sum of this forecast, this is, 35 units.
level would fall until it was between the desirable levels according to the limit, minimum and maximum stocks set for this product, because while the product did not reach that level no product replacement would be made.
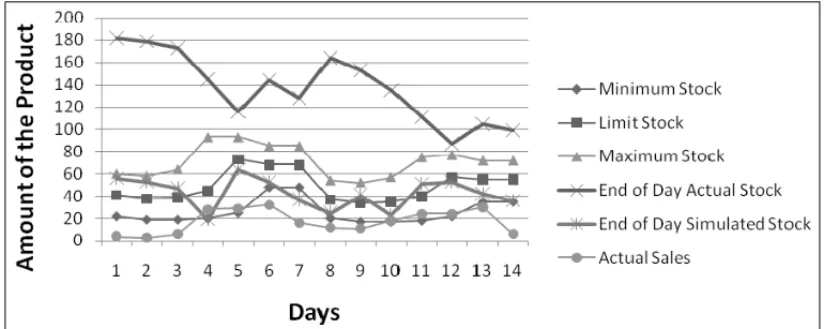
In Figure 6, below, there is a graphic example of the replacement schedule for two consecutive weeks, for a product with average turnover. On the first day of implementation of the proposed strategic planning, it is observed that that store’s actual stock for this product (“bleach – 1 liter”) is overrated. This is one of the situations encountered before the application of the method and in this case there was product overstocking. It should be noted that on day 4, the sales value should be compared with the simulated stock of the previous day, this is, the simulated stock of day 3, and also it should be considered that product replacement may occur the following day. Thus, it is evident that the level of simulated stock is always greater than the sales amount and, moreover, it is far below the actual stock that uses the current replacement strategy. The graph in this Figure 6 shows that the proposed strategy always ensures a safety stock and also, it brings the quantity available of each product to leaner levels, thereby generating more savings for the supermarket.
Figure 6– Comparison of stock levels between the current and the proposed strategies. Source: Authors.
Whenever in one day the actual stock levels are equal to the maximum stock, that is because the day before sales of this product made that level to be under the limit stock level, thus creating the replacement suggestion. Thus, the actual stock is now, on average, 50 to 200 units more than the minimum stock, considering that this product’s sales are on average between 50 and 80 products per day. The 9thday has zero as forecast, because this is a holiday (closed shop) and the proposed strategic planning allows entering this information into the model.
5 CONCLUSIONS
The purpose of this paper is to suggest a strategic plan for product replacement for retail super-market networks based on sales forecasts. The proposal is to initially capture the time series for each product, make the processing of such data by removing outliers and providing new data to replace the removed ones. The processed data of each product “feed” a Neural Network Radial Basis (RBF) to perform the sales forecast for that product. Finally, from the forecasted values the minimum, limit and maximum stocks are defined for that product in accordance with the company’s “coverage” policy, thus obtaining the replacement policy for each of the company’s products.
The proposed strategy was implemented in a company’s Grocery sector so it could be better understood. This sector has 8,000 products. Comparing every day the information found after applying the approach over all products in this sector, a replacement suggestion is obtained for each product, this is, the amount that should be taken of each product from the DC to each of the stores. The out-of-stock rates found during the research were 12% on average, this is, about 960 missing products on the shelves every day. After the implementation of the strategy proposed here, the out-of-stock levels fell on average from 12% to 0.7% in the hypermarkets, which represents only 56 missing products per day, and from 15% to 1.7% in the supermarkets, or 136 missing products on average.
Thus, the product mix of stores has increased significantly, causing a considerable increase in sales and level of service offered to customers. There was an increase of product variability in the replacement orders from stores to the DC, but in smaller quantities and with greater frequency. The days of coverage were defined by rating the products’ turnover and distributing the loading of trucks more evenly across all days of the week in which replacement occurs, from Monday through Friday, in average 33,000 boxes per day.
The increase in the stores’ product mix, the increase of replacement orders in smaller quantities and more frequently, increased sales and especially the lower out-of-stock levels show that the proposed replacement strategic planning is highly feasible and advisable for any company in this field. It appears that by using a more reliable sales forecasting system and by setting more as-sertive stock limits one has a “strong” tool to help decision making, once it combines qualitative methods for stock management and reliable quantitative algorithms.
REFERENCES
[1] ABRAS. Revista superhiper. Edic¸˜ao Maio de 2005. Dispon´ıvel em:
http://www.abrasnet.com.br/super/maio 2005 capa.asp, recuperado em 12/11/09.
[2] ABRAS. Revista superhiper. Edic¸˜ao Outubro de 2008. Dispon´ıvel em:
http://www.abras.com.br/superhiper/superhiper/edicoes-anteriores/?publicacao=11, recuperado em 27/11/09.
[3] ACNIELSEN. 2004. Ruptura: Causas e impactos na cadeia de abastecimento e no comportamento do consumidor.ECR Brazil Conference, S˜ao Paulo, SP.
[4] ALMEIDA FC & SIQUEIRA JO. 1997. Comparac¸˜ao entre regress˜ao log´ıstica e redes neurais na previs˜ao de falˆencia de bancos brasileiros.III Congresso Brasileiro de Redes Neurais, Florian´opolis, SC, 27–32.
[5] ANDERSON ET, GAVAN JF & SISMESTER D. 2006. Measuring and Mitigating the Costs of Stockouts.Management Science,52(11): 751–1763.
[6] ANGELOˆ CF & SIQUEIRAJPL. 2000. Avaliac¸˜ao das condic¸˜oes log´ısticas para a adoc¸˜ao do ECR nos supermercados brasileiros.Revista de Administrac¸˜ao Contemporˆanea (RAC),4(3): 89–106.
[7] ATAMANCZUKMJ. 2009.Modelo de Arranjo F´ısico de Armazem Baseado em Classificac¸ ˜ao de Es-toque de Supermercado. Dissertac¸˜ao de Mestrado em Engenharia de Produc¸˜ao, Universidade Federal Tecnol´ogica do Paran´a, Ponta Grossa, PR.
[8] ATKINSONAC, KOOPMANSJ & SHEPHARDN. 1997. Detecting shocks: outliers and breaks in time series.Journal of Econometrics,80: 387–422.
[9] BALLOU RH. 2006.Log´ıstica empresarial: transporte, administrac¸ ˜ao de materiais e distribuic¸ ˜ao
f´ısica. Bookman, 5aed., Porto Alegre, RS.
[10] BARAJAS RF. 2004. Optimizando la disponibilidad de producto para el consumidor. LOGYCA – Log´ıstica y Cadena de Valor, IAC Colˆombia.
[11] BENETTIKC, GIRARDID, RODRIGUEZCMT & CORTESAF. 2008. Modelo de avaliac¸˜ao de de-sempenho log´ıstico de um centro de distribuic¸˜ao do setor supermercadista.XI SEMEAD – Empreen-dedorismo em Organizac¸˜oes.
[12] BHARGAVAHK, DAEWONS & XUSH. 2006. Stockout Compensation: Joint Inventory and Price Optimization in Electronic Retailing.Journal on Computing,18(2): 255–266.
[13] BOX GEP, JENKINS GM & REINSEL G. 1994. Time series analysis, forecasting and control. Prentice Hall, 3rded., Englewood Cliffs, NJ.
[14] BOWERSOXDJ & CLOSSDJ. 1996.Logistical Management – The Integrated Supply Chain Process, McGraw-Hill, 1sted. New York, NY.
[15] BOWERSOXDJ & CLOSSDJ. 2001.Log´ıstica empresarial. Atlas, S˜ao Paulo, SP.
[16] BUCHTLA O, KLIMEK M & SICKB. 2005. Evolutionary Optimization of Radial Basis Function Classifiers for Data Mining Applications.IEEE Transactions on Systems, Man, and Cybernetics –
part b: cybernetics,35(5): 928–947.
[17] CALOBAGM, CALOBALP & SALIBYE. 2002. Cooperac¸˜ao entre redes neurais artificiais e t´ecnicas ‘cl´assicas’ para previs˜ao de demanda de uma s´erie de vendas de cerveja na Austr´alia.Pesquisa
[18] CAMPOK, GIJSBRECHTSELS & NISOLP. 2000. Towards Understanding Consumer Response to Stockouts.Journal of Retailing,76(2): 219–242.
[19] CARRERAMA, MIOLAA, FRUCHICR & CALVOEA. 2008. Just-in-time: Uma filosofia a servic¸o da administrac¸˜ao.XV SIMPEP – Sistemas de Informac¸ ˜ao e Gest˜ao de Conhecimento, Bauru, SP.
[20] CARVALHO RB, OLIVEIRALG & JAMIL GL. 2007. Gest˜ao da informac¸˜ao aplicada `a log´ıstica: Estudo de caso de uma grande agroind ´ustria Brasileira.VIII ENANCIB – Encontro Nacional de Pes-quisa em Ciˆencia da Informac¸˜ao. GT 4 – Gest˜ao da Informac¸˜ao e do Conhecimento nas Organizac¸ ˜oes, Salvador, BA.
[21] CHRISTOPHERM. 1997.Log´ıstica e Gerenciamento da Cadeia de Suprimentos – Estrat´egias para
Reduc¸˜ao de Custos e Melhoria dos Servic¸os, Ed. Pioneira, 1aed., S˜ao Paulo, SP.
[22] CHRISTOPHER M. 2002.Log´ıstica e gerenciamento da cadeia de suprimentos: estrat´egias para reduc¸˜ao de custos e melhoria dos servic¸os. Thomson, S˜ao Paulo, SP.
[23] COELHO LS & CANCIGLIERI JR O. 2000. Rede neural de base radial aplicada em previs˜ao de s´eries temporais: algoritmo e aplicac¸˜ao.XX ENEGEP – Construindo competˆencias para a manufatura internacional.
[24] CORREAHL, CORREACA. 2004.Administrac¸˜ao de produc¸˜ao e operac¸˜oes: Manufatura e servic¸os: uma abordagem estrat´egica. Atlas, S˜ao Paulo, SP.
[25] CORREAˆ WR & PORTUGALM. 1998. Previs˜ao de s´eries de tempo na presenc¸a de mudanc¸a estrutu-ral: Redes neurais artificiais e Modelos estruturais.XVIII Internacional Symposium on Forecasting. Vers˜ao Traduzida, Edinburg, Esc´ocia.
[26] CORSTENDS & GRUENTW. 2003. Desperately Seeking Shelf Availability: An Examination of the Extent, the Causes, and the Efforts to Address Retail Out-of-Stocks.International Journal of Retail
& Distribution Management,31(12): 605–615.
[27] CZAPSKIC. 2008. O desafio da resposta eficiente nas g ˆondolas.Revista Log´ıstica. S´erie Resposta Eficiente, 30–31.
[28] DALLACOSTAAJ. 2004. A importˆancia da log´ıstica no varejo brasileiro: O caso do P˜ao de Ac¸´ucar.
Cadernos da Escola de neg´ocios da Unibrasil,2: 65–84.
[29] DELUCA, A. 2004. Tercer est´udio de Faltantes de mercader´ıa em gˆondolas.FMG III. Ahold.
[30] DIASGPP. 1998. Proposta de processo de previs˜ao de vendas para bens de consumo.Anais do XVI
ENEGEP – 16◦Encontro Nacional de Engenharia de Produc¸ ˜ao, Rio de Janeiro, RJ.
[31] DIASGJC. 2006.Planejamento estrat´egico de um centro de distribuic¸˜ao: uma aplicac¸˜ao de redes neurais artificiais de func¸˜oes de bases radiais para previs˜ao de s´eries temporais. Dissertac¸˜ao de Mes-trado. Programa de M´etodos Num´ericos em Engenharia, Universidade Federal do Paran´a, Curitiba, PR.
[32] DII – DEPARTAMENTO DEINGENIERIAINDUSTRIAL. 2004.Primer est´udio de FMG em la industria Chilena se supermercado. Universidad de Chile. Facultad de Ciencias Fisicas y Matematicas.
[33] FARAHJRM. 2002. Os Desafios da log´ıstica e os centros de distribuic¸˜ao f´ısica.Revista FAE Business, 2: 44–46.
[35] FERNANDESLGL, PORTUGALMS & NAVAUXPOA. 1996. Previs˜ao de s´eries de tempo: Redes Neurais Artificiais e Modelos Estruturais.Pesquisa e Planejamento Econˆomico,26(2): 253–276.
[36] FIGUEIREDOK. 2006. A log´ıstica enxuta. Centro de Estudos em Log´ıstica – COPPEAD/UFRJ. Rio de Janeiro, RJ.
[37] GARCIAES & FERREIRAFILHOVJM. 2009. C´alculo do ponto de pedido baseado em previs ˜oes de uma pol´ıtica<Q,r>de gest˜ao de estoques.Pesquisa Operacional,29(3): 605–622.
[38] GONZALEZJ, ROJASI, ORTEGAJ, POMARESH, FERNANDEZ´ FJ & D´IAZAF. 2006. Multiobjec-tive Evolutionary Optimization of the Size, Shape, and Position Parameters of Radial Basis Function Networks for Function Approximation.IEEE Transactions on Neural Networks,14(6): 1478–1495.
[39] GRUDTNER¨ IS. 2005. Modelo de avaliac¸˜ao de desempenho log´ıstico de operadores log´ısticos. Dissertac¸˜ao de Mestrado em Engenharia de Produc¸˜ao – Programa de P´os-Graduac¸˜ao em Engenharia de Produc¸˜ao, UFSC, Florian´opolis.
[40] GRUEN TW, CORSTEN DS & SUNDAR BHARADWAJ S. 2002. Retail Stockouts: A Worldwide Examination of Extent, Causes and Consumer Responses, The Food Marketing Institute and CIES – The Food Business Forum.
[41] GRUENTW & CORSTENDS. 2007a. A Comprehensive Guide To Retail Out-of-Stock Reduction In the Fast-Moving Consumer Goods Industry, University of Colorado. USA and Business School, Madrid, Espanha.
[42] GRUENTW. 2007b. Retail Out-of-Stocks: A worldwide examination of extent causes, and consumer responses (and some solutions). RETECHCLA – Retail Technologies for Latin America.
[43] HAYKINS. 1994.Neural Networks: A comprehensive foundation. Macmillan, Nova York.
[44] IBGE (INSTITUTO BRASILEIRO DE GEOGRAFIA E ESTAT´ISTICA) 2007. Dispon´ıvel em: http://www.ibge.gov.br/home/estatistica/indicadores/comercio/pmc/default.shtm, recuperado em 10/11/09.
[45] LAZZAROTTO LL, OLIVEIRA AP & LAZZAROTTO JJ. 2006. Aspectos te´oricos do data mining e aplicac¸˜ao das redes neurais em previs ˜oes de prec¸os agropecu´arios.Anais do XLIV Congresso da
Sociedade Brasileira de Economia e Sociologia Rural– Quest˜oes Agr´arias, Educac¸˜ao no Campo e
Desenvolvimento, Fortaleza, CE.
[46] LIMAFG & ALMEIDAFC. 2004. Previs˜ao de s´eries temporais financeiras com o uso das Wavelets. XXXVIII EnANPAD, Curitiba, PR.
[47] LUCASJRHC. 2006.Tecnologia da informac¸˜ao: tomada de decis˜ao estrat´egica para administrado-res. LTC, Rio de Janeiro, RJ.
[48] MELOB, MILIONIAZ & NASCIMENTOJRCL. 2007. Daily and Monthly sugar price forecasting using the mixture of local expert models.Pesquisa Operacional,27(2): 235–246.
[49] MUSAVIMT, AHMED, W, CHANKH, FARISKB & HUMMELSM. 1992. On the training of radial basis function classifiers.Neural Networks,5(4): 595–603.
[50] PEDRO LRM. 2006. Como trabalhar junto com fornecedores para a reduc¸˜ao do stock-out. 23a Reuni˜ao do Roundtable Brasil, CSCMP.
[52] ROJASI, POMARESH, GONZALEZ´ J, ROSE, SALMERON´ M, ORTEGAJ & PRIETOA. 2000. A new radial basis function networks structure: Application to time series prediction.Proc. IEEE-INNS-ENNS Int. Joint Conf. Neural Networks, S.I. Amari, C.L. Giles, M. Gori, and V. Piuri, Eds, Como, Italy: IEEE Computer Society, IV, 449–454.
[53] VASCONCELLOSLHR, SAMPAIOM & PASTORESR. 2007. Log´ıstica de varejo: Uma an´alise so-bre a quest˜ao da ruptura de estoque e suas causas no setor supermercadista paulista sob a ´otica dos gestores do neg´ocio. N´ucleo de Pesquisa e Publicac¸˜ao. Escola Superior de Propaganda e Marketing, S˜ao Paulo, Relat´orio de Pesquisa.
[54] WANKE P & FLEURYPF. 2009. O paradigma do ressuprimento enxuto: Armadilha na gest˜ao do fluxo de materiais entre elos da cadeia de suprimentos.
<http://www.ilos.com.br/site/index.php?option=com docman&task=doc details&gid=96&Itemid=44>. Acesso