ISSN 0104-6632 Printed in Brazil
www.abeq.org.br/bjche
Vol. 31, No. 04, pp. 895 - 903, October - December, 2014 dx.doi.org/10.1590/0104-6632.20140314s00002895
Brazilian Journal
of Chemical
Engineering
EFFECT OF INTERNAL RECIRCULATION
VELOCITY IN AN ANAEROBIC SEQUENCING
BATCH REACTOR (ASBR)
G. Z. Maurina
1*, L. M. Rosa
1, L. L. Beal
1, C. Baldasso
1, J. R. Gimenez
1,
A. P. Torres
2and M. P. Sousa
21
Laboratory of Environmental Technology, University of Caxias do Sul, 1130 Franciso Getúlio Vargas st., Caxias do Sul - RS, Brazil.
Phone: + (55) (54) 3218 2100 E-mail: [email protected]
2
Cenpes, Petrobras, 950 Horácio Macedo Avenue, Rio de Janeiro - RJ, Brazil.
(Submitted: August 14, 2013 ; Revised: October 30, 2013 ; Accepted: November 13, 2013)
Abstract - This paper discusses the effect of different internal recirculation velocities on the mixture and shear stress on the flocs in an anaerobic sequencing batch reactor (ASBR). Thus, simulations are performed using a computational fluid dynamics (CFD) tool to evaluate this dependency. The analysis of velocities and turbulent kinetic energy indicates that the highest flow evaluated (0.003 m³/s) results in better mixing within the reactor. However, care must be taken with the recycling pipe size, in order to maintain the shear stress inside the range of optimal values.
Keywords: Computational fluid dynamics; Anaerobic processes; Anaerobic sequencing batch reactor.
INTRODUCTION
Currently, anaerobic processes have experienced a very significant development. They are a low cost technology and can be applied in processes such as wastewater treatment, production of biogas and bio-hydrogen.
One of the most used system is the anaerobic se-quencing batch reactor (ASBR), which has been widely studied since the early nineties (Fernandes et al., 1993; Brito et al.,1997; Arooj et al., 2007; Kim
et al., 2008).
The operation of an ASBR takes place in a single tank and comprises the following steps: (i) filling with wastewater; (ii) treatment by means of biotrans-formations of the wastewater constituents by micro-bial activity; (iii) settling of the biological sludge after reaction termination; (iv) discharge of the re-actor (Pinheiro et al., 2008; Michelan et al., 2009).
Most of the operation time is spent in step (ii), when the liquid is continuously recirculated to promote agi-tation. This sequence is repeated for each new batch.
Many are the variables that affect the perform-ance of ASBRs, such as agitation, initial ratio be-tween substrate and biomass concentrations, geomet-ric configuration of the reactor, temperature and feeding strategy (Novaes et al., 2010). Special atten-tion should be given to agitaatten-tion, especially in large scale applications, since it improves mass transfer and therefore increases the substrate consumption rate, which may reduce the total cycle length. Agita-tion is important not only to provide good mixing conditions (homogenization, improved contact be-tween biomass and liquid medium) or increase mass transfer, but also to improve the solubilization of particulate organic matter, which may increase over-all conversion and substrate consumption rates (Pinho
There are several ways to provide agitation in these systems, including recirculation of biogas, liq-uid recirculation and mechanical stirring. Mixing is usually accomplished in ASBRs by mechanical agi-tation or by recirculation of the biogas generated in the process (Michelan et al., 2009). However, Brito
et al. (1997) and Pinheiro et al. (2008) established that biogas production may be insufficient to pro-mote the turbulence that is required to minimize both the occurrence of possible stagnant zones and mass transfer resistance. Thus, Brito et al. (1997) devel-oped an ASBR where agitation was accomplished by recirculation of the effluent by means of a diaphragm pump, and concluded that it is possible to use efflu-ent recirculation as a means of agitation. Pinheiro et al. (2008) evaluated the optimum recirculation ve-locity for an ASBR used in wastewater treatment, and found that the system is limited by mass transfer when operating with lower velocities.
However, higher velocities might reduce micro-bial activity due to excessive shearing, which may damage the flocs present in the biomass (Michelan
et al., 2009) and cause granule rupture, resulting in poor solid separation (Bannari et al., 2011). From an engineering point of view, the hydrodynamic shear force, as a governing parameter, can be manipulated to enhance the active sludge granulation process for wastewater treatment (Ren et al., 2009).
To study the influence of different forces on the fluid dynamics, many researchers have turned to computational fluid dynamics (CFD). The advance-ment of computer performance in the last decades has enabled the prediction of flow fields and im-proved mixing performance in anaerobic digesters. Ding et al. (2010) presented three-dimensional CFD simulations of a gas-liquid two-phase flow agitated by a mechanical impeller in a lab-scale continuous stirred-tank reactor (CSTR) for biohydrogen produc-tion. It has been shown that the impeller type and speed significantly affect flow patterns: the relation between hydrodynamics and biohydrogen production indicated that an impeller operating at speeds be-tween 50 and 70 rpm provided better reactor per-formance. Wang et al. (2010) introduced the CFD methodology developed by Ding et al. (2010) into the investigation of scale-up mechanisms for the CSTR, and indicated that parameters such as velocity field and stagnation zone needed to be optimized in industrial-scale reactors. Yu et al. (2013) associated the multi-fluid model with the Kinetic Theory of Granular Flow (KTGF) and Anaerobic Digestion Model no.1 (ADM1) to improve the performance of an anaerobic digester, where settling and suspension are very important phenomena to retain biomass.
In this context, the aim of this work is to employ CFD techniques to study the effect of liquid recir-culation velocity on the performance and stability of an ASBR. The modeling method developed and the results of this study should provide a better under-standing of the mixing inside the reactor, which can improve momentum and mass transfer, and aid in finding a good balance between mass transfer and shear stress distributions.
METHODOLOGY
Reactor Configuration and Operational Conditions
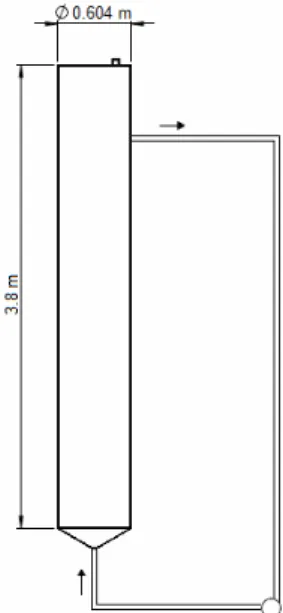
The reactor studied in this work consists of a pilot scale ASBR used to produce biohydrogen, located currently in an industrial plant in Campinas, Brazil. It has an internal diameter of 0.604 m, height of 3.8 m and a total capacity of 1.0 m3. As the initial condition, the ASBR is considered to be filled with wastewater and biogas. The simulation starts with the liquid recycle, which promotes agitation in the bioreactor. The recycling pipe has an internal diame-ter of 0.04 m. A diagram of the reactor is shown in Figure 1. In the experimental setup, a pipe is placed at the top, and is used to withdraw the produced bio-gas. In the simulations presented here, fermentation reactions are not considered, thus gas is not produced and this region was treated as a wall. The recycle pipe was replaced by inlet and outlet conditions.
Figure 1:Schematic diagram of the ASBR studied.
the effect of the flow rate increase on the efficiency of mixing, three cases with different operational con-ditions were initially considered. The flow rates adopted were 0.0015, 0.00225 and 0.0030 m3.s-1, cor-responding to 1, 1.5 and 2 times the original con-dition. The Newtonian fluid adopted for simulations has rheological properties similar to the mixture of microbial culture and substrate composed of vinasse and glycerin, discarded respectively in conventional alcohol plants and biodiesel units. The gas phase has the properties of biogas.
Mathematical Modeling
Simulations were conducted with the OpenFOAM CFD toolbox. The solver used to carry out the simu-lations adopts the Eulerian-Eulerian approach, which is also referred to as the two-fluid model, where both phases are treated as interpenetrating fluids. The en-semble-average mass and momentum conservation equations are used to describe the time-dependent motion of both phases. Averaged interaction terms describing the interfacial forces appear in the mo-mentum balance of both phases. The phases are com-posed of (1) a continuous liquid mixture, and (2) gas bubbles. Gas is expected to be present only in the top section of the reactor, with the presence of bubbles only at the interface between fluid and gas.
The formulation described by Weller (2002) apud
Rusche (2002) for incompressible two-phase flow is adopted. In this formulation, the momentum equation of the phase is divided by the respective volume fraction, to avoid the singularity that may occur at the limit of one phase fraction approaching zero. The balance equations for continuity and intensive mo-mentum can be written using Equations (1) and (2):
( ) ( )
αg + αgU +(
Ur gα(
1 αg)
)
=0 t∂ ∇ ∇ −
∂ (1)
( )
.( )
.( )
.( )
( )
eff i eff
i i i i i
i
i
i i i
α
U +U U + R + R =
t α
p M
+ g +
ρ α ρ
∂ ∇ ∇ ∇
∂ + δ
∇ −
+ δ
(2)
where the i subscript indicates the phase, liquid (l) or gas (g). U and α represent the velocity vector and the phase fraction. δ is a small value (0.001), ap-plied to avoid zero division errors which could arise in the absence of one phase
(
αi =0)
. The term Rieffrepresents the combined Reynolds (turbulent) and viscous stress, as defined in Equation (3):
2 2
. 0
3 3
eff eff T
i i i i
i i
R =−υ ⎛⎜∇U + U∇ − I∇U ⎞⎟+ Ik =
⎝ ⎠ (3)
where υieff is the effective viscosity of the phase, I is the unit tensor, and k is the turbulent kinetic energy.
In Equation (2), Mi represents the momentum transferred due to the sum of interfacial forces. Ac-cording to Chen et al. (2005) and Silva et al. (2012), gas-liquid flows in bubble columns are dominated by the drag force and, if it is modeled correctly, the drag force can establish the flow pattern without the ad-diction of other interfacial forces. In the present study, the interaction between gas bubbles and liquid is due only to the interface of liquid and gas phases. Thus, forces such as lift, virtual mass and turbulent dispersion have a minimum effect on the flow, and the drag force should be sufficient to describe the gas-liquid interaction. Mi is expressed according to Equation (4):
3 4
g l
g l D r r
g
α ρ
M = M = C U U
d
− (4)
where Ur is the relative velocity between the phases,
g
d represents the bubble diameter, and CD is the drag coefficient, obtained using the Schiller and Naumann correlation (Equation (5)):
(
)
(
)
0.687 24
1 0.15Re when Re 1000
Re
0.44 when Re 1000
D + C = ⎧ ≤ ⎪ ⎪ ⎨ ⎪ ≥ ⎪ ⎩ (5)
where
Re
denotes the bubble Reynolds number, de-fined in Equation (6):Re r g
l
U d =
υ (6)
The k-epsilon turbulence model was used to determine the effects of turbulence in the liquid phase. The effective viscosity of the continuous phase is given by the sum of the laminar viscosity υl and the eddy viscosity υt, which is calculated with Equation (7):
(
2)
/
t
μ
Conservative equations for k and epsilon are presented in Equations (8) and (9), respectively:
( ) (
.)
.eff l
l l l l k l
k
υ
k + U k k P ε
t
⎛ ⎞
∂ ∇ −∇ ∇ = −
⎜ ⎟
⎜ ⎟
∂ ⎝ ⎠ (8)
( ) (
.)
.(
1 2)
eff
l l
l l l l k l
ε l
υ ε
ε + U ε C P C ε
t k
⎛ ⎞
∂ ∇ ε −∇ ∇ = −
⎜ ⎟
⎜ ⎟
∂ ⎝ ⎠ (9)
where Pk is the production of turbulent kinetic energy, obtained using Equation (10):
(
)
(
)
(
)
2υeff . T
k l l l l
P = ∇U dev ∇U + ∇U (10)
The values used for the coefficients of the k-epsilon
model are shown in Table 1.
Table 1: Coefficients used in the k-epsilon model.
Cμ C1 C2 σκ σε
0.09 1.44 1.92 1.0 0.76923
Numerical Solution and Boundary Conditions
OpenFOAM solvers use the finite volume method to solve systems of partial differential equations applied to any 3D unstructured mesh of polyhedral cells. New solvers and utilities can be created with the knowledge of the underlying method, physics and programming techniques involved (Bannari et al., 2008). The simulations carried out in this work available in version 2.2.1 of OpenFOAM. This solver uses a comprehensive list of interpolation schemes. In this work, linear Gaussian integration for gradient operators was chosen. It is based on summing values on cell faces, which must be interpolated from cell centers. A Gauss linear scheme, which interpolates variables based on fluxes, was used for discretization of divergence terms. For the first time derivative, the choice was the Euler implicit first order technique (Rusche, 2002; OpenFOAM, 2013). The solution of the resulting equations is made with the segregated technique, solving each set of algebraic equations separately within an iterative cycle with an appropri-ate solver until convergence is achieved. A special treatment is required in order to establish the neces-sary inter-equation coupling, thus the solution of the pressure equation provides corrections for updating
pressure, flux and velocities, satisfying the continuity criterion.
The numerical solution is based on a mix between the SIMPLE and PISO algorithms to handle the pressure-velocity coupling. It involves a momentum predictor and a correction loop in which a pressure equation based on the volumetric continuity equation is solved, and the momentum is corrected based on the pressure change (Rusche, 2002). Iterative methods are used to solve the system of algebraic equations created by discretization of partial differential equa-tions. The generalized "Geometric-Algebraic Multi-Grid" (GAMG) solver was used to solve for the pressure with tolerance equal to 1×10⁻⁸, "Precondi-tioned Bi-Conjugate Gradient" (PBiCG) was used to solve for the dissipation and turbulent kinetic energy, with tolerance equal to 1×10⁻⁵, and "Preconditioned Conjugated Gradient" (PCG) was used to solve for the phase fraction with tolerance equal to 1×10⁻¹⁰.
To guarantee temporal accuracy and numerical stability, a Courant-Friedrichs-Lewy (CFL) condi-tion of less than one was applied, avoiding the need of use relaxation factors. This resulted in variable time steps for the transient simulations, mostly under 10-3 s. They were processed in parallel, using four cores in a Z600 HP workstation. Each simulation had 300 s of flow calculated, with the last 100 s used to obtain average values.
With a three-dimensional geometry of the reac-tor, automatic meshes were generated using the "snappyHexMesh" software. They were composed predominantly of hexahedral volumes, with polyhe-dral elements to adjust the volumes close to the geometry surfaces. Seven meshes were evaluated, with approximately 60,000, 90,000, 130,000, 150,000, 170,000, 190,000 and 210,000 control volumes. The results of pressure and velocity in multiphase simula-tions were used as mesh evaluation criteria, in order to determine the optimal mesh size to carry out this study. It was found that 130,000 control volumes are sufficient to correctly estimate the flow in this reactor. This mesh is illustrated in Figures 2A and 2B. It has y+ values (dimensionless measure of the thickness of the control volumes adjacent to the walls of the reactor) approximately equal to 37, which is suitable for turbulent cases simulations.
Figure 2: Details of the mesh used: (A) superior section and (B) inferior section at the walls; and (C) transversal cut.
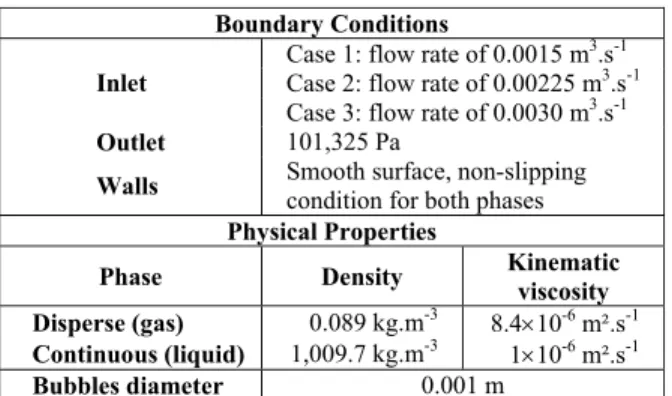
Table 2: Boundary conditions and physical proper-ties used in the numerical simulations.
Boundary Conditions
Case 1: flow rate of 0.0015 m3.s-1 Case 2: flow rate of 0.00225 m3.s-1 Inlet
Case 3: flow rate of 0.0030 m3.s-1
Outlet 101,325 Pa
Walls Smooth surface, non-slipping
condition for both phases
Physical Properties
Phase Density Kinematic viscosity Disperse (gas) 0.089 kg.m-3 8.4×10⁻⁶ m².s-1 Continuous (liquid) 1,009.7 kg.m-3
1×10⁻⁶ m².s-1
Bubbles diameter 0.001 m
The boundary conditions for k and epsilon at the inlet were calculated using Equations (11) and (12), respectively:
(
)
2, 3
0.05 2 l inlet
k= U (11)
3/2 3/4
0.2
k C
L
μ
ε = (12)
where 0.05 represents the turbulence intensity at the inlet (5%), and L the characteristic length, depending on the inlet diameter.
Shear Stress Determination
As already mentioned, the shear stress is an im-portant parameter affecting bioreactors, as it strongly influences the floc morphology, and thus the activity of microorganisms. The maximal shear stress in each
control volume is evaluated using Equation (13), proposed by Bannari et al. (2011):
(
)
max=μeff.max xy , xz , yz , xx , yy , zz (13)
RESULTS AND DISCUSSION
Three cases are initially presented, considering different flow rates. The average results obtained for Case 1, with a flow rate of 0.0015 m³.s-1, are shown in Figure 3. This figure shows planes that cut the reac-tor along its height. It can be noted in Figure 3A that most of the liquid phase mixing speed of the liquid phase is maintained below 0.3 m/s and the maximal speed (1.5 m.s-1) is found in the lower portion of the reactor, at the inlet pipe.
The flow inside the reactor shows no preferential paths, as can be seen in Figure 3B. The velocity vectors in this figure were normalized to better show the presence of large vortices. There are no vectors at the top, as the reactor is filled with gas in this region. The lower speeds inside the reactor, associated with the analysis of turbulent kinetic energy (Figure 3C), indicates the existence of areas with low mixing, mainly located in the top portion of the reactor.
Figure 3: Case 1: (A) mixture velocity; (B) velocity vectors; (C) turbulent kinetic energy.
Figure 4: Case 2: (A) mixture velocity; (B) velocity vectors; (C) turbulent kinetic energy.
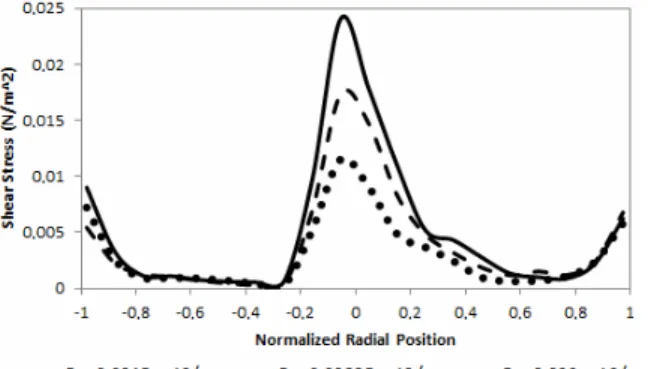
According to Nurtono et al. (2012), the maximal shear stress recommended in bioreactors is 0.66808 N.m-2. Above this limit, there may be a disruption of the flocs that serve as support for the microbial activity. Figure 6 shows the values of maximal shear stress (Equation (13)) collected in a line along the diameter of the reactor, at 0.25 meters of height. These values are higher near the center, due to the inlet stream, and also near the walls of the bioreactor. It is observed that the highest flow rate provided larger values of shear stress, but they are below the given threshold. The maximal values were observed in the regions close to the recycling pipes, being equal to 0.531, 0.635 and 0.846 N.m-2 for Cases 1, 2 and 3, respectively (Figure 7). Thus, the highest flow rate considered can lead to degradation of the flocs, and an inefficient operation of the reactor.
The problem observed in Case 3, in which the val-ues of shear stress are above the recommended thresh-old, can be solved using recycle pipes with larger
di-ameters, resulting in lower maximal velocities. Thus, three new diameters, of 0.048, 0.06 and 0.08 m were tested for the highest flow rate evaluated (0.0030 m3.s-1). As can be seen in Figure 8A, using a diameter of 0.048 m for the recycling pipes causes a small reduc-tion in the shear stress, but it is still above the limit of 0.66808 N.m-2. Figures 8B and 8C show the maxi-mal shear stress values obtained using diameters of 0.06 and 0.08 m, respectively. A significant reduction in shear stress was observed, with the maximal
val-ues below the limit proposed by Nurtono et al.
(2012). The use of different inlet diameters alters the flow pattern inside the bioreactor, but retains high values of turbulent kinetic energy, without the pres-ence of stagnant zones. Thus, the adoption of a di-ameter of 0.06 m for the recycling pipes, using the highest flow rate (0.0030 m3.s-1) considered, can lead to a significant increase in the mixture inside the reactor, without affect the form of the flocs, improv-ing the efficiency of the reactor.
Figure 6: Maximal shear stress along the normalized radial position, at 0.25 m of height.
Figure 7: Maximal shear stress at the inlet pipe: (A) Case 1; (B) Case 2; (C) Case 3.
CONCLUSIONS
The fluid dynamics in an ASBR, operating with upward flow, was determined through numerical simu-lations. Three recycle flow rates were evaluated, and the results obtained for the velocity and turbulent kinetic energy indicate that the higher the flow con-sidered, the greater is the mixture provided by the fluid within the reactor. Low values were observed for the maximal shear stress calculated inside the reactor. However, in the regions of higher velocities (close to the recycle pipeline) the values for the maxi-mal shear stress observed were above the recom-mended range for Case 3.
This problem can be solved using recycle pipes of larger diameter, to maintain the integrity of the flocs in the case of higher flow rate, resulting in a better performance of the reactor. Results indicate that the best configuration for the reactor studied in this paper considers the use of larger pipes (0.06 m), with a higher flow rate (0.0030 m3.s-1).
It can also be concluded that CFD tools can be valuable to study the behavior of reactors. In the pre-sent study, different conditions were verified with numerical simulations, and their influence on the performance of the reactor was verified, leading to a possible optimization of the current process.
ACKNOWLEDGEMENTS
The authors are grateful to CENPES/Petrobras and FAPERGS for the financial support.
NOMENCLATURE
Latin Letters
Cμ, C1, C2 constant of the k-epsilon
turbulence model
0.09, 1.44, 1.92
CD drag coefficient (-)
d bubble diameter m
g acceleration due to gravity m.s-2
I unit tensor (-)
k turbulent kinetic energy m2.s-2
L length scale m
Le eddy length scale m
M interphase momentum
exchange term
N.m-3
p pressure Pa
P production of turbulent
kinetic energy
Pa.s-1
R combined Reynolds
(turbulent) and viscous stress
m.s-1
Re bubble Reynolds number (-)
t time s
U average velocity m.s-1
Ur average relative velocity m.s
-1
Greek Letters
α volume fraction (-)
ρ density kg.m-3
υ kinematic viscosity m2.s-1
ε turbulent dissipation
energy
m2.s-3
τ shear stress N.m-2
μ dynamic viscosity kg.m-1.s-1
σκ, σε constant of the κ-ε turbulence model
1.0, 0.76923
υl laminar viscosity m
2
.s-1
υt eddy viscosity m2
.s-1
Subscripts
eff Effective
g gas phase
i phase
l liquid phase
T transposed vector
REFERENCES
Arooj, M. F., Han, S. K., Kim, S. H., Kim, D. H., Shin, H. S., Sludge characteristics in anaerobic SBR system producing hydrogen gas. Water Re-search, 41, p. 1177-1184 (2007).
Bannari, R., Bannari, A., Selma, B., Proulx, P., Mass transfer and shear in an airlift bioreactor: Using a mathematical model to improve reactor design and performance. Chemical Engineering Science, 66, p. 2057-2067 (2011).
Bannari, R., Kerdouss, F., Selma, B., Bannari, A., Proulx, P., Three-dimensional mathematical mod-eling of dispersed two-phase flow using class method of population balance in bubble columns. Computer and Chemical Engineering, 32, p. 3224-3237 (2008).
Chen, P., Sanyal, J., Dudukovic, M. P., Numerical simulation of bubble columns flows: Effect of different breakup and coalescence closures. Chemical Engineering Science, 60, p. 1085-1101 (2005).
Ding, J., Wang, X., Zhou, X. F., Ren, N. Q., Guo, W. Q., CFD optimization of continuous stirred-tank (CSTR) reactor for biohydrogen production. Bio-resource Technology, 101, p. 7005-7013 (2010). Fernandes, L., Kennedy, K. J., Ning, Z., Dynamic
modeling of substrate degradation in sequencing batch anaerobic reactors (SBAR). Water Re-search, 27, p. 1619-1628 (1993).
Kim, D. H., Kim, S. H., Ko, I. B., Lee, C. Y., Shin, H. S., Start-up strategy for continuous fermenta-tive hydrogen production: Early switchover from batch to continuous operation. International Jour-nal of Hydrogen Energy, 33, p. 1532-1541 (2008). Michelan, R., Zimmer, T. R., Rodrigues, J. A. D.,
Ratusznei, S. M., Moraes, D., Zaiat, M., Foresti, E., Effect of impeller type and mechanical agita-tion on the mass transfer and power consumpagita-tion aspects of ASBR operation treating synthetic wastewater. Journal of Environmental Manage-ment, 90, p. 1357-1364 (2009).
Novaes, L. F., Saratt, B. L., Rodrigues, J. A. D., Ratusznei, S. M., Moraes, D., Ribeiro, R., Zaiat, M., Foresti, E., Effect of impeller type and agita-tion on the performance of pilot scale ASBR and AnSBR applied to sanitary wastewater treatment. Journal of Environmental Management, 91, p. 1647-1656 (2010).
Nurtono, T., Nirwana, W. O. C., Anwar, N., Kusdianto, Nia, S. M., Widjaja, A., Winardi, S., A computa-tional fluid dynamics (CFD) study into a hy-drodynamic factor that affects a bio-hydrogen production process in a stirred tank reactor. Pro-cedia Engineering, 50, p. 232-245 (2012). OpenFOAM, OpenFOAM User Guide (2013).
Pinheiro, D. M., Ratusznei, S. M., Rodrigues, J. A. D., Zaiat, M., Foresti, E., Fluidized ASBR treat-ing synthetic wastewater: Effect of recirculation velocity. Chemical Engineering and Processing, 47, p. 184-191 (2008).
Pinho, S. C., Ratusznei, S. M., Rodrigues, J. A. D., Foresti, E., Zaiat, M., Feasibility of treating par-tially soluble wastewater in an aerobic sequenc-ing batch biofilm reactor (AnSBBR) with me-chanical stirring. Bioresource Technology, 96, p. 517-519 (2005).
Ren, T. T., Mu, Y., Liu, L., Li, X. Y., Yu, H. Q., Quantification of the shear stresses in a microbial granular sludge reactor. Water Research, 43, p. 4643-4651 (2009).
Rusche, H., Computational fluid dynamics of dis-persed two-phase flows at high phase fraction. Ph.D. Thesis, Department of Mechanical Engi-neering, Imperial College of Science, Technology and Medicine, University of London, London, UK (2002).
Silva, M. K., D'Ávila M. K., Mori M., Study of the interfacial forces and turbulence models in a bub-ble column. Computers and Chemical Enginee-ring, 44, p. 34-44 (2012).
Wang, X., Ding, J., Guo, W. Q., Ren, N. Q., Scale-up and optimization of biohydrogen production reac-tor from laborareac-tory-scale to industrial-scale on the basis of computational fluid dynamics simula-tion. International Journal of Hydrogen Energy, 35, p. 10960-10966 (2010).
Weller, H. G., Derivation, modeling and solution of the conditionally averaged two-phase flow equa-tions. Technical Report TR/HGW/02, Nabla Ltd. (2002).