ISSN 0104-6632 Printed in Brazil www.abeq.org.br/bjche
Vol. 25, No. 03, pp. 491 - 501, July - September, 2008
Brazilian Journal
of Chemical
Engineering
ANALYSIS OF HEAT AND MASS TRANSFER
DURING MICROWAVE DRYING OF FOOD
PRODUCTS
A. K. Haghi
*and N. Amanifard
University of Guilan, Phone: +(98) 9111318290 P. O. Box 3756, Rasht, Iran.
E-mail:[email protected]
(Received: August 18, 2006 ; Accepted: March 7, 2008)
Abstract - Microwave (MW) drying is a rapid dehydration technique that can be applied to specific foods. Increasing concerns over product quality and production costs have motivated the researchers to investigate and the industry to adopt microwave drying technology. The advantages of microwave drying include the following: shorter drying time, improved product quality, and flexibility in producing a wide variety of dried products. Drying is influenced by heat and mass transfer between drying airflow and product, as well as the complex moisture transport processes which take place in the product.. This paper presents an analytical approach for the drying of potato. The laws of moisture content change in the food product as a function of mass transfer are used for the theoretical approach. The study gives a brief description of efforts made to obtain basic drying parameters under different microwave drying conditions. This computational method can be used as a tool for microwave drying of potato slabs more efficiency.
Keywords: Microwave drying; Heat and mass transfer; Factorial technique; Dincer and Dost Model.
INTRODUCTION
Drying is a complex process involving simultaneous coupled transient heat, mass and momentum transport. It is a process whereby the moisture is vaporized and swept away from the surface, sometimes in vacuum but normally by means of a carrier fluid passing through or over the moist object. This process has found industrial application various forms ranging from wood drying in the lumber industry to food drying in the food industry. In drying process, the heat may be added to the object from an external source by convection, conduction or radiation, or the heat can be generated internally within the solid body by means of electric resistance (Sahin et al., 2002). The effectiveness of a drying process depends on different factors: method of heat transfer, continuity or discontinuity of the process, direction of the heating fluids with respect
to the product (pressure atmospheric, low, deep vacuum).Drying process can be performed by using different kinds of equipment such as: air cabinet, belt drier, tunnel drier, fluidized bed, spray drier, drum dryer, foam drier, freeze-drier, microwave oven (Severini et al., 2005).
492 A. K. Haghi and N. Amanifard is converted into heat. Another advantage of
microwave application for drying is the internal heat generation. In microwave processing the energy is transferred directly to the sample producing a volumetric heating (Oliveira et al., 2002).
There have bean several experimental and theoretical studies on the analysis of heat and moisture transfer during drying of food products and on the determination of mass transfer characteristics such as moisture diffusion and mass transfer coefficient, undertaken by several researchers and engineers (Cohen et al., 1995; Ruiz Dıaz et al. 2003; Karathanos et al. 1999; Zogzas et al. 1996; and Krokida et al. 2001). The objective of any drying process is to produce a dried product of desired quality at minimum cost and maximum throughput possible (Dincer, 1998; Kechaou et al., 2000; and Khraisheh, 1995). Microwave drying could be rapid, more uniform and energy efficient compared to conventional hot air drying (Haghi, 2001; Haghi, 2001; and Haghi, 2005).
Krokida et al. (2001) investigated the effects of different drying methods on the colour of the obtained products. They found that colour characteristics are significantly affected by the drying methods. Zogzas et al. (1996) presented a review of reported experimental moisture diffusivity data in food materials.
Dincer and Dost (1995; 1996) developed new analytical models in a simple and accurate manner to determine the mass transfer characteristics for the geometrically shaped products. They also introduced new drying parameters in terms of drying coefficient and lag factors. Sahin et al. (2002) presented a simple model of moisture transfer for multi-dimensional products. By considering the analogy between the heat diffusion and moisture transfer, drying time for infinite slab products was formulated. The analysis then extended to multidimensional products through the geometric shape factors introduced.
Sharma et al. (2004) determined the effective moisture diffusivity of garlic cloves during a microwave-convective drying process. They also investigate its dependence on factors such as microwave power, air temperature and air velocity that essentially influences drying rates.
McMinn et al. (2003) determined the mass transfer characteristics for potato slab and cylinders subjected to convection, microwave and microwave-convective drying by adopting the analytical model proposed by Dincer and Dost. They have shown that the model is an effective means by which to calculate the mass transfer characteristics, also the result show that the power of the microwave has the
main effect in drying.
In the present work, experimental data from a microwave drying system are used to determine the mass transfer characteristics for slab potato samples by adopting the analytical model developed by Dincer and Dost. Also a prediction model was presented by using factorial technique method for investigate the effect of microwave power and sample’s dimensions on the drying characteristics. The model was applied successfully in the case of potato. The result shown the microwave power has the main effect and increase the dimensions of sample increase the drying time.
EXPERIMENTAL
Experimental Setup
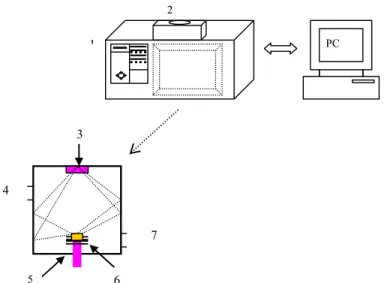
The drying system used in this work was a microwave oven (Butan, model no. MF 45) of variable power output settings and rated capacity of 900 W at 2.45 GHz, outside dimensions (WxDxH), 601x465x338 mm and cavity dimensions (WxDxH), 419x428x245 mm. a schematic diagram microwave dryer is shown in Fig 1.
Material
Trials were performed on potato tubers (It should be noted that composition of potato tubers depends upon generic and climatic factors (Khraisheh et al.; 1995). This may lead to some variations in the moisture content of potatoes within and between varieties. All potato tubers were washed in lukewarm water, hand-peeled and cut into required dimensions.
Drying Procedure
In all experiments, the microwave oven was brought to the operating temperature by heating 1000 ml of distilled water in a glass beaker for 5 min before the first run of the day .The potato samples was placed on Petri dishes in the center of the microwave oven cavity. Throughout the experimental run the sample weights were continuously recorded at predetermined time intervals until no discernible difference between subsequent readings was observed. The moisture content value was determined as:
t d d
M=(W −W ) / W (1)
Analysis of Heat and Mass Transfer During Microwave Drying of Food Products 493
2
1 PC
3
7 4
5 6
1. Microwave oven 2. Balance
3. Microwave energy output 4. Air inlet
5. Rotating table 6. Sample-Product 7. Air outlet
Figure 1: A schematic diagram of microwave drying equipment
ANALYSIS OF HEAT AND MOISTURE TRANSFER
A complete drying profile consists of two stages: a constant-rate period and a falling-rate period (19). It is frequently agreed that the mechanism of moisture movement within a hygroscopic solid during the falling-rate period could be represented by diffusion phenomenon according to Fick’s second low. The governing Fickian equation is exactly in the form of the Fourier equation of heat transfer, in which temperature and thermal diffusivity are replaced with concentration and moisture diffusivity, respectively. Therefore, similar to the case of unsteady heat transfer, one can consider three different situations for the unsteady moisture diffusion, namely, the cases where the Biot number has the following values:Bi≤0.1, 0.1 Bi 100< < , and Bi 100> . The first case, corresponding to situations where Bi≤0.1, imply negligible internal resistance to the moisture diffusivity within the solid object. On the other hand, cases where Bi 100> , including negligible surface resistance to the moisture transfer at the solid object, are the most common situation, while cases where 0.1 Bi 100< < , including the finite internal and surface resistances to the moisture transfer, exist in practical applications.
The time-dependent heat and moisture transfer equations in Cartesian, cylindrical, and spherical coordinates for an infinite slab, infinite cylinder, and a sphere, respectively, can be written in the
following compact form (Sahin et al., 2002):
m m
1 T 1 T
y
y y t
y
∂ ∂ = ∂
∂ ∂ α ∂
(2)
for heat transfer and
m m
1 M 1 M
y
y y D t
y
∂ ∂ = ∂
∂ ∂ ∂
(3)
for moisture transfer,
where m=0, 1, and 2 for an infinite slab, infinite cylinder, and a sphere. y=z for an infinite slab, y=r for infinite cylinder and sphere. T represents temperature (°C), M is moisture content by weight as dry basis (kg/kg),
α
is thermal diffusivity (m2/s), D is moisture diffusivity (m2/s), and t is time (s).The dimensionless temperature (θ) and dimensionless moisture content (φ) can be defined as follows:
(
T T / Ti)
(
a Ti)
θ = − − (4)
(
M Me) (
/ Mi Me)
φ = − − (5)
494 A. K. Haghi and N. Amanifard
Modeling Drying Process of Infinite Solid Slab Oroducts
Using the dimensionless moisture content (φ), the unsteady state diffusion of moisture in a food system by Fick’s second low for an infinite slab can be expressed as:
1
( )
t z D z
∂φ= ∂ ∂φ
∂ ∂ ∂ (6)
In order to simplify and solve this partial differential equation, the following hypotheses are made:
(i) The initial moisture content is uniform throughout the solid.
(ii) The shape of the solid remains constant and shrinkage is negligible.
(iii)The effect of heat transfer on mass transfer is negligible
(iv) Mass transfer is by diffusion only.
(v) The moisture diffusion occurs in the z direction (perpendicular to the slab surface) only
Under these assumptions, the governing one-dimensional moisture diffusion equation, Eq (6), can be written as:
2 2 D
t z
∂ φ ∂φ= ∂
∂ (7)
The following initial and boundary conditions are considered
(z, 0) 1
φ = (8)
(∂φ(0, t) / z)∂ =0 (9)
m
D( (Y, t) / z) h (Y, t) for 1 Bi 100
(Y, t) 0 for Bi 100
− ∂φ ∂ = φ ≤ ≤
φ = > (10)
where Y is half thickness of slab and the Biot number is Bi=hmY/D.
Dincer and Dost Model
Dincer and Dost developed a compact form of the equations for one-dimensional transient moisture diffusion in an infinite slab. By applying the appropriate initial and boundary conditions, the governing equations were solved and further simplified to give the dimensionless moisture content at any point of the product in the following form (McMinn et al., 2003):
n n n 1
A B
∞
=
φ =
∑
(11)The above solution Eq. (11) can be simplified if the values of (µ12Fo)>1.2 are negligibly small. Thus, the infinite sum in Eq.(11) is well approximated by the first term only.
1 1 A B
φ ≅ (12)
Where A and 1 B are given by 1
(
) (
)
1
A =exp 0.2533Bi / 1.3 Bi+ (13)
(
2)
1 1 0
B =exp −µ F for Bi > 0.1. (14)
Where Fourier number is defined asF0=Dt / Y2, Biot number isBi=h Y / Dm , and Y is the characteristic dimension (half-thickness for slab).
Due to the fact that drying has an exponentially decreasing trend, the analysis assumed an exponential form for the dimensionless moisture distribution by introducing a lag factor ( G , dimensionless) and drying coefficient ( k , 1/s):
( )
G exp ktφ = − (15)
Drying coefficient shows the drying capability of an object or product per unit time and lag factor is an indication of internal resistance of an object to the heat and/or moisture transfer during drying. These parameters are useful in evaluating and representing a drying process. Both Eqs. (12) and (15) are in the same form and can be equated to each other and present a model for the moisture diffusivity:
2 2 1 kY D=
µ (16)
The coefficient µ1 for each object was determined by evaluating the root of the corresponding characteristic equation. For the purpose of practical drying applications, simplified expressions for the roots of the characteristic equations (µ1) were developed as:
1
1 tan (0.640443Bi− 0.380397)
µ = + (17)
Analysis of Heat and Mass Transfer During Microwave Drying of Food Products 495
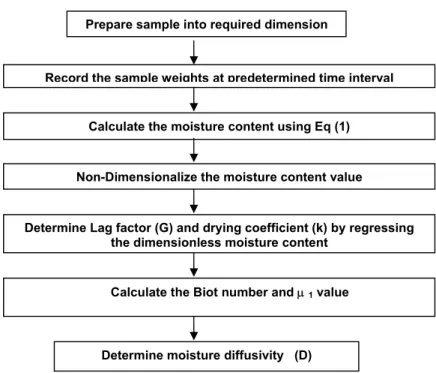
Figure 2: Procedure used in calculating the drying process parameters
Factorial Technique Method
a) Selection of the Useful Limits of the Drying Parameters
The two levels selected for each of the three variables are shown in Table 1. For the convenience of recording and processing the experimental data, the upper and lower levels of the variables were coded as +1 and -1, respectively and the coded values of any intermediate levels were calculated by using the expression:
max min i
max min
X X
X
2 X
X X
2
+
−
=
−
(18)
Where Xi is required coded value of a variable, X is any value of the variable from Xmin to Xmax, Xmin is the lower level of the variable and Xmax is the upper level of the variable.
b) Developing the Design Matrix
Table 2 shows the 8 sets of coded conditions used to form the design matrix of 23 factorial design.
Some features of this Table are: (a) Trials indicate the sequence number of run under consideration, (b) X0 represents the mean parameter of the experiment, (c) X1, X2 and X3 represent the notation used for controlled variables in the order of microwave power, sample diameter and sample thickness, respectively, and (d) the signs +1 and -1 as mentioned before refer to the upper and lower levels of that parameter under which they are recorded.
c) Development of a Mathematical Model
A mathematical function, f, was assumed to describe the relationship between drying constant k and the independent variables, such as, k=f(P,D,T). According to experimental data which are shown graphically, the drying constant was assumed to vary linearly with each independent variable in the related interval. Hence, a first-order polynomial with interactions can be considered as the model, namely,
k = b0 + b1P + b2D + b3T + b4PD +
(19) b5PT + b6DT + b7PDT
where k is the drying constant. Non-Dimensionalize the moisture content value
Determine Lag factor (G) and drying coefficient (k) by regressing the dimensionless moisture content
Calculate the Biot number and µ 1 value
Determine moisture diffusivity (D)
Record the sample weights at predetermined time interval
496 A. K. Haghi and N. Amanifard
Table 1: Controlling parameters
Level Coding
Parameter Notation Unit Low High Low High
Microwave power P W 90 450 -1 +1
Sample diameter D mm 30 40 -1 +1
Sample thickness T mm 3 10 -1 +1
Table 2: Design matrix
Trial Number P D T X0 X1 X2 X3
1 +1 -1 -1 -1
2 +1 +1 -1 -1
3 +1 -1 +1 -1
4 +1 +1 +1 -1
5 +1 -1 -1 +1
6 +1 +1 -1 +1
7 +1 -1 +1 +1
8 +1 +1 +1 +1
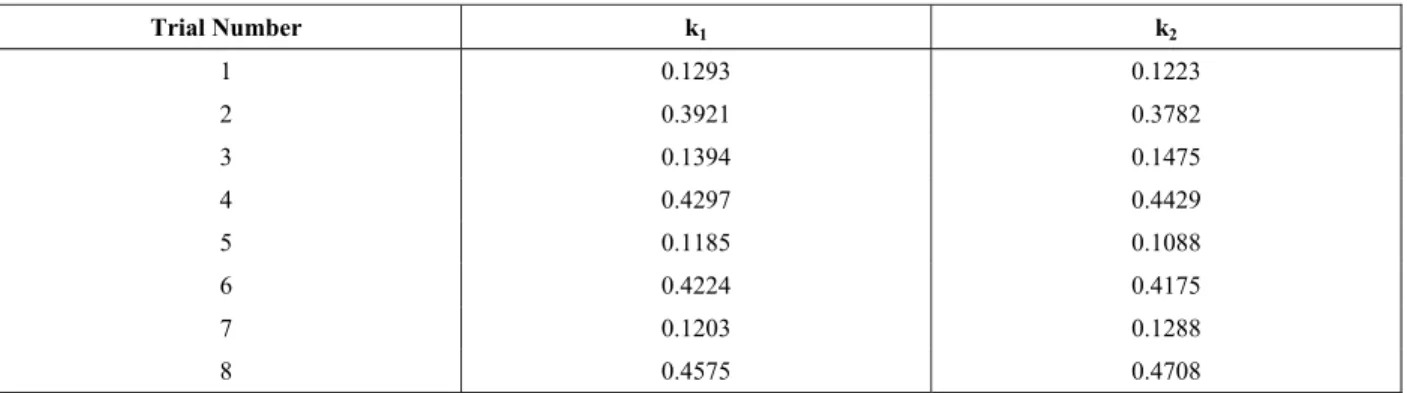
Table 3: Drying constants for potato samples as per design matrix
Trial Number k1 k2
1 0.1293 0.1223
2 0.3921 0.3782
3 0.1394 0.1475
4 0.4297 0.4429
5 0.1185 0.1088
6 0.4224 0.4175
7 0.1203 0.1288
8 0.4575 0.4708
The main and interaction effects (ej) and coefficients (bj) were determined by using the formula,
N ij i i 1
j j
2 X k
e 2b
N
=
= =
∑
(20)Where Xij is the value of factor or interaction in the coded form, ki is drying constant and N is the total number of observations.
d) Checking Adequacy of the Model
The analysis of variance (ANOVA) technique was used to check the adequacy of the developed
model. As per this technique, (a) The F-ratio of the developed model is calculated and is compared with the standard tabulated value of F-ratio for a specific level of confidence, (b) If the calculated value of F-ratio does not exceed the tabulated value, then with the corresponding confidence probability the model may be considered to be adequate. For this purpose the F-ratio of the model is defined as the ratio of variance of adequacy, also known as residual
variance (usually denoted as S ) to the variance of 2ad reproducibility, also known as variance of optimization parameter (usually denoted as S ). 2y
Analysis of Heat and Mass Transfer During Microwave Drying of Food Products 497 2
ad mod el 2
y S F
S
= (21)
Here,
^
N 2
2 i i ad
i 1
(k k ) S
DF
=
−
=
∑
(22)Where N is the number of trials, ki is observed (or measured from experiments) response, ˆk is predicted/estimated value of the response (i.e., the one obtained from the model), DF is degrees of freedom and it is equal to [N-(K+1)] where K represents the number of independently controllable variables and
2 N _
2 iq i q 1 i 1
2 y
(k k )
S
N
= = − =
∑∑
(23)
where kiq is the value of response in a repetition, q is the number of repetition and k is the arithmetical i mean of repetitions (i.e., response in the repetitions).
To recognize the significant coefficients, the Student t-test is used. According to this test, (1) the calculated value of t corresponding to a coefficient is compared with the standard tabulated value of specific level of probability, (2) if the calculated value of t exceeds the tabulated one, then with the
corresponding confidence probability the coefficient is said to be significant. For this purpose the value of t is given by:
j bj b t
S
= (24)
Where
b
j represent the absolute value of coefficientwhose significance is being tested and Sbj the standard deviation of coefficients given by:
2 y 2
bj
S var iance of optimization S
No of trials N
= = (25)
Sbj, alternatively, called as variance of the regression coefficients, is thus seen to be same for all the coefficients. Thus, they depend only on the error of the experiments and the confidence interval.
RESULTS AND DISCUSSION
Experimental Results
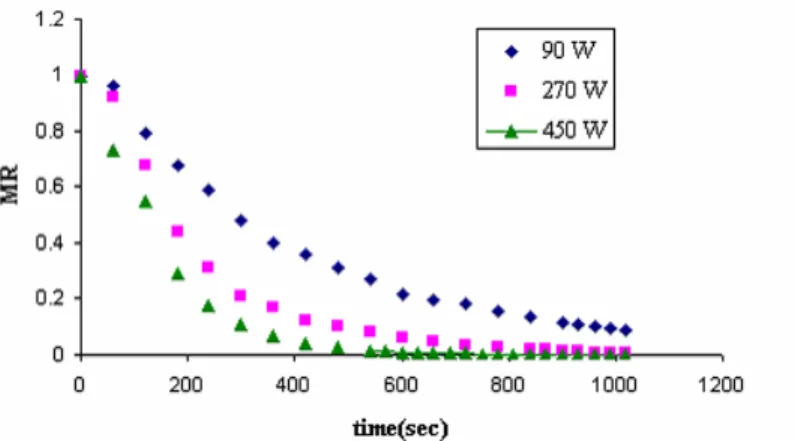
Throughout the experimental run the sample weights were continuously recorded at regular time intervals until no discernible difference between subsequent readings was observed. Then the moisture ratio of the samples was determined from Eq. (5). A typical drying curve for potato slab is shown in Fig. 3.
498 A. K. Haghi and N. Amanifard
Dincer and Dost Model
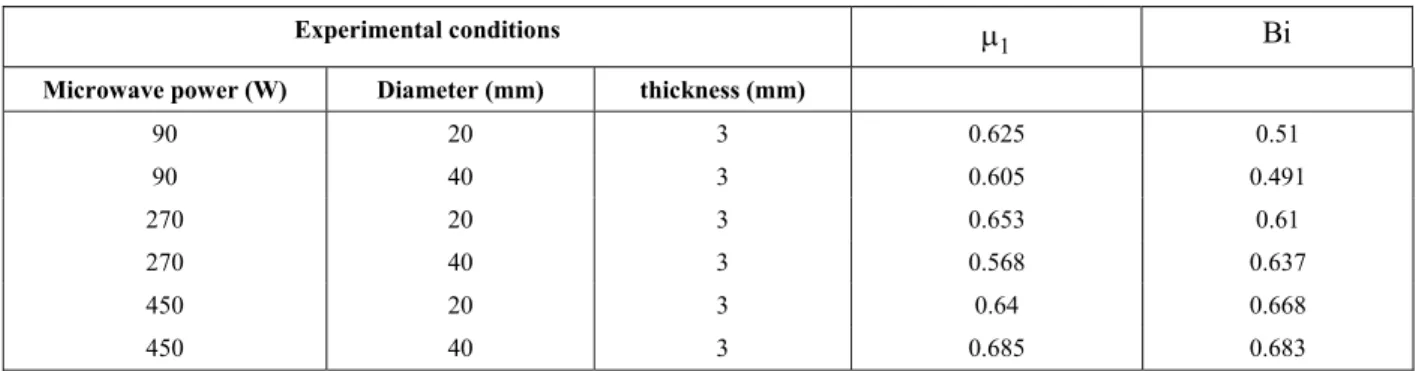
The dimensionless moisture content values (calculated by Eq. (5)) were then regressed against the drying time in the exponential form of Eq. (15) using the least square curve fitting method. Thus, the drying coefficients (k) and lag factors (G) were determined for samples as presented in Table 4. Using the calculated lag factor, the Bi number for each experimental condition was determined using Eqs. (13), as appropriate. Subsequently the associated values of µ1 were computed from the simplified expression for a slab (Esq. 17). The calculated Biot numbers and µ1 values are shown in Table 5.
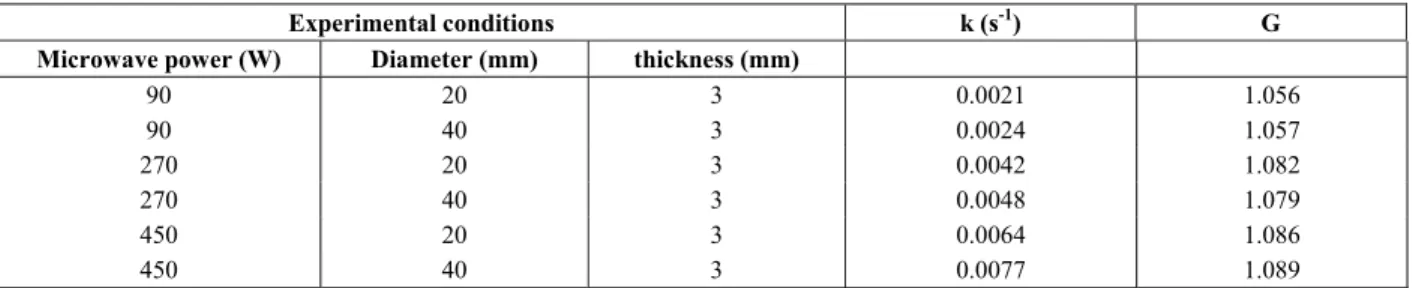
The drying coefficient (k) is a parameter which indicates the drying capability of the solid object. The effect of microwave power on the drying constant is shown Table 4. The ability of microwaves to facilitate rapid drying rates was observed in magnitude of the coefficients, which increased with increasing output power level; e.g. slab (40 mm radius) 0.0024, 0.0048 and 0.0077 s-1 for 90, 270 and 450 W respectively. As expected, during microwave drying, the variable power had the most significant effect on the drying capability.
An increase in slab diameter results an increase in the drying coefficient (Table 4). It is because of sudden and volumetric heating, generating high pressure inside the potato samples, resulted in boiling and bubbling of the samples. On the other hand, the amount of water in the sample increases, without increasing the resistance of it, and results in faster drying. At low microwave power (90 W), the drying coefficient increases slightly with increase in sample diameter. However, at higher power (450W), the drying coefficient grows at a higher rate. As mentioned before, this is because of higher water content, and hence, more absorption of microwave power, results in faster drying of samples. Using the
values of Y, k and
µ
1, the moisture diffusivity (D) was then computed from Eq. (16). The calculated diffusivity values are shown in Table (6).Factorial Technique
The final mathematical model as determined by this method is in the form of
k = 0.2766 + 0.1498 P + 0.0155 D + 0.0084 PD + 0.0117 PT
The developed model has been found to be adequate by analysis of variance technique as shown in Table 7. This model shows that the drying rate increases with increasing the microwave power or sample diameter. As mentioned the effect of microwave power is so higher than sample diameter.
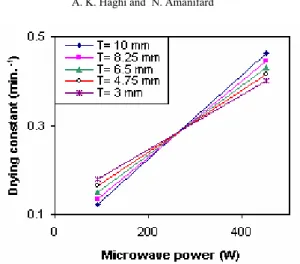
The significant interaction effects between variables are shown in Figs.4 and 5.
It is seen from Fig. 4 that at low microwave power, about 90 W, the drying constant increases only slightly with an increase in sample diameter. However, at higher microwave power, the drying constant increases at a higher rate with an increase in sample diameter. The interaction effect between microwave power and sample thickness is shown in Fig. 5. The effect of thickness at low power level on the drying coefficient is more considerable. It is observed that the drying constant increases with an increase in microwave power which is obviously expected. However, below the microwave power of 270 W the drying constants for thicker samples are numerically lower than those for thinner plates. This could possibly due to increasing internal resistance to mass transfer. However, beyond a microwave power of 270 W, the trend is reversed. This is because that in high level, the effect of microwave power is more than the effect of increasing internal resistance to mass transfer.
Table 4: Drying coefficient and lag factor values for microwave drying of potato slabs
Experimental conditions k (s-1) G Microwave power (W) Diameter (mm) thickness (mm)
90 20 3 0.0021 1.056
90 40 3 0.0024 1.057
270 20 3 0.0042 1.082
270 40 3 0.0048 1.079
450 20 3 0.0064 1.086
Analysis of Heat and Mass Transfer During Microwave Drying of Food Products 499
Table 5: Mass transfer characteristics for microwave drying of potato slabs
Experimental conditions
1
µ Bi
Microwave power (W) Diameter (mm) thickness (mm)
90 20 3 0.625 0.51
90 40 3 0.605 0.491
270 20 3 0.653 0.61
270 40 3 0.568 0.637
450 20 3 0.64 0.668
450 40 3 0.685 0.683
Table 6: Moisture diffusivity values for microwave drying of potato slabs
Experimental conditions D×10-8 (m2s-1) Microwave power (W) Diameter (mm) thickness (mm)
90 20 3 1.25
90 40 3 1.46
270 20 3 2.24
270 40 3 2.62
450 20 3 3.23
450 40 3 3.76
Table 7: Analysis of variance (ANOVA)
Parameter Degree of Freedon
Variance of Optimization
Parameter
Standard Deviation of Coefficients,
Variance of Adequacy
‘F’-ratio (Model)
‘F’-ratio from Tables at (4,8,0.05)
Model whether Adequate
2 y
S 2
ad
S S2y Sbj Sad2 Fm Ft Fm < Ft
k 8 4 5.31e-5 0.0026 5.31e-5 1 3.84 yes
500 A. K. Haghi and N. Amanifard
Figure 5: Effect of parameter interaction between P and T (at D= 40 mm).
CONCLUSION
Based on the results of this study, the following conclusions were drawn.
1) Drying took place mainly in the falling rate period followed by a constant rate period after a short heating period.
2) The drying rate increases with increasing the microwave power or sample diameter.
3) An increase in slab diameter results an increase in the drying coefficient It is because of sudden and volumetric heating, generating high pressure inside the potato samples, resulted in boiling and bubbling of the samples.
4) At low microwave power (90 W), the drying coefficient increases slightly with increase in sample diameter.
5) The variable power had most significant effect on the drying capability.
6) Drying constant increases with an increase in microwave power which is obviously expected. 7) Below the microwave power of 270 W the drying constants for thicker samples are numerically lower than those for thinner plates. This could possibly due to increasing internal resistance to mass transfer. However, beyond a microwave power of 270 W, the trend is reversed. This is because that in high level, the effect of microwave power is more than the effect of increasing internal resistance to mass transfer.
8) In order to maximize the benefits of microwave drying, further studies are required at lower power outputs with different microwave power cycles.
9) In further studies, more comprehensive experimental application of the method should be
considered to attain a better understanding drying process of potato slabs as a function of time. Moreover, the influence of various sizes of potato slabs can be studied using this approach.
NOMENCLATURE
Bi Biot Number
D Diameter
Fo Fourier Number M Moisture content N total number of observations S Degree of freedom T temperature t Time
Wd weight of dried sample Wt Weight of sample
X Any sample variable
y Dimensional coordinate Z Z-coordinate
Greek Symbols
α Thermal coefficient
θ Dimensionless Temperature
φ
Dimensionless Moisturecontent
Subscripts
Analysis of Heat and Mass Transfer During Microwave Drying of Food Products 501
REFERENCES
Cui Z. W., Xu S. Y. and Sun D. W., Microwave– vacuum drying kinetics of carrot slices, Journal of Food Engineering, 65, pp. 157–164 (2004). Cohen J. S. and Yang T. C. S., Progress in food
dehydration, Trends in Food Science and Technology, 6, pp. 20–25 (1995).
Dincer I., Moisture transfer analysis during drying of slab woods, International Journal of Heat and Mass Transfer, 34, pp. 317–320 (1998).
Dincer I., Dost S., An analytical model for moisture diffusion in solid objects during drying, Drying Technol., 13 (1/2), pp. 425–435 (1995).
Dincer I., Dost S., A modeling study for moisture diffusivities and moisture transfer coefficients in drying of solid objects, Int. J. Energy Res., 20 (6), pp. 531–539 (1996).
Haghi A. K., A mathematical model of the drying process, Acta Polytechnica 41(3), pp. 20-25 (2001).
Haghi A. K., Simultaneous moisture and heat transfer in porous media, Journal of computational and applied mechanics, 2(2), pp. 195-204 (2001). Haghi A. K., Application of microwave techniques
in textile chemistry, Asian J. of Chem, 17(20), pp. 639-654 (2005).
Karathanos V. T., Belessiotis V. G., Application of a thin layer equation to drying data fresh and semi-dried fruits, Journal of Agricultural Engineering Research, 74, pp. 355–361 (1999).
Kechaou N. and Maalej M., A simplified model for determination of moisture diffusivity of date from experimental drying curve, Drying Technology, 18, pp. 1109–1125 (2000).
Khraisheh M. A. M., Cooper T. J. R., Magee T. R. A., Investigation and modeling of combined microwave and air drying, Food and Bioproducts Processing, 73, pp. 121-126 (1995).
Krokida M. K., Zogzas N. P., Maroulis Z. B., Mass
transfer coefficient in food processing: Compilation of literature data, International Journal Food Properties, 4, pp. 373–382 (2001). Krokida M. K., Maroulis Z. B., Saravacos, G. D.,
The effect of the method of drying on the colour of dehydrated products, International Journal of Food Science and Technology, 36(1), pp. 53–59 (2001).
McMinn W. A. M., Khraisheh M. A. M., Magee T. R. A., Modeling the mass transfer during convective, microwave and combined microwave-convective drying of solid slabs and cylinders, Food Research International, 36, pp. 977-983 (2003).
Oliveira M. E. C. and Franca A. S., Microwave heating of foodstuff, Journal of Food Engineering, 53, pp. 347–359 (2002).
Ruiz Dıaz G., Martınez-Monzo J., Fito P., Chiralt A., Modeling of dehydration rehydration of orange slices in combined microwave air drying, Innovative Food Science and Emerging Technologies, 4, pp. 203–209 (2003).
Sahin A. Z., Dincer I., Yilbas, B. S. and Hussain M. M., Determination of drying times for regular multi-dimensional objects, International Journal of Heat and Mass Transfer, 45, pp. 1757–1766 (2002).
Severini C., Baiano A., Pilli T. De, Carbone B. F. and Derossi A., Combined treatments of blanching and dehydration: study on potato cubes, Journal of Food Engineering 68(3), pp. 289–296 (2005).
Sharma G. P., Prasad S., Effective moisture diffusivity of garlic cloves undergoing microwave-convective drying, Journal of Food Engineering, 65, pp. 609–617 (2004).