TECHNICAL NOTES
Effect of Tank Size and Geometry on the Flow Induced by
Circular Bubble Plumes and Water Jets
Iran E. Lima Neto
1; David Z. Zhu, M.ASCE
2; and Nallamuthu Rajaratnam, F.ASCE
3Abstract:Ambient flow field and circulation patterns induced by circular bubble plumes and water jets in tanks of different sizes were studied in rectangular and square water tanks. A nonstationary nature of the flow was observed in all experiments and its dominant oscillation frequency was found to directly relate to the tank size. The flow circulation patterns were similar for bubble plumes and water jets, but changed significantly with tank size and geometry. Strong three-dimensional effects were observed in a rectangular tank, resulting in flow entraining in the longer plane and flow detraining in the shorter plane, especially for the bubble plume tests. A relationship was developed to relate the tank size to the patterns of circulation cells. Nearly isotropic turbulent flow conditions were obtained in all experiments, but the effect of tank size and geometry on the magnitude of the turbulent stresses was more pronounced in the bubble plume tests.
DOI:10.1061/共ASCE兲0733-9429共2008兲134:6共833兲
CE Database subject headings:Bubbles; Water circulation; Water tanks; Water jets; Mixing; Plumes; Geometry; Turbulent flow.
Introduction
Bubble plumes and water jets are widely used to promote circu-lation and turbulent mixing in aeration tanks, mixing chambers, reservoirs, lakes, and other water bodies 共Abramovich 1963; Rajaratnam 1976; Socolofsky 2001; Soga and Rehmann 2004兲. While bubble plumes entrain the surrounding liquid mainly due to buoyancy, water jets induce the entrainment mainly due to mo-mentum. Earlier studies have mostly focused on the dynamics of jets and plumes. Only a few studies examined the effects of the tank sizes and geometry on the ambient flows and circulations patterns 共Iamandi and Rouse 1969; Jirka and Harleman 1979; Fanneløp et al. 1991; Riess and Fanneløp 1998兲.
Iamandi and Rouse共1969兲studied plane air jets in tanks with different lengths and found that a primary circulation flow cell was formed when this length was up to about two times the height of the tank. However, a secondary cell with opposite rotation of the primary cell was also formed when the length of the tank was
four times its height. In this particular case, the length of the primary cell was about 2.5 times the height of the tank. Jirka and Harleman共1979兲investigated buoyant plane water jets with dif-ferent lengths and water depths and found that circulation cells were formed when the discharge was unstable. But, in contrast with the above-mentioned nonbuoyant case, no secondary cell was formed even when the length of the tank was about 20 times the water depth. Fanneløp et al.共1991兲and Riess and Fanneløp 共1998兲studied plane water jets and line-source bubble plumes and observed the formation of secondary cells in water tanks with a length of about 20 times the water depth. Nevertheless, the length of the primary cell was about seven times the water depth, which is much larger than that reported by Iamandi and Rouse共1969兲. In all the above studies, line jets and plumes were used across the channel width; thus, the flows were made two-dimensional 共2D兲 without three-dimensional共3D兲effects.
The flow field induced by bubble plumes in confined setups such as bubble column reactors has also been investigated. Ex-perimental studies have shown that the number of vertical circu-lation cells generated in these setups is close to the ratio of column height to diameter or width共see the summary in Mudde 2005兲. However, no general description of the effect of tank size and geometry, ranging from confined setups to larger scale tanks, has been provided.
In both confined and unconfined bubble plume setups, a peri-odic lateral oscillation of the bubble core共also called wandering motion兲is usually reported共Rensen and Roig 2001; García and García 2006兲. Rensen and Roig 共2001兲 studied the wandering motion in a confined bubble column and obtained oscillation fre-quencies ranging from about 0.1 to 0.2 Hz, increasing with the air flow rate following approximately a power law with a slope of about 0.50. García and García共2006兲, on the other hand, studied the wandering motion in a large wastewater treatment tank and obtained much smaller oscillation frequencies 共ranging from about 0.002 to 0.003 Hz兲. They noticed that the frequencies in-1
Ph.D. Candidate, Dept. of Civil and Environmental Engineering, Univ. of Alberta, Edmonton AB, Canada T6G 2W2. E-mail: limaneto@ ualberta.ca
2
Professor, Dept. of Civil and Environmental Engineering, Univ. of Alberta, Edmonton AB, Canada T6G 2W2 共corresponding author兲. E-mail: [email protected]
3
Professor Emeritus, Dept. of Civil and Environmental Engineering, Univ. of Alberta, Edmonton AB, Canada T6G 2W2. E-mail: [email protected]
Note. Discussion open until November 1, 2008. Separate discussions must be submitted for individual papers. To extend the closing date by one month, a written request must be filed with the ASCE Managing Editor. The manuscript for this technical note was submitted for review and possible publication on February 15, 2007; approved on June 26, 2007. This technical note is part of theJournal of Hydraulic Engineer-ing, Vol. 134, No. 6, June 1, 2008. ©ASCE, ISSN 0733-9429/2008/6-833–842/$25.00.
creased with the air flow rate following approximately a power law with a slope of about 0.30. This implies that the wandering frequency depends on both tank size and air flow rate, but no general correlation including both small and large scale tanks has been provided. Besides, there remain debates on the mechanism that cause this oscillatory flow, either attributing it to buoyancy-driven instabilities enhanced by the presence of the walls and/or the presence of coherent flow structures. Therefore, measure-ments of the mean, turbulent, and periodic flows induced by bubble plumes and water jets for different tank geometries are necessary to improve knowledge of such flows and to validate computational fluid dynamic codes using advanced techniques such as large-eddy simulation共see Bombardelli 2004兲.
In the present study we investigate experimentally the effect of tank size and geometry, including rectangular and square setups, on the mean, turbulent, and periodic flow fields induced by circu-lar bubble plumes and water jets. We analyzed our results and combined them with those available in the literature to provide a better understanding of such flows.
Experimental Setup and Procedure
The experiments were performed using three different setups: a rectangular tank, a square tank, and a smaller square tank共here called a confined setup兲, shown schematically in Fig. 1. The rect-angular setup consisted of a glass-walled tank, 1.20 m wide, 1.80 m long, and 0.80 m deep. The square setup was built by placing two plexiglass sheets inside the rectangular tank to form a
1.20-m square tank. The confined setup was obtained by placing a plexiglass box of a 0.40-m side at the center of the tank in order to reach similar conditions as bubble columns. The water depth was fixed at 0.76 m for all setups. The gas supply was taken from an air line, while the water was pumped from a small reservoir. Both air and water temperatures were about 20° C. Volumetric flow rates of 33.3 and 50.0 cm3/s were adjusted by rotameters for both the air and water phases共a total of four experiments for one tank geometry兲and discharged through single-orifice nozzles con-nected to the air and water lines by a PVC pipe with an inner diameter of 25.4 mm. A pressure-regulating valve was used to keep the air pressure at 1 ATM to ensure a constant air flow rate to the nozzle during the bubble plume tests. The diameter of the nozzles,do, used in the air and water injection tests were 1.5 and
3.0 mm, respectively. The nozzles were placed at the center of the tank and their exit was 45 mm above the bottom. The experiments with water injection were limited to the square and rectangular setups to minimize the effect of increase in the water level, which was less than 1% over the duration of the experiments in both cases. These flow rates and nozzle diameters were chosen in order to provide similar velocity scales of the entrained liquid jet for the air and water injection tests. Table 1 shows a summary of the experimental conditions, the Reynolds number being defined as R=Uodo/, whereUoand= velocity at the nozzle exit and
kine-matic viscosity for each phase共air or water兲, respectively. Typical images of the bubble plumes and water jets are shown in Fig. 2. A spreading rate of about 20% of the height is observed by injecting dye close to the nozzle exit共for bubble plumes兲and at the water supply pipeline共for water jets兲. In the bubble plume
Table 1.Details of Experimental Conditions, Showing Centerline Velocities Measured with the Propeller Anemometer at 40 cm above the Nozzle Exit for the Square and Rectangular Setups
Condition
Square
共1.2 m⫻1.2 m兲
Rectangular
共1.2 m⫻1.8 m兲
Confined
共0.4 m⫻0.4 m兲 Air and water flow injection rates
Bubble plume共do= 1.5 mm兲 ⫻ ⫻ ⫻ Qo= 33.3 cm3/s,Uo= 18.9 m/s,R=1,885,Uc,40 cm= 24 cm/s
Qo= 50.0 cm3/s,Uo= 28.3 m/s,R=2,831,Uc,40 cm= 32 cm/s Water jet共do= 3.0 mm兲 ⫻ ⫻ Qo= 33.3 cm3/s,Uo= 4.7 m/s,R=14,140,Uc,40 cm= 20 cm/s
Qo= 50.0 cm3/s,Uo= 7.1 m/s,R=21,231,Uc,40 cm= 29 cm/s Note: Water depth was fixed at 0.76 m in all experiments.
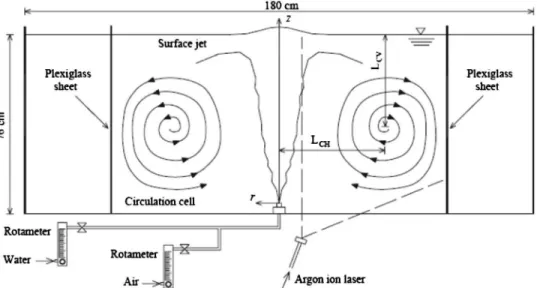
Fig. 1.Schematic of experimental apparatus, indicating circulation flow cells at the longer side of the rectangular tank with two plexiglass sheets 共for the square setup兲. Note that the confined setup共not shown in the figure兲was obtained by placing a plexiglass box at the center of the tank.
tests, the ratio of the bubble core to the entrained liquid jet diam-eter was about 0.6, which was within the typical range of 0.5–0.9 reported by Socolofsky共2001兲. Therefore, the bubble core had a spreading rate of about 12%. An electromagnetic propeller anemometer 共Omni Instruments, MiniWater20兲 with an internal diameter of 22 mm was used to measure mean vertical water velocity inside the bubble plumes and water jets in the square and rectangular setups. The measured velocities at the centerline
water jet at different distances above the nozzle were about 10% smaller than those obtained by using the classical theory of free jets 共see Rajaratnam 1976兲. This 10% difference was probably due to the accuracy of the propeller anemometer, as well as the assumption of the jet behaving like an ideal jet. Table 1 shows that although the velocity at the nozzle exit, Uo, for bubble
plumes was higher than that for water jets, the centerline water velocity measured with the propeller anemometer at 0.40 m above the nozzle exit,Uc,40 cm, was of the same order. The small Reynolds number in the bubble plume tests also ensured that the flow was dominated by buoyancy forces. The bubble plumes con-tained bubbles of mean volume equivalent-sphere diameters of about 8 mm, which were measured across the bubble core at 0.40 m above the nozzle exit using an optical probe system de-scribed by Lima Neto et al. 共2008兲. Visual observation of the bubble plumes and the entrained fluid共from dye injection tests兲in the square and rectangular setups revealed a low-frequency oscil-lation of the core 共wandering motion兲, which was smaller than that observed in the confined setup. This wandering frequency also appeared to increase with air flow rate. The water jets, how-ever, did not present significant wandering motions.
The flow field surrounding the bubble plumes and water jets was measured using particle image velocimetry 共PIV兲. Silver-coated glass particles with a density of 1.65 g/cm3 and a mean diameter of 15m were homogenously distributed into the water. A continuous 6 W argon ion laser operating at 488 nm共Stabilite 2017, Spectra-Physics Lasers兲and optics共OZ optics兲were used to generate a light sheet to illuminate the flow共see Fig. 1兲. Be-cause strong 3D effects were observed in the rectangular setup for both bubble plumes and water jets, measurements were taken both in the longer and shorter planes of the tank. A high-resolution charge-coupled device 共CCD兲 camera 共1392 ⫻1040 pixels兲共TM-1040, Pulnix America, Inc.兲controlled by a computer frame grabber system 共Streams 5, IO Industries, Inc.兲 captured 10-bit images of the particles with a resolution of
Fig. 2.Typical images obtained using background illumination and dye injection: 共a兲 bubble plumes; 共b兲 water jets 共Qo= 33.3 cm3/s兲.
Dashed line indicates a 20% spreading with height.
Fig. 3.Instantaneous horizontal velocity 共u兲 measured at r= 15 cm andz= 40 cm 共Qo= 33.3 cm3/s兲, periodic component共u⬙兲, and turbulent
component共u⬘兲, for the flow induced by共a兲bubble plumes in the square and confined setups;共b兲water jets in the square and rectangular共in the longer plane兲setups
18 pixel/cm, frame rate of 30 fps, and exposure time of 1/60 s for all setups. The displacements between subsequent images were computed using a standard cross-correlation PIV algorithm 共Heurisko, version 4.0.8, Aeon Verlag and Studio兲with an inter-rogation window size of 32⫻32 pixels and 50% overlap between adjacent windows. In the confined setup, because of the wander-ing motion and the proximity of the PIV field of view to the bubble core centerline 共7 cm兲, a few bubbles could be periodi-cally observed 共closer to the water surface兲, but this effect was considered negligible as the PIV code corrected the velocity vec-tors using a threshold technique. This problem was much less pronounced in the square and rectangular setups, where the fre-quency of the wandering was lower and the PIV field of view was located farther away from the bubble core centerline共10 cm兲.
The bubble plume experiments were performed for 2 and 5 min in duration, which resulted in similar flow patterns. This is consistent with preliminary bubble plume tests in the square setup conducted by Lima Neto et al.共2008兲with sampling times
rang-ing from 5 to 30 min, which resulted in measurements of average air-phase properties共void fraction, bubble velocity, and diameter兲 within only about a 10% difference. We decided not to exceed the 2 min duration in the water jet tests in order to minimize the effect of increasing water level in the tank.
Results and Discussions
Typical horizontal velocity components, u, obtained from PIV measurements of the flow near the bubble plumes and water jets, and power spectrums of these velocities,Gu, are shown in Figs. 3
and 4, respectively. In Fig. 4, a line with a slope of −5/3 is also shown to indicate the presence of Kolmogorov’s inertial sub-range. A dominant frequency, f, of about 0.03 Hz was obtained for the velocity signals near the core of both the bubble plumes and water jets in the square and rectangular setups. The same frequency was obtained for different sampling times 共2 and 5 min兲 and from optical probe measurements of void fraction 共5 min duration兲at the bubble core centerline in the square setup. Thus, the dominant frequency in the spectrum of bubble plumes will be considered here as a wandering frequency, as suggested by Rensen and Roig共2001兲. A dominant frequency of about 0.11 Hz was obtained for the velocity signals near the bubble core in the confined setup and it was also considered as a wandering fre-quency for this particular case. This is consistent with the higher wandering frequency observed visually in the confined setup. Note that these frequencies were obtained for the flow rate of 33.3 cm3/s. For the higher flow rate used in this study 共50.0 cm3/s兲, these frequencies were higher, i.e., about 0.04 for the square/rectangular setups and 0.12 Hz for the confined setup. This supports the idea that these dominant frequencies corre-sponded to the wandering frequencies of the bubble plumes, which increased with air flow rate but decreased with tank size. It is important to mention, however, that estimation of the 95% confidence intervals in the power spectra shown in Fig. 4 resulted in deviations of the peak frequency by up to about 33%. In this case, the peak frequencies for 33.3 and 50.0 cm3/s will be as-sumed to be of the same order. Visual observation and optical
Fig. 4.Power spectra of horizontal velocity componentumeasured at r= 15 cm and z= 40 cm for the square, rectangular 共in both shorter and longer planes兲, and confined setups, indicating dominant frequencies of about 0.03 and 0.11 Hz and the presence of an inertial subrange共line with slope of −5/3兲:共a兲bubble plumes共also indicating a void fraction spectrum for the square setup measured atr= 0 cm and z= 40 cm兲;共b兲water jets共Qo= 33.3 cm3/s兲
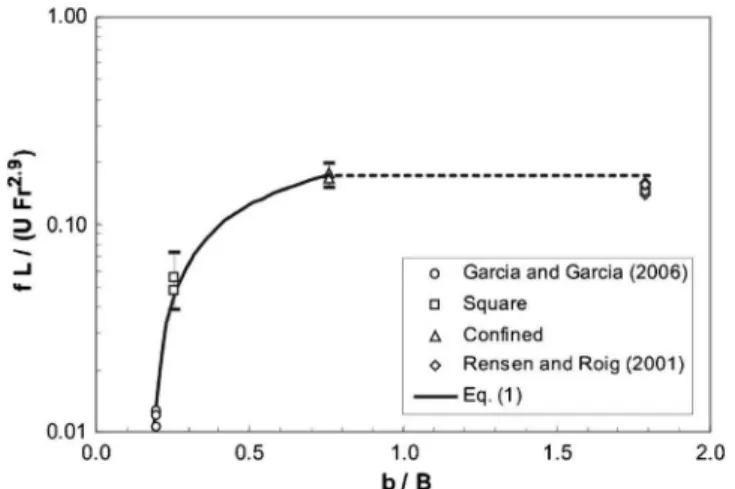
Fig. 5.Variation of the dimensionless wandering frequency with the ratio of jet radius to tank radius 共or half-width兲. Our data points correspond to the air flow ratesQoof 33.3 and 50.0 cm3/s, including the 95% confidence intervals共indicated with error bars兲. Dashed line indicates the region where the wandering frequency becomes inde-pendent ofb/B, according to the experimental results of Rensen and Roig共2001兲.
probe measurements of the bubble core oscillation also confirmed a weak influence of the air flow rate tested here on the wandering motion, as compared to that of tank size.
Because of the nonstationary nature of the flow, a digital fil-tering technique was used to separate the turbulent motions共i.e., high-frequency signals兲 and the periodic motions 共i.e., low-frequency signals兲from the original velocity signals. In order to define a cutoff frequency, we examined the coherence between the horizontal and vertical velocity components, estimated using the power spectra of these variables. Thus, a low coherence
indi-cates the random共i.e., turbulent兲motions while a high coherence indicates the well correlated共i.e., periodic兲motions. A frequency of 0.2 Hz gave a coherence lower than about 0.3 for the high-frequency signals and a coherence higher than about 0.7 for the low-frequency signals. Although some contamination between the turbulent and periodic motions is expected in the above proce-dure, the use of 0.2 Hz as a cutoff frequency fitted very well with the periodic velocity fluctuations in the instantaneous velocity time series. This is also consistent with the procedure described by García and García 共2006兲, where a cutoff frequency higher
Fig. 6.Time-averaged velocity fields surrounding the共a兲bubble plumes;共b兲water jets in the共i兲square setup,共ii兲longer, and共iii兲shorter planes of the rectangular setup共Qo= 33.3 cm3/s兲. Note that the mean vertical velocity¯is distorted共about 3.5 times smaller兲.
than the dominant wandering frequency was used to decompose the velocity signals. Hence, considering this cutoff frequency, sixth-order Butterworth high-pass filters were used to eliminate the mean velocities共¯u and¯兲 from the original velocity signals 共uand兲and separate the dominant periodic velocity fluctuations 共u⬙ and⬙兲from the turbulent velocity fluctuations 共u⬘and⬘兲, whereu=¯u+u⬘+u⬙ and=¯+⬘+⬙. Examples of this velocity decomposition are shown in Fig. 3. It is seen that bothu⬙andu⬘ in the confined setup are higher than those for the square and rectangular setups.
To examine the effect of the tank size on the dominant fre-quency共or wandering frequency兲induced by bubble plumes and to nondimensionalize the results, we introduce the ratio b/B, whereb= length scale for the jet and plume at the free surface and B= tank radius or half-width. For circular jets and plumes,b can be estimated asb= 0.2H共Rajaratnam 1976兲, whereH= travel dis-tance of the jet and plume to the water surface. To examine the effect of the air flow rate, we introduce velocity and length scales defined byU=Qo/L2andL=共Qo
2/g兲1/5, respectively, as well as a
densimetric Froude number defined by F =U/
冑
bg共w−a兲/w, in which w and a= water density and air density, respectively.Thus, combining the above parameters with curve fitting of ex-perimental data obtained here and available in the literature, a
dimensionless wandering frequency can be expressed by the fol-lowing equation:
fL U = Fr
2.9
冋
0.268 log冉
bB
冊
+ 0.205册
共1兲Fig. 5 shows that Eq.共1兲describes well共r2= 0.994兲the experi-mental data and that the dimensionless wandering frequency fL/U increases as the tank size becomes small compared to the jet radius up tob/B= 0.76, where this frequency becomes inde-pendent of tank size. This is consistent with the experimental results of Rensen and Roig 共2001兲, in which the wandering fre-quency was constant forb/Bvarying from about 0.7 to 1.8. It is interesting to note that, according to Eq. 共1兲, the wandering fre-quency also increases with the air flow rate following approxi-mately a power law with a slope of 0.38, which is within the above-mentioned values of 0.30 and 0.50 obtained from the data given by Rensen and Roig共2001兲and García and García共2006兲. The comparison shown in Fig. 5 is for bubble plume studies with different diffusers but similar range of bubble diameters: 3 mm 共obtained from Rensen and Roig 2001兲; 8 mm 共obtained from the present study兲; and 10 mm 共estimated for the coarse bubble diffuser used by García and García 2006兲. Note that these bubble diameters are within the range of 1 – 15 mm reported by Clift et al.共1978兲for ellipsoidal bubbles. Previous study by Lima Neto et al. 共2008兲 on bubble plumes generated using different nozzle types 共including single and multiple orifices of different sizes and a porous airstone兲 resulted in similar wandering fre-quencies as obtained in the present study, even though the average bubble diameters varied from 3 to 10 mm with different nozzle types. In addition, all the data presented in Fig. 5 correspond to studies with diffusers occupying a small area on the bottom of the tank, which can be assumed to be point-source diffusers. There-fore, we expect that Eq. 共1兲should be valid for those types of diffusers and the above-mentioned bubble sizes.
Similar flow patterns surrounding the bubble plumes and water jets were obtained for both volumetric flow rates 共33.3 and 50.0 cm3/s兲. Typical time-averaged flow fields for the square and rectangular setups are shown in Fig. 6. It can be seen that the time-averaged horizontal velocity component,¯u, decreased with height while the vertical velocity component,¯, increased until the flow approached the surface jet region, as observed by Fan-neløp et al.共1991兲and Riess and Fanneløp共1998兲for line-source bubble plumes. However, in our bubble plume tests, strong 3D effects were generated in the rectangular tank, with larger water flow entraining in the longer plane and smaller water flow de-training in the shorter plane. Similar 3D effects were generated in our water jet tests, with water flow entraining in the longer plane and part of the flow entraining 共up to aboutr= 15 cm兲and then detraining in the shorter plane. This implies that the bubble plumes were more affected by the tank asymmetry than the water jets.
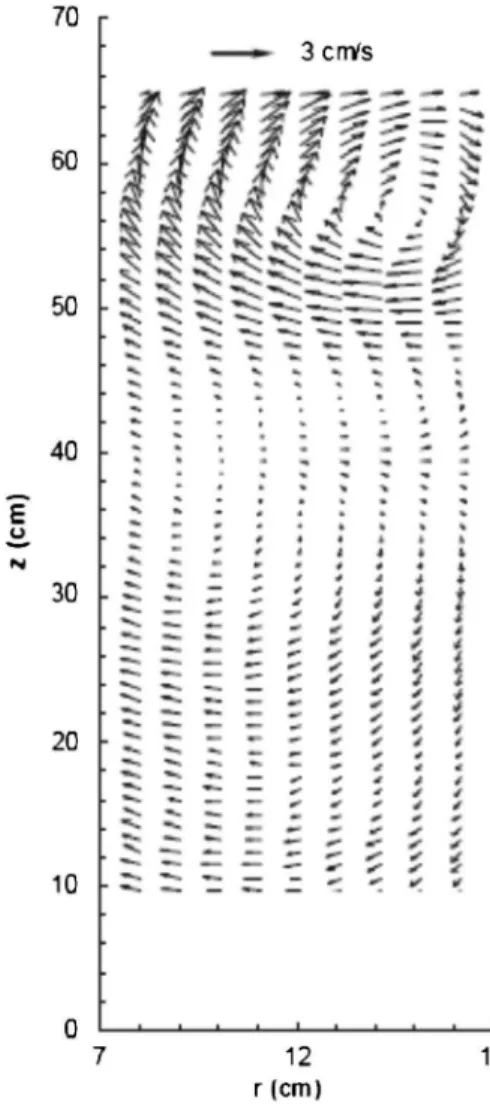
A time-averaged flow field for the bubble plumes in the con-fined setup is shown in Fig. 7, in which more than one circulation flow cell 共vortex兲 was generated, in contrast with the above-mentioned flow patterns for bubble plumes in the square and rectangular setups. The presence of about two vortices stacked vertically in the confined setup is consistent with the results sum-marized by Mudde共2005兲, in which the number of vertical cells is close to the aspect ratio H/2B 共note that in our case H/2B = 1.9兲.
Fig. 8 shows large-circulation patterns for each plane of the square and rectangular setups in which the entraining and
detrain-Fig. 7.Time-averaged velocity field surrounding the bubble plumes in the confined setup共Qo= 33.3 cm3/s兲. Note that the mean vertical
velocity¯is distorted共about 3.5 times smaller兲.
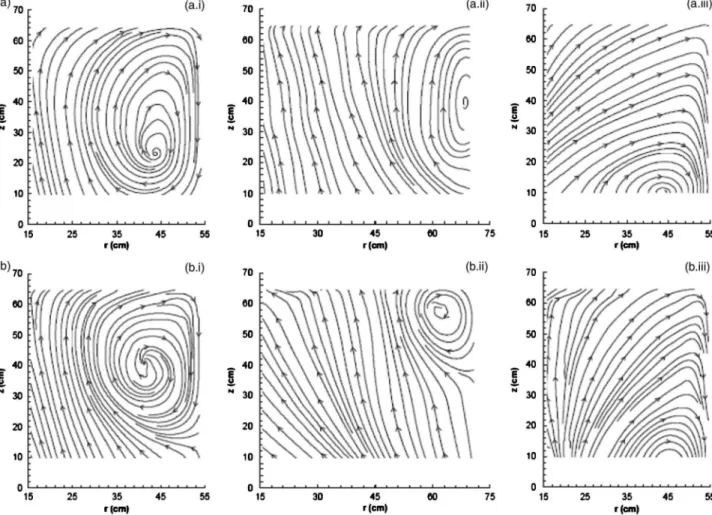
ing flows are clearly represented through streamlines generated from PIV measurements. The flow patterns obtained for the bubbles plumes were similar to those obtained for the water jets, with the center of the circulation cells located approximately at the same positions. However, the center of the circulation cells in the longer plane of the rectangular setup was much closer to the water surface, while in the shorter plane it was closer to the tank bottom. Comparing these flow patterns with that shown in Fig. 7, we can see that both the number of cells and location of their centers varied with tank size and geometry.
The presence of large-circulation flow cells surrounding the bubble plumes and water jets 共see Fig. 8兲is consistent with the length of the cells varying from about two to seven times the water depth reported by Iamandi and Rouse共1969兲, Jirka and Harleman共1979兲, Fanneløp et al.共1991兲, and Riess and Fanneløp 共1998兲. This suggests that tank aspect ratios H/2B lower than about 0.25 are necessary to generate more than one circulation cell in the lateral direction. Note that our aspect ratiosH/2Bwere 0.42 for the longer plane of the rectangular tank and 0.63 for both the square tank and the shorter plane of the rectangular tank, and no secondary cell was observed.
The geometry of the primary circulation cells in each setup can be estimated by the ratio LCV/LCH, in which LCV= vertical distance from the water surface to the center of the circulation cells andLCH= the horizontal distance from the nozzle centerline to the center of the circulation cells 共see Fig. 1兲. This ratio can also be interpreted as an approximate spreading of the surface jet.
Fig. 8.Streamlines generated from time-averaged PIV measurements for the flow surrounding the共a兲bubble plumes;共b兲water jets in the共i兲 square setup,共ii兲longer, and共iii兲shorter planes of the rectangular setup共Qo= 50.0 cm3/s兲
Fig. 9.Variation of the approximate spreading of the surface jet with the ratio of jet radius to tank radius共or half-width兲. Note that MHC, SC, and MVC correspond to the regions in which multiple horizontal cells, single cells, and multiple vertical cells are formed, respectively. Dashed circles indicate the data points obtained in the rectangular setup, where strong 3D effects were observed.
The values ofLCV/LCH, obtained from Figs. 7 and 8 are plotted in Fig. 9 along with the values from the literature. Fig. 9 shows that LCV/LCH increases logarithmically with b/B, which means that longer cells are formed in larger tanks. The curve shown in Fig. 9 关Eq.共2兲兴 was also obtained from curve fitting共r2= 0.964兲of ex-perimental data
LCV LCH
= 0.675 log
冉
bB
冊
+ 1.419 共2兲It is interesting to observe that due to 3D effects in our rect-angular tank, the values of LCV/LCH in the shorter and longer planes were about 1.5 and 0.4 times the value ofLCV/LCHfor the square tank, respectively 共see Fig. 8兲. Besides, the values of LCV/LCHfor bubble plumes are consistently higher than those for water jets, especially for the longer plane of the rectangular setup. This difference may be attributed to larger liquid volume fluxes 共and perhaps higher turbulence levels兲 induced by the bubble
plumes than those induced by the water jets共see Table 1兲, which may have caused higher spreading of the surface jet. It is consis-tent with the results of Fanneløp et al. 共1991兲, in which the pri-mary cell length was found to be a weak function of the flow rate in their bubble plume tests and independent of the flow rate in the water jet tests. This supports the negligibility of the densimetric Froude number, F, in Eq.共2兲. A diagram with approximate limits ofb/Bto estimate the flow patterns of the circulation cells based on the aspect ratios mentioned above is also given in Fig. 9. This diagram shows that multiple horizontal cells 共MHC兲are formed whenb/Bis up to about 0.1, single cells共SC兲are formed when b/B ranges from about 0.1 and 0.7, and multiple vertical cells 共MVC兲are formed whenb/Bis larger than about 0.7. This sug-gests that Eq.共2兲can be used to estimate both the size and num-ber of circulation cells in a general tank.
Typical distributions of the normalized turbulent stresses u⬘u⬘/U2,⬘⬘/U2andu⬘⬘/U2with the normalized vertical
dis-Fig. 10.Typical axial variation of the normalized turbulent stresses measured atr= 15 cm共Qo= 33.3 cm3/s兲for共a兲bubble plumes;共b兲water jets:
共i兲horizontal normal stresses,共ii兲vertical normal stresses, and共iii兲shear stresses
tance from the nozzlez/Lare shown in Fig. 10, in whichUand L= velocity and length scales given above, respectively. Note that the results are shown for values ofz/Lup to 50. For higher values of z/L, the turbulence levels increased significantly as the flow approached the surface jet region共atz/L= 60兲. It can be seen that the horizontal normal stresses,u⬘u⬘/U2, were of the same order of the vertical normal stresses,⬘⬘/U2, and that the shear stresses, u⬘⬘/U2, were much smaller than those, which implies that the turbulent flow field was nearly isotropic for all experiments. The turbulent stresses in the bubble plume tests were more affected by the tank geometry than those in the water jet tests. For example, in the bubble plume tests, the values of⬘⬘/U2for the shorter plane of the rectangular setup were about two times larger than those for the longer plane, while in the water jet tests, the values were of the same order. The magnitude of the turbulent stresses for the bubble plumes in the square and rectangular setups was slightly higher than that for water jets. On the other hand, the magnitude of the turbulent stresses for bubble plumes in the con-fined setup was about three times higher than that in the square and rectangular setups due to the effect of the recirculation ed-dies. Moreover, these stresses did not decay with the inverse of axial distance, as expected for the turbulent stresses inside single-phase jets共see Rajaratnam 1976兲. The axial variation of the terms u⬙u⬙,⬙⬙andu⬙⬙, here referred to as periodic stresses, followed similar trends as those of turbulent stresses for both bubble plumes and water jets, but their magnitude was approximately twice as high.
An examination of the velocity signals in the entire tank共away from the jet/plume region兲revealed that the periodic fluctuations were distributed approximately uniformly across the tank but their strength increased about one order of magnitude as the flow approached the center of the circulation cells. This behavior was similar for bubble plume and water jet tests. The flow fields at different times showed that the circulation cells traveled basically up and down within a distance of up to about 10 and 20% of water depth for the water jet and bubble plume tests, respectively. This was probably the cause of the wandering motions described by Eq.共1兲. The turbulent stresses were also distributed approxi-mately uniformly across the tank. Nearly isotropic turbulence was obtained in the entire tank, with horizontal and vertical normal stresses within about 20% difference. Note that our measurements were limited to a distance of at least 4 cm from the walls.
Summary and Conclusions
An experimental study was conducted to investigate the effect of tank size and geometry on the ambient flow field and circulation patterns induced by circular bubble plumes and water jets. The results revealed a nonstationary nature of the flow for all experi-ments, which was attributed mainly to the presence of coherent structures instead of buoyancy-driven instabilities. The wandering frequency of the bubble plumes was assumed to be equal to the dominant frequency of the velocity oscillations near the bubble core. This frequency was found to increase with air flow rate and to decrease with tank size, and a correlation based on our mea-surements and results available in the literature was proposed to describe this variation.
The mean flow patterns clearly changed with tank geometry. While multiple vortices were stacked vertically for bubble plumes in the confined setup, a large-circulation flow cell surrounding the bubble plumes and water jets was generated in both the square and rectangular setups, but the latter produced strong 3D effects
with larger flow entraining in the longer plane of the rectangular setup and smaller flow detraining in the shorter plane. These 3D effects were more pronounced in the bubble plume tests than in the water jet tests. A parameter corresponding to the spreading of the surface jet was introduced to describe the geometry of the circulation cells. This parameter was found to increase as the tank size became small compared to the radius of the jets and plumes, and a correlation was obtained to describe the flow patterns of the circulation cells as a function of tank size.
Nearly isotropic turbulent flow conditions were obtained in all experiments. However, the effect of tank size and geometry on the intensity of the turbulent stresses was more pronounced in the bubble plume tests. Besides, the axial variation of the turbulent and periodic stresses followed similar trends, but their magnitude was higher for bubble plumes in the confined setup than that in the square and rectangular setups because of the effect of the recirculation eddies.
The above results describe the ambient flow field and circula-tion patterns induced by bubble plumes and water jets, which are important in many engineering applications, including lake and reservoir aeration, mixing in wastewater treatment tanks, and pre-vention of suspended solids settling. It should be pointed out, however, that there are still a few important questions remaining. Our results imply that the wandering motion observed visually in the bubble plume experiments was caused mainly due to vertical oscillations in the position of the large circulation cells共instead of buoyancy-driven instabilities兲. The reason water jets are less sus-ceptible to wandering motion is not clear, possibly due to much higher momentum flux in water jets. The reason for the 3D effects observed in the longer and shorter planes of the rectangular tank is also an open question. One possible explanation for such ef-fects is the presence of secondary flows in the tank, as the surface jet in the shorter plane reaches the tank walls with higher velocity than that in the longer plane. Possible imbalanced Reynolds stresses and nonuniform distributions of wall shear stresses may also play an important role. Further research is needed to answer the above questions.
Acknowledgments
I.E.L.N. is supported by the Coordination for the Improvement of Higher Education Personnel Foundation 共CAPES兲, Ministry of Education, Brazil. The writers are thankful to Perry Fedun and Chris Krath for building the experimental apparatus.
Notation
The following symbols are used in this technical note: do ⫽ nozzle diameter共mm兲;
Qa ⫽ volumetric air flow rate共cm3/s兲; Qw ⫽ volumetric water flow rate共cm3/s兲;
R ⫽ Reynolds number defined asR=Uodo/; r ⫽ radial distance from the plume centerline共cm兲; Uo ⫽ velocity at the nozzle exit for each phase共air or
water兲 共m/s兲; u
¯ ⫽ time-averaged horizontal velocity component 共cm/s兲;
u⬘ ⫽ turbulent horizontal velocity fluctuation共cm/s兲; u⬙ ⫽ periodic horizontal velocity fluctuation共cm/s兲; u⬘u⬘ ⫽ horizontal normal stress due to turbulent fluctuations
共cm2/s2兲;
u⬙u⬙ ⫽ horizontal normal stress due to periodic fluctuations 共cm2/s2兲;
u⬘⬘ ⫽ shear stress due to turbulent fluctuations共cm2/s2兲; u⬙⬙ ⫽ shear stress due to periodic fluctuations共cm2/s2兲;
¯ ⫽ time-averaged vertical velocity component共cm/s兲; ⬘ ⫽ turbulent vertical velocity fluctuation共cm/s兲; ⬙ ⫽ periodic vertical velocity fluctuation共cm/s兲; ⬘⬘ ⫽ vertical normal stress due to turbulent fluctuations
共cm2/s2兲;
⬙⬙ ⫽ vertical normal stress due to periodic fluctuations 共cm2/s2兲;
z ⫽ axial distance from the nozzle exit共cm兲; and ⫽ kinematic viscosity of each phase共air or water兲
共m2/s兲.
References
Abramovich, G. N.共1963兲.The theory of turbulent jets, MIT, Cambridge, Mass.
Bombardelli, F. 共2004兲. “Turbulence in multiphase models for aeration bubble plumes.” Ph.D. thesis, Dept. of Civil and Environmental En-gineering, Univ. of Illinois at Urbana-Champaign, Ill.
Clift, R., Grace, J. R., and Weber, M. E.共1978兲. Bubbles, drops, and particles, Academic, New York.
Fanneløp, T. K., Hirschberg, S., and Küffer, J.共1991兲. “Surface current and recirculating cells generated by bubble curtains and jets.”J. Fluid Mech., 229, 629–657.
García, C. M., and García, M. H.共2006兲. “Characterization of flow tur-bulence in large-scale bubble–plume experiments.” Exp. Fluids,
41共1兲, 91–101.
Iamandi, C., and Rouse, H. 共1969兲 “Jet-induced circulation and diffu-sion.”J. Hydr. Div., 95共2兲, 589–601.
Jirka, G., and Harleman, D. R. F. 共1979兲. “Stability and mixing of a vertical plane buoyant jet in confined depth.” J. Fluid Mech., 94, 275–304.
Lima Neto, I. E., Zhu, D. Z., and Rajaratnam, N.共2008兲. “Air injection in water with different nozzles.”J. Environ. Eng., 134共4兲, 283–294. Mudde, R. F.共2005兲. “Gravity-driven bubbly flows.” Annu. Rev. Fluid
Mech., 37, 393–423.
Rajaratnam, N. 共1976兲. Turbulent jets, Elsevier Scientific, Amsterdam, The Netherlands.
Rensen, J., and Roig, V. 共2001兲. “Experimental study of the unsteady structure of a confined bubble plume.”Int. J. Multiphase Flow, 27共8兲, 1431–1449.
Riess, I. R., and Fanneløp, T. K.共1998兲. “Recirculation flow generated by line-source bubble plumes.”J. Hydraul. Eng., 124共9兲, 932–940. Socolofsky, S. A.共2001兲. “Laboratory experiments of multiphase plumes
in stratification and crossflow.” Ph.D. thesis, MIT, Cambridge, Mass. Soga, C. L. M., and Rehmann, C. R. 共2004兲. “Dissipation of turbulent kinetic energy near a bubble plume.”J. Hydraul. Eng., 130共5兲, 441– 449.