Maria Cris
tina Gr
amani
CADERNO
S DE PESQUIS
A v
.4
7 n.
164 p
.4
7
0-4
9
3 abr
./jun. 20
17
47
1
ARTICLES
http://dx.doi.org/10.1590/1980531434220
DOES
SOCIOECONOMIC
INEQUALITY AFFECT
EDUCATION MORE
IN LESS WEALTHY
MUNICIPALITIES?
MARIA CRISTINA GRAMANIABSTRACT
This study attempts to capture the full picture of educational development in an emerging country that is characterized by both high economic development and high socioeconomic inequality. A two-step model is used in this study. The first step uses the variables that are directly related to education to capture the educational efficiency of each municipality; the second step uses a statistical Tobit model to estimate the influence of the non-discretionary variables on the educational efficiency found in the first step. A previous categorization by clusters is also implemented to ensure a fair comparison among homogeneous municipalities. The results show significant discrepancies in the influence of socioeconomic variables on educational outcome, which depends on the welfare of the cluster.
Data EnvElopmEnt analysis – DEa • EDucational EfficiEncy • Basic EDucation • socioEconomic inEqualitiEs
47
DOES SOCIOEC
ONOMIC INEQU
ALITY AFFECT EDUCA
TION MORE IN LES
S WEAL
THY MUNICIP
ALITIES
?
47
2
CADERNO
S DE PESQUIS
A v
.4
7 n.
164 p
.4
7
0-4
9
3 abr
./jun. 20
17
T
HE DEVELOPMENT OF A COUNTRY IS MEASURED BY FACTORS SUCH AS ECONOMICperformance, living standards, sustainability and equality. Developing countries exhibit discrepancies regarding these factors; for example, a developing country may have a high Gross Domestic Product – GDP – but a poor position on the Human Development Index – HDI. This discrepancy is the case, for example, in 2014, in Brazil, India and Russia, which are ranked 7th, 9th and 10th respectively in terms of GDP, but 75th, 130th and 50th respectively on the HDI.1
High inequality can also be found within countries. For example, Brazil has the third-highest Gini index in Latin America. However, Brazil includes cities with a low Gini index of 0.28 (similar to Norway, which has a Gini index of 0.25) and cities with a high Gini index of 0.8. These substantial inequalities imply that areas for improvement may differ among cities or regions in a country and, consequently, that educational policies must also differ. Rumberger and Palardy (2005) show, in a study that is based on a sample of 14,199 American high school students, that the policies that are designed to promote school performance in one region may not promote performance and may even lead to worse performance in another region.
Thus, within-country discrepancies make developing countries, such as Brazil, interesting to study because, despite high economic development and high socioeconomic inequalities, the different 1
Available at: <http://data. worldbank.org>; <http:// www.br.undp.org>. Access
on: 03 May 2017.
47
Maria Cris
tina Gr
amani
CADERNO
S DE PESQUIS
A v
.4
7 n.
164 p
.4
7
0-4
9
3 abr
./jun. 20
17
47
3
cultures among regions and the large discrepancies within regions can lead to poor performance in key areas such as education.
The education performance in developing countries is greatly affected by non-discretionary variables, and it is necessary to use factors in its analysis that are not directly related to education such as schools, teachers and spending. In developing countries with significant inequality, the aspects that are related to basic living conditions, such as access to sewage systems and water treatment, and the factors that are related to social development variables, such as maternal education, illiteracy rates, dropout rates, and others, must be considered in educational performance analysis. A within-country investigation can help government decision-makers to determine which resources will actually affect the performance of education in each region of a country. In a developing country that spans a continent and has large socioeconomic inequalities, such as Brazil, potential improvements must differ from region to region, and the question “Does socioeconomic inequality affect education more in less wealthy municipalities?” becomes important.
The contribution of this paper is threefold. (1) First, because of the within-country discrepancies, we categorize Brazilian municipalities in homogeneous clusters to more equitably make the relative comparison. (2) To consider the link between educational efficiency and socioeconomic indicators, we built a two-step model that in the first step, analyses the differing within-country educational needs. And (3), in the second step, the model shows the different influences of non-discretionary variables on educational efficiency. In the first step, the Data Envelopment Analysis – DEA – model is used to measure the use of resources to achieve greater performance and, in the second step, a Tobit regression shows the different effects of high-level socioeconomic inequalities on the educational efficiency in municipalities.
The remainder of the paper is organized as follows. In the next section, a brief literature review of educational efficiency is presented, which is followed by a specific description of the Brazilian educational system, including its structure, financing and evaluation. Section 4 presents the two-step model, the clustering method and the database for both educational efficiency and the socioeconomic conditions of developing countries. The empirical results of the two-step model are discussed in section 5. Finally, in section 6, we present some concluding remarks.
EDucational EfficiEncy: litERatuRE REviEW
The literature on educational efficiency includes many studies that use
DOES SOCIOEC
ONOMIC INEQU
ALITY AFFECT EDUCA
TION MORE IN LES
S WEAL
THY MUNICIP
ALITIES
?
4
74
CADERNO
S DE PESQUIS
A v
.4
7 n.
164 p
.4
7
0-4
9
3 abr
./jun. 20
17
teachers and assessments, as well as socioeconomic variables, such as parents’ occupations, parents’ educational attainments, grants, different cultural and social backgrounds, rural and urban schools, income and poverty (MANCEBON; BANDRES, 1999; AFONSO; AUBYN, 2006; PRIMONT; DOMAZLICKY, 2006; RASSOULI-CURRIER, 2007; HOMLUND; MCNALLY; VIARENGO, 2010). Considering the determinants of educational efficiency in an environment with high inequality, such as in developing countries, Hauner (2008) observed significant educational and health efficiency differences across Russia’s regions and suggested that, on average, the current health and education outcomes could be produced with approximately two-thirds of the actual inputs if the less efficient regions emulated the more efficient ones. Similarly, Rodríguez-Pose and Tselios (2011) revealed a strong correlation between the levels of educational attainment and inequality across 102 regions in Western Europe. Henriquez et al. (2012) studied the highly heterogeneous educational system of Chile, but verified the existence of schools that successfully serve low-income students. The existing studies have shown that, in Brazil, the more economically developed regions (Southeast and South) exhibit superior performance in education. The yearbook of the Todos Pela Educação program (2012) corroborates these regional efficiency differences, and the Northeast shows the greatest disadvantages in terms of graduation rates, dropout rates and national achievement scores.
Emerging countries are characterized by urgent basic needs that are related to living conditions, such as infrastructure and access to sewage systems and treated water, in contrast with developed countries, which must improve in more advanced aspects. Murillo and Roman (2011, p. 29) note
[…] that the availability of basic infrastructure and services
(water, electricity, sewage), didactic facilities (sport installations,
labs, libraries), as well as the number of books in the library and
computers in the school do have an effect on the achievement
of primary education students in Latin America, but their relative
weight varies significantly from country to country.
The socioeconomic discrepancies within regions in a developing country can be alarming. For example, the Observatório do PNE [Observatory of the National Education Plan] shows that in the Northeast region of Brazil2, the percentage of water treatment varies from 0.15% to 99% of all municipalities, and access to sewage systems varies between 0 and 100% of all municipalities. Thus, although the contribution of within-region inequalities to international inequality is considered small (UNITED NATIONS, 2006), it is important to 2
Available at: <http://www. observatoriodopne.org.br/>. Access on: 03 May 2017.
47
Maria Cris
tina Gr
amani
CADERNO
S DE PESQUIS
A v
.4
7 n.
164 p
.4
7
0-4
9
3 abr
./jun. 20
17
47
5
understand and advocate political policies that address the regional disparities in emerging nations because these variables significantly affect educational efficiency and other factors.
Two important points distinguish this paper from other papers. First, we analyze almost all municipalities of a developing country that has a high GDP but is positioned much lower than expected on the HDI. Second, instead of comparing Brazilian municipalities by region, we distribute the municipalities into three clusters using the K-means methodology to ensure a fair comparison among homogeneous municipalities, as well as Henriquez et al. (2012), in Brazil it is also verified the existence of schools that successfully serve low-income students. Therefore, in this study, we will not consider Brazil by regions but by clusters of municipalities.
THE BRAZILIAN EDUCATIONAL SYSTEM
SYSTEM STRUCTURE
Basic education in Brazil is divided into two levels, namely, fundamental education and middle education. Fundamental education is divided into fundamental I, which includes levels 1-5 (i.e., students who are 6 to 10 years old), and fundamental II, which includes levels 6-9 (i.e., students who are 11 to 14 years old). Middle education contains series 1-3 (i.e., students who are 15 to 17 years old). Education is compulsory from the ages of 4 to 17 years, including pre-school, fundamental and middle education. The educational system is obligated to ensure this enrollment.
In Brazil, the early years of fundamental education (i.e., Fundamental I) are taught by teachers in various disciplines who interact with the same group of students throughout the entire school year. At Fundamental level II, teachers are specialists, and schools have, in general, a teacher for each subject. For the basic education, teachers are required to hold higher education degrees, although this is not the reality in Brazil. Approximately 30% of the teachers at the fundamental I level do not have higher education degrees, and approximately 70% of the teachers at the Fundamental II level do not have a higher education degree in the area in which they teach (Table 1).
4
DOES SOCIOEC
ONOMIC INEQU
ALITY AFFECT EDUCA
TION MORE IN LES
S WEAL
THY MUNICIP
ALITIES
?
47
6
CADERNO
S DE PESQUIS
A v
.4
7 n.
164 p
.4
7
0-4
9
3 abr
./jun. 20
17
TABLE 1
pERcEntaGE of stuDEnts anD of tEacHERs of funDamEntal lEvEl AND PUBLIC INVESTMENT IN EDUCATION – BRAZIL – 2007-2011
STUDENTS, TEACHERS
AND INVESTMENT 2007 2008 2009 2010 2011
Percentage of students (6-14 years old)
enrolled at the fundamental level 92.6 93.8 98.3 - 93.7
Percentage of teachers, at the
fundamental level, with a higher education degree
69.8 68.9 69.7 70.8 73.0
Percentage of teachers, at the fundamental I level, with a higher education degree
62.5 61.6 62.8 64.0 66.3
Percentage of teachers, at the fundamental II level, with a higher education degree
- - 63.9 65.0 71.4
Percentage of teachers, at the fundamental II level, with a higher education degree in the same area as the discipline taught
- - 14.2 15.3 28.7
Direct public investment in education per
pupil (R$) for basic education 3,073.5 3,524.2 3,813.9 4,353.0 4,916.3
source: observatório do pnE (http://www.observatoriodopne.org.br/downloads).
financinG
According to the Organization for Economic Co-operation and Development – OECD –, in its report Panorama da Educação from 2013, it is noted that Brazil’s public investment in education has grown significantly during the past decade, from 3.5% of GDP in 2000 to 5.6% in 2010. However, the level of spending remains lower than the OECD national average, which was 6.3% in 2010 (OCDE, 2013). Public schools are responsible for educating the majority of the population; at the fundamental level, public schools enroll 87% of Brazil’s students (INEP).3
The financing distribution system of basic public education in Brazil has changed. According to Ulyssea, Fernandes and Gremaud (2006), until the mid-1990s, educational funding was completely decentralized. The volume of financing depended exclusively on the revenue and enrollment in each federal unit. In 1996, the Fund for the Maintenance and Development of Fundamental Education and Valorization of Teaching – FUNDEF – was created and was designed to use state- and municipality-provided resources to redistribute funds to state and local governments according to the ratio of the number of students who were enrolled annually. In 2007, FUNDEF was extended to all levels of basic education (it was previously limited to the fundamental levels) and replaced by the Fund for the Maintenance and Development of Basic Education and Valorization of Teaching – FUNDEB. Under current FUNDEB rules, the amount to be distributed depends on the cost per pupil for each state, which is calculated based on the fund’s estimated revenue and the number of students who are enrolled in 3
The Instituto Nacional de Educação e Pesquisa Educacional Anísio Teixeira [National Institute of Educational Studies Anísio Teixeira] – INEP – is a federal agency under the Ministry of Education – MEC. INEP’s mission is to promote studies, research and reviews of the Brazilian educational system to support the formulation and implementation of public policies for education using quality and equity parameters and to produce clear and reliable information for managers, researchers, educators and the general public (www.inep.gov.br).
47
Maria Cris
tina Gr
amani
CADERNO
S DE PESQUIS
A v
.4
7 n.
164 p
.4
7
0-4
9
3 abr
./jun. 20
17
47
7
basic education in public schools (both state and municipal schools, according to the latest school census).4
Although the expansion of FUNDEB was important for the country, “the challenge now is to make these resources available and to allow easy access to these levels of education for all children and youth of the country”5 (FUNDO DAS NAÇÕES UNIDAS PARA A INFÂNCIA – UNICEF, 2009, p. 42).
EVALUATION
The evaluation of basic Brazilian educational performance is recent. The Índice de Desenvolvimento da Educação Básica [Basic Education Development Index] – Ideb – index was created by INEP in 2007 to combine the two concepts of school flow and performance on national assessments, which are related to educational quality, into a single indicator. School flow is measured using the data on the approvals that were obtained from the school census, and performance on assessments is obtained using two national tests, namely: Sistema Nacional de Avaliação
da Educação Básica [National System of Evaluation of Basic Education] –
Saeb – and Prova Brasil. An institution with a better performance on the test and less grade repetition and dropouts will receive a better rating. The Ideb index provides a result from zero to ten and is applied to students in both public and private schools at the 5th and 9th levels of fundamental education and in the 3rd grades of middle education. The calculation for the Ideb index is as follows:
IDEBji = Nji * Pji (1)
0 ≤ Nji ≤ 10 ; 0 ≤ Pji ≤ 1 ; 0 ≤ IDEB ≤ 10 (2),
where:
i = year of the national assessment (Saeb and Prova Brasil);
Nji = average proficiency in Portuguese and mathematics, which is standardized with a range from 0 to 10, for the students of unit j that was obtained in the national assessment (Saeb and Prova Brasil) at the end of the educational stage;
Pji = indicator based on the approval rate of the students from unit j
concerning the level of education.
The use of an output indicator to measure educational performance (national achievement scores) is the consensus in the literature (BRYK; THUM, 1989; RUMBERGER, 1995; NEAL, 1997; RUMBERGER; THOMAS, 2000; LEE; BURKAM, 2003).
4
Available at: <www.mec.gov. br>. Access on: 03 May 2017.
5
In the original quotation text: “o desafio agora é disponibilizar esses recursos e permitir um fácil acesso a esses níveis de educação para todas as crianças e jovens do país” (my translation).
47
DOES SOCIOEC
ONOMIC INEQU
ALITY AFFECT EDUCA
TION MORE IN LES
S WEAL
THY MUNICIP
ALITIES
?
47
8
CADERNO
S DE PESQUIS
A v
.4
7 n.
164 p
.4
7
0-4
9
3 abr
./jun. 20
17
METHOD
tWo-stEp DEa moDEl
The methodology consists of two steps: the first one evaluates the educational efficiency taking into account variables directly related to education; and the second step consists in regressing of socioeconomic inequality factors and determining which of them most affects educational efficiency.
First step: efficiency measure by data envelopment analysis – DEA To evaluate educational efficiency, we use DEA, which originated in the work of Charnes, Cooper and Rhodes (1978). DEA is a nonparametric method that evaluates the relative efficiency of production units that are called decision-making units – DMUs. DMUs can be represented by divisions or administrative units such as municipalities, provided that they are homogeneous; that is, these groups must produce the same goods and services (outputs) using the same resources (inputs), and they vary only in their intensity (DYSON et al. 2001). To optimize each individual observation and determine the efficiency frontier, the two classic DEA models of constant returns to scale – CRS – and variable returns to scale – VRS – are used. The CRS model assumes that an increase in input generates a proportional increase in output. The VRS model allows for gains in productive efficiency as the scale of production varies, assuming that there is no proportionality between the variations in inputs and outputs.
In addition, two types of optimization are possible. According to Coelli et al. (2005, p. 54), input-oriented technical efficiency addresses the following question: “How much can input quantities be proportionally reduced without changing the output quantities produced?” The output-oriented measure addresses a different question: “How much can output quantities be proportionally expanded without altering the input quantities used?”
Mathematically, the VRS output-oriented DEA model computes the efficiency of I DMUs using S inputs and M outputs for each DMU to determine the proportionally expanded outputs, with inputs held constant. The output efficiency is defined by ɸ, and the efficiency emphasis is assigned to the output (first) constraint.
maxɸ,λɸ,
s.a.-ɸqi + Qλ ≥ 0 (3)
xi - Xλ ≥ 0 (4)
N1′λ = 1 (5) λ ≥ 0 (6)
47
Maria Cris
tina Gr
amani
CADERNO
S DE PESQUIS
A v
.4 7 n. 164 p .4 7 0-4 9 3 abr ./jun. 20 17 47 9 where:
S is the number of inputs, M is the number of outputs, and I is the number of DMUs;
xi is the S×1 vector of inputs of the i-th DMU; qi is the M×1 vector of outputs of the i-th DMU; X is a S×I input matrix, and Q is a M×I output matrix;
ɸ is a scalar of 1 ≤ ɸ < ∞;
λ is a I×1 vector of constants, and N1 is an Ix1 vector of ones.
Generally, in the first step, educational efficiency is evaluated using the variables that are related to students, expenditures and teachers as inputs, and assessments as outputs (Chart 1).
CHART 1
list of vaRiaBlEs usED in tHE tWo-stEp moDEl, By otHER autHoRs
AUTHORS fiRst stEp SECOND STEP
DEA INPUTS DEA OUTPUTS INDEPENDENT VARIABLES
Ray (1991) Classroom teachers per pupil
Support staff per pupil Administrative staff per pupil
Mathematics score Language arts score Writing score Reading score
Parental education Income per capita
Median value of owner-occupied housing units
Percentage of students in the district from ethnic minority groups
Percentage of students from families receiving aid and families with dependent children
Percentage of families with income below the poverty level in 1979
Percentage of children in the community from single-parent families
Kirjavainen and Loikkanen (1998)
Teaching hours per week
Non-teaching hours per week
Experience of teachers Education of teachers Admission level or Educational level of students’ parents
Number of students who passed their grade (were moved up) Number of graduates Score in compulsory subjects in matriculation examination
Score in additional subjects in matriculation examination School size Class size Private Female Heterogeneity Parents’ education Afonso and Aubyn (2006) Teacher-student ratio Hours in school
PISA indicator GDP per capita
Parents’ educational attainment
Bradley, Johnes and Millington (2001)
The proportion of pupils ineligible for free school meals
The proportion of qualified teachers
The proportion of 5+GCSE (General Certificate of Secondary Education) grades a*-c
Attendance rate
The school independence from local authority control
The degree of competition between non-selective schools
Gender composition of the school Population density
Local unemployment rate
Areas with a high proportion of professional and managerial workers
Expenditure on teachers and books Size of the school
Agasisti (2013) Student-teacher ratio The proportion of computers connected to the web
Indicators, for each school, of student average SES
PISA math result PISA science result
School location
School located in a small or in a large city Academic, technical and private schools School size and class size, in terms of student numbers
Percentage of girls Parental pressure
source: author’s elaboration.
47
DOES SOCIOEC
ONOMIC INEQU
ALITY AFFECT EDUCA
TION MORE IN LES
S WEAL
THY MUNICIP
ALITIES
?
480
CADERNO
S DE PESQUIS
A v
.4
7 n.
164 p
.4
7
0-4
9
3 abr
./jun. 20
17
Thus, I propose a model in which the DMUs are 5,020 Brazilian municipalities and that considers four variables, three inputs and one output. The inputs are (i) the expenditure per student, (ii) the percentage of teachers with higher education degrees (HED_teacher) and (iii) the percentage of teachers with higher education degrees in the areas in which they teach (AREA_HED_teacher). The output is the Ideb index obtained by the municipality, in the last year of fundamental II level, for public primary schools, which capture not only the assessment but also students´ approval rate. The educational efficiency model that is used in this study is output-oriented because we attempt to maximize the performance of the municipalities, given their existing investments.
Second step: statistical Tobit model
In the second step, it is common to use a regression to assess the effects of the environmental, or non-discretionary, variables in the results that are obtained in the first step (RAY, 1991; KIRJAVAINEN; LOIKKANEN, 1998; BRADLEY; JOHNES; MILLINGTON, 2001; AFONSO; AUBYN, 2006; AGASISTI, 2013). According to Liu et al. (2013, p. 899), “methodologically, basic education studies show preference for the two-step contextual DEA method”. Simar and Wilson (2004) present an extensive list of papers using the two-step approach.
Ordinary Least Square is not an appropriate method to determine the effect of environmental aspects on the educational efficiency of municipalities because of the nature of the dependent variable. In our case, the dependent variable, the efficiency score, is between 0 and 1, and the distribution is not normal but censured at 0 and 1; therefore, the Tobit regression is more appropriate for analysis. Many studies in the literature use the DEA and Tobit methods, and as Kirjavainen and Loikkanen (1998) we simply want to test whether some socioeconomic factor has explanatory power for the educational efficiency differences.
Therefore, the dependent variable that is used in the Tobit model in this paper is the efficiency score that is obtained by DEA in the first step. The independent variables are:
• Access to sewage systems: The variable of access to sewage systems represents basic living conditions mainly for developing countries. According to Health Systems 20/20 (2012, p. 101), “Almost half the people in the developing world have one or more of the main diseases or infections associated with inadequate water supply and sanitation”.6
• Maternal education: We use maternal education because a large number of studies report a significant relation between maternal education and socioeconomic inequality (HANUSHEK; LUQUE, 2003; CHUDGAR; LUSCHEI, 2009; CHUDGAR; SHAFIK, 2010).
• Dropout rates: According to Fernandes (2007, p. 7), “An ideal system would be one in which all children and adolescents have access 6
In the original quotation text: “Quase metade das pessoas no mundo em desenvolvimento têm uma ou mais das principais doenças ou infecções associadas com abastecimento de água inadequado e falta de saneamento” (my translation).
47
Maria Cris
tina Gr
amani
CADERNO
S DE PESQUIS
A v
.4
7 n.
164 p
.4
7
0-4
9
3 abr
./jun. 20
17
481
to school, did not waste time with grade repetition, they did not leave school early and at the end of it, all of them learn”.7 However, according to an OECD report (2012), Brazil still must overcome the geographic disparities in the number of students who drop out and repeat grades.
• Gini index: The Gini index measures the degree of inequality in the distribution of family income in a country (lower numbers are better); for example, in Brazil in 2012, this index varied from 0.28 to 0.80.8
• Income per capita: The income per capita is a proxy for the wealth of the municipality from a developing country.
• Illiteracy rate: Although the literacy rate has been improving in Brazil, it still varies from 0 to 39% in the municipalities.
• Appropriate level: This variable indicates the percentage of the population who is 11 to 13 years old and attended the final years of the fundamental level or has already completed this level. This variable is a proxy for the student evolution in schools.
The regression model may be defined as:
(7) (8) (9)
y* = βxi+ Ɛi (10)
where:
y is the efficiency score from DEA model;
y* is a latent (unobservable) variable;
β is the parameter of the nondiscretionary input to be estimated in the second step;
xi is the vector of non-discretionary inputs, previously presented. In this way, this regression model intends to show which non-discretionary variable has a significant effect on the education efficiency of the municipalities. In Brazil, it is difficult to identify the educational or socioeconomic factor that has the greatest potential influence on improvements in educational efficiency, because the continental dimensions of the country, the great within-country inequalities and the availability of basic resources are not ideal.
clustERinG mEtHoD: K-mEans alGoRitHm
Other studies commonly use regions for classification; however, as noted previously, there are large discrepancies among the regions of Brazil. Therefore, to ensure the homogeneity of the DMUs, I aggregated
7
In the original quotation text: “Um sistema ideal seria aquele em que todas as crianças e adolescentes tivessem acesso à escola, não perdessem tempo com repetição de ano, não saíssem da escola precocemente e no final, todos aprendessem” (my translation).
8
Available at: <http://tabnet. datasus.gov.br/ cgi/ibge/ censo/cnv/ginibr.def>. Access on: 03 May 2017.
DOES SOCIOEC
ONOMIC INEQU
ALITY AFFECT EDUCA
TION MORE IN LES
S WEAL
THY MUNICIP
ALITIES
?
482
CADERNO
S DE PESQUIS
A v
.4
7 n.
164 p
.4
7
0-4
9
3 abr
./jun. 20
17
the municipalities by common characteristics using the K-means clustering algorithm. According to Yang (2010, p. 239), “clustering algorithms are a collection of methods to divide a set of n observations into g clusters so that members of the same cluster have more common characteristics than members from different groups.”
The K-means methodology is a simple and frequently used clustering algorithm that was first proposed in 1955 (JAIN; DUBES, 1988; DRINEAS; KANNAN; MAHONEY, 2006; JAIN, 2010). The K-means algorithm is based on many groups (clusters) that are pre-defined (k) such that the squared error between the empirical mean of a cluster and the points in the cluster is minimized.
Following Jain (2010), let X={xi}, i=1,…,n be the set of n d-dimensional points to be clustered into a set of K clusters, C={Ck,k=1,…,K}. Let μk be the mean of cluster Ck. The squared error between μk and the points in cluster Ck is defined as:
(11)
The goal of K-means is to minimize the sum of the squared errors over all K clusters. Because squared errors always decrease with the number of K clusters (with J(C) = 0 when K = n), the sum can be
minimized only for a fixed number of clusters. Because the complexity of the K-means clustering problem is NP-hard, heuristic algorithms are generally used.
Thus, before we apply the DEA model, we use the K-means algorithm to categorize the municipalities in three clusters, considering all educational and socioeconomic variables. The use of clusters can diminish possible statistical errors that are not captured by DEA (through the existence of an outlier or measurement error).
DATABASE AND SUMMARY STATISTICS
All data used in this study were obtained from public databases provided by government agencies on their websites, as shown in Chart 2.
Maria Cris
tina Gr
amani
CADERNO
S DE PESQUIS
A v
.4
7 n.
164 p
.4
7
0-4
9
3 abr
./jun. 20
17
483
CHART 2
DEfinitions anD souRcEs of tHE vaRiaBlEs
VARIABLE DEfinition SOURCE
Expenditure per student
Fundamental-level educational spending per student in public school for each municipality
Fundo Nacional de Desenvolvimento da Educação - Sistema de
Informações sobre Orçamentos Públicos em Educação – FNDE-SIOPE System, 2010
HED_teacher The percentage of teachers, at the fundamental level, with higher education degrees
<http://www.observatoriodopne.org. br/>, 2010
AREA_HED_teacher The percentage of teachers, at the fundamental II level, with higher education degrees in the areas in which they teach
<http://www.observatoriodopne.org. br/>, 2010
Ideb The Basic Education Development index, a national assessment, obtained by the municipality in the last year of fundamental II level, of public primary school
<http://ideb.inep.gov.br/>
Access to sewage systems
The percentage of public schools, at the fundamental level, with access to sewage systems
<http://www.observatoriodopne.org. br/>, 2010
Maternal education Percentage of household mothers without complete fundamental education and with children under 15 years (2010)
<www.pnud.org.br>, 2010
Dropout rate Dropout rate for the fundamental II level of public education by municipality. (The dropout rate is defined as the percentage of enrolled students who, in a given grade, fail to attend school during the school year)
INEP – Statistical Information – Education Indicators, 2011.
Gini index Gini index value of per capita household income of people living in a given geographical area, in the current year
IBGE – Brazilian Institute of Geography and Statistics, 2010. <http://tabnet.datasus.gov.br/cgi/ ibge/censo/cnv/ginibr.def>
Income Income per capita, 2010 IBGE – Brazilian Institute of Geography and Statistics, 2010. <http://tabnet.datasus.gov.br/cgi/ ibge/censo/cnv/ginibr.def>
Appropriate level Percentage of the population from 11 to 13 years old attending the final years of the fundamental level or who have already completed this level
Atlas Human Development, 2010 <http://www.atlasbrasil.org.br>
Illiteracy rate Ratio of the population from 11 to 14 years of age who cannot read or write a simple note and the total number of people in this age group multiplied by 100
Atlas Human Development, 2010 <http://www.atlasbrasil.org.br>
source: author’s elaboration.
This study analyzes the efficiency of municipalities at the fundamental educational level. This level has been selected because, despite improvements in recent assessments, the growth rate appears to be slow according to the data presented in Table 1.
The analysis includes 5,020 municipalities from a group of 5,565 that were considered. A total of 545 municipalities were eliminated because of unavailable data on expenditure per student and/or information regarding teachers. Applying the K-means algorithm from Stata software (considering all variables from the proposed model),
DOES SOCIOEC
ONOMIC INEQU
ALITY AFFECT EDUCA
TION MORE IN LES
S WEAL
THY MUNICIP
ALITIES
?
484
CADERNO
S DE PESQUIS
A v
.4
7 n.
164 p
.4
7
0-4
9
3 abr
./jun. 20
17
cluster 1, containing 2,425 municipalities; cluster 2, containing 2,026 municipalities; and cluster 3, containing 569 municipalities.
All data were obtained for the fundamental level, except for the data regarding expenditure per student and AREA_HED_teachers. The variable expenditure per student is available for the entire federal unit; thus, we calculated it using the weighted average that is spent by each municipality according to each school’s enrollment at the fundamental level. The variable of AREA_HED_teachers was used for the fundamental II level because the past three years of the fundamental level are the years when most students require specialized teachers.
Table 2 presents the descriptive statistics for all variables that are separated into the three clusters. Notably, if we consider all municipalities together, we will lose important differences because the clusters have significant dissimilarities. On average, cluster 2 is the group with the smallest values for expenditure per student, HED_ teachers, AREA_HED_teachers, and the poorest basic living conditions; therefore, this cluster clearly aggregates the most disadvantaged Brazilian municipalities. Clusters 1 and 3 are similar in some variables, but cluster 3 has an advantage in all variables except access to sewage systems.
It is also important to emphasize that even the most advantaged municipalities require significant improvements with respect to satisfying basic needs. The percentage of schools with access to sewage systems in cluster 3 varies from 0.1% to 100%, and the average of this variable is lower than 50% for all clusters.
Table 2 also presents the correlation matrix among all the variables, including both the variables that are directly related to education (used in the first step) and the environmental variables (used in the second step).
Maria Cristina Gr amani
CADERNOS DE PESQUIS A v.4
7 n.164 p .47 0-49 3 abr./jun. 20 17 485
TABLE 2
DESCRIPTIVE STATISTICS
MATRIX CORRELATION
VARIABLE MEAN STD. DEV. MIN MIN. 1 2 3 4 5 6 7 8 9 10 11
cluster 1
1. HED_teacher 78.6 15.6 2.20 100.0 1.00 0.42 0.44 0.14 0.32 0.43 -0.33 -0.29 0.45 -0.54 0.41
2. AREA_HED 25.6 18.4 0.10 100.0 1.00 0.35 0.05 0.52 0.23 -0.16 -0.22 0.26 -0.28 0.19 3. Ideb 4.2 0.6 1.90 6.40 1.00 0.11 0.31 0.33 -0.51 -0.31 0.40 -0.46 0.31 4. Expenditure 4,635.6 443.5 3,909.52 5,601.4 1.00 0.02 0.16 -0.20 -0.03 0.17 -0.15 0.14 5. Access to sewage 41.5 37.8 0.10 100.0 1.00 0.23 -0.13 -0.23 0.33 -0.24 0.11 6. Maternal edu 83.2 8.2 36.74 98.6 1.00 -0.27 -0.27 0.44 -0.38 0.36 7. Dropout rates 3.5 3.0 0.00 24.8 1.00 0.17 -0.40 0.38 -0.35
8. Gini index 0.5 0.0 0.29 0.76 1.00 -0.05 0.29 -0.28
9. Income 586.6 217.0 121.32 1.866.5 1.00 -0.46 0.35
10. Illiteracy rate 2.0 2.0 0.00 29.5 1.00 -0.50
11. Appropriate level 87.9 6.0 50.87 100.0 1.00
Cluster 2
1. HED_teacher 55.1 25.5 0.10 100.0 1.00 0.54 0.46 0.43 0.39 0.37 -0.38 -0.36 0.54 -0.47 0.51 2. AREA_HED 11.3 12.9 0.10 90.5 1.00 0.42 0.36 0.51 0.28 -0.29 -0.34 0.50 -0.42 0.39
3. Ideb 3.5 0.7 1.60 6.40 1.00 0.28 0.39 0.36 -0.65 -0.23 0.54 -0.52 0.37 4. Expenditure 3,184.4 453.1 1,868.85 3,909.2 1.00 0.34 0.34 -0.20 -0.34 0.47 -0.40 0.36 5. Access to sewage 18.5 26.6 0.10 100.0 1.00 0.32 -0.20 -0.35 0.56 -0.42 0.30 6. Maternal edu 74.6 10.2 22.41 97.2 1.00 -0.28 -0.34 0.49 -0.46 0.38 7. Dropout rates 6.7 4.6 0.00 28.0 1.00 0.11 -0.39 0.43 -0.44 8. Gini index 0.52 0.06 0.32 0.80 1.00 -0.32 0.43 -0.39
9. Income 351.1 178.2 96.25 1,253.1 1.00 -0.63 0.45
10. Illiteracy rate 5.8 4.0 0.00 31.0 1.00 -0.63
11. Appropriate level 80.5 9.0 34.62 98.31 1.00
Cluster 3
1. HED_teacher 84.1 12.4 33.3 100.0 1.00 0.31 0.19 -0.03 0.18 0.20 -0.07 -0.18 0.20 -0.31 0.26 2. AREA_HED 25.3 18.8 0.10 100.0 1.00 0.18 0.03 0.44 0.06 -0.09 -0.18 0.02 -0.15 0.06
3. Ideb 4.3 0.6 2.60 6.20 1.00 -0.01 0.27 0.33 -0.49 -0.27 0.25 -0.27 0.26 4. Expenditure 6,572.7 1,183.2 5,604.3 18,773.4 1.00 0.03 0.11 0.00 -0.08 0.06 -0.05 0.11 5. Access to sewage 37.8 40.6 0.10 100.0 1.00 0.09 -0.21 -0.22 0.12 -0.09 0.03 6. Maternal edu 87.1 7.3 52.78 100.0 1.00 -0.22 -0.21 0.32 -0.29 0.27 7. Dropout rates 2.3 2.7 0.00 23.4 1.00 0.14 -0.16 0.16 -0.27 8. Gini index 0.47 0.07 0.28 0.77 1.00 0.19 0.23 -0.29
9. Income 678.4 251.0 180.53 2,043.7 1.00 -0.29 0.18
10. Illiteracy rate 1.4 1.38 0.00 11.91 1.00 -0.38
11. Appropriate level 90.3 6.50 40.22 100.0 1.00
source: author’s elaboration.
DOES SOCIOEC
ONOMIC INEQU
ALITY AFFECT EDUCA
TION MORE IN LES
S WEAL
THY MUNICIP
ALITIES
?
486
CADERNO
S DE PESQUIS
A v
.4
7 n.
164 p
.4
7
0-4
9
3 abr
./jun. 20
17
RESULTS AND DISCUSSION
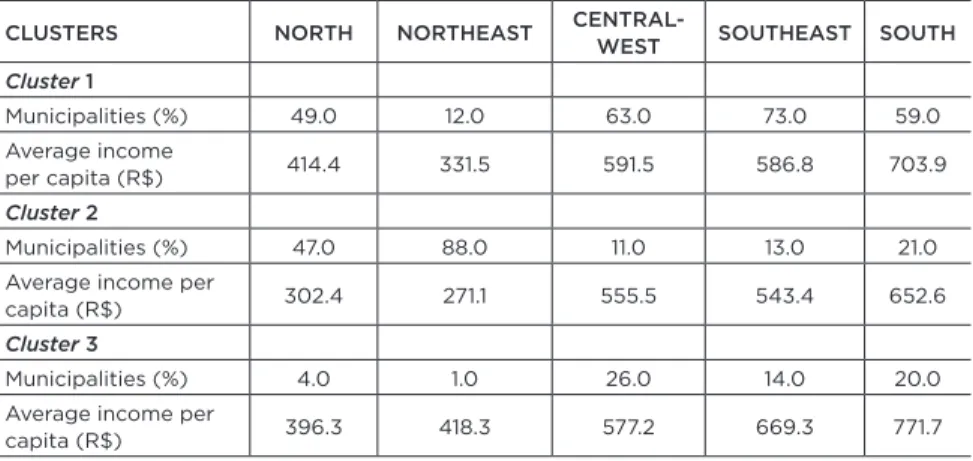
Table 3 shows the percentages of municipalities by region in each cluster, and the average income per capita is in parentheses. For example, cluster 1 has a significant number of municipalities from the North, Central-west, Southeast and South. Cluster 2 includes a significant number of municipalities from the North and Northeast. Cluster 3 has mainly municipalities from the Central-west, Southeast and South. But clearly cluster 2 aggregates the poorest municipalities from all regions, the municipalities with the lowest income. It is interesting to note that cluster 1 aggregates not only the most municipalities from the Central-west, Southeast and South, which are the richest regions of Brazil, but also 49% of the richest municipalities in the North region (an underprivileged region in Brazil). This shows that K-means methodology aggregates municipalities independently of regions.
TABLE 3
pERcEntaGE of municipalitiEs By REGion foR EacH clustER anD tHE AVERAGE INCOME PER CAPITA
CLUSTERS NORTH NORTHEAST CENTRAL-WEst SOUTHEAST SOUTH
Cluster1
Municipalities (%) 49.0 12.0 63.0 73.0 59.0
Average income
per capita (R$) 414.4 331.5 591.5 586.8 703.9
Cluster2
Municipalities (%) 47.0 88.0 11.0 13.0 21.0
Average income per
capita (R$) 302.4 271.1 555.5 543.4 652.6
Cluster3
Municipalities (%) 4.0 1.0 26.0 14.0 20.0
Average income per
capita (R$) 396.3 418.3 577.2 669.3 771.7
source: author’s elaboration.
After applying DEA model for the three clusters, Figure 1 shows the percentages of municipalities by efficiency score for each cluster. For example, in cluster 1, 1% of the municipalities are benchmarks (with an efficiency score of 100%), 12% have an efficiency score between 80% and <100%, 53% have an efficiency score between 65% and <80%, and 33% have an efficiency score that is less than 65%. Clearly, cluster 2 has the least efficient municipalities and includes 43% of the municipalities with an efficiency score that is less than 65%, whereas cluster 3 has the largest number of efficient municipalities and comprises 31% of the municipalities with an efficiency score between 80% and 100%.
Maria Cris
tina Gr
amani
CADERNO
S DE PESQUIS
A v
.4
7 n.
164 p
.4
7
0-4
9
3 abr
./jun. 20
17
4
87
FIGURE 1
pERcEntaGE of municipalitiEs By EfficiEncy scoRE
source: author’s elaboration.
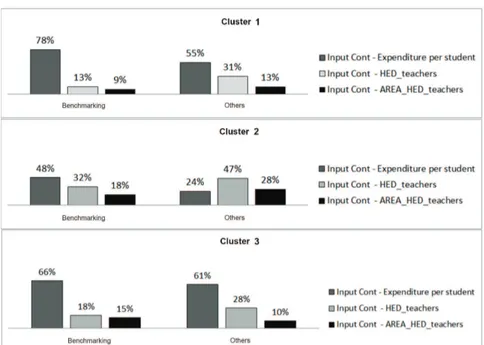
Figure 2 summarizes the weights that the DEA model generates for each input variable. When its weight is greater, the variable’s contribution to educational efficiency is greater. This variable is thus denoted as the efficiency determinant. We analyze the weights by considering two groups. The first group includes the benchmarks (the municipalities that are considered benchmarks for 20 or more other municipalities), and the second group aggregates the remaining municipalities.
FIGURE 2
input contRiButions (WEiGHts in pERcEntaGE) fRom tHE DEa moDEl
source: author’s elaboration.
DOES SOCIOEC
ONOMIC INEQU
ALITY AFFECT EDUCA
TION MORE IN LES
S WEAL
THY MUNICIP
ALITIES
?
488
CADERNO
S DE PESQUIS
A v
.4
7 n.
164 p
.4
7
0-4
9
3 abr
./jun. 20
17
For example, for the benchmark groups, the expenditure variable stands, mainly for clusters 1 and 3. However, for the group “others”, it is a clear difference among the clusters. As Holmlund, Mcnally and Viarengo (2010), we also found evidence of heterogeneity in the effects of expenditure on educational outcomes, with stronger effects on the most economically disadvantaged cluster. For clusters 1 and 3, the variable of expenditure per capita presents the highest weight; in contrast, for cluster 2, which aggregates the most disadvantaged municipalities, the variable of expenditure per capita receives the lowest weight from the DEA model, i.e., this variable has significant room for improvement in this cluster. Because the Ideb of cluster 2 is in general very low (see Figure 3), these results suggest that some municipalities seem to spend much more, but obtain the same low result as the municipalities that spend less. Clearly, these results suggest that: (i) for the less wealthy municipalities, factors other than expenditure per capita influence Ideb more; (ii) expenditure per capita is not the efficient determinant for the less wealth cluster and; (iii) for the richest municipalities, expenditure per capita is considered an efficient determinant of education.
It is worth noting that the relationship between expenditure on and performance in education has been debated since the well-known case of the work of Hanushek (1986), which found no strong relationship between school expenditures and student performance. Years later, Hedges, Laine and Greenwald (1994) reanalyzed the studies of Hanushek and found the opposite, a positive relationship between dollars spent on education and student performance. But, as suggested by the Department for Education of UK (UNITED KINGDOM, 2014), one reason for the different results in the literature may be the considered student inequalities, such as in the Holmlund, Mcnally and Viarengo (2010) study, in which the effect sizes were higher for disadvantaged children.
FIGURE 3
pERcEntaGE of tHE municipalitiEs WitHin tHE iDEB REsults (iDEB vaRiEs fRom 0 to 10)
source: author’s elaboration.
4
Maria Cris
tina Gr
amani
CADERNO
S DE PESQUIS
A v
.4 7 n. 164 p .4 7 0-4 9 3 abr ./jun. 20 17 4 89
Also, Figure 2 shows that the variable of AREA_HED_teachers delivers the lowest weights for clusters 1 and 3. This finding suggests a potential role for improving municipalities’ results by increasing the number of teachers with higher education degrees in the areas in which they teach (even for cluster 2).
Finally, using the previously computed DEA efficiency scores, I now evaluate the importance of non-discretionary inputs. Table 4 reports the results of the censored normal Tobit regressions for three alternative specifications of equations (7)-(10), as Chart 3 shows, which presents the coefficients that were estimated for each of the three models.
CHART 3
NON-DISCRETIONARY VARIABLES USED IN THE THREE MODELS
VARIABLES MODEL 1 MODEL 2 MODEL 3
Access to sewage systems (%) X X X
Maternal education (%) X X X
Dropout rates (%) X X X
Gini index X X
Illiteracy rate (%) X X
Appropriate level (%) X X
source: author’s elaboration.
TABLE 4
CENSORED NORMAL TOBIT RESULTS
VARIABLES
MODEL 1 MODEL 2 MODEL 3
CLUSTER 1 CLUSTER 2 CLUSTER 3 CLUSTER 1 CLUSTER 2 CLUSTER 3 CLUSTER 1 CLUSTER 2 CLUSTER 3
Access to sewage (%) .024*** (.0057) .011 (.0105) .013 (.0110) .031*** (.0057) .005 (.0101) .021* (.1086) .023*** (.0057) .008 (.0103) .013 (.0110) Maternal education (%) .059* (.0281) .059* (.0264) .165* (.0646) .110*** (.0284) .056* (.0258) .201** (.0647) .075** (.0286) .0621* (.0261) .160* (.0654) Dropout Rates (%) -1.030*** (.0722) -1.185*** (.0535) -1.592*** (.1623) -1.11*** (.0748) -1.26*** (.0554) -1.60*** (.1672) -1.07*** (.0742) -1.26*** (.0560) -1.59*** (.1658) Gini Index -21.619*** (3.4274) 8.551 (4.181) -23.05*** (6.470) -24.14*** (3.5506) 6.325 (4.3285) -22.00** (6.8609) Income .0001 (.00011) .005** (.00017) .004* (.0018) .0004 (.0011) .003 (.0018) .0018 (.00018) .0023 (.0011) .0035 (.0018) .0041* (.0019) Illiteracy rate (%) -.144 (.1275) -.568*** (.0833) -.4902 (.3505) -.010 (.1278) -.592*** (.0849) -.289 (.3530) Appropriate level (%) -.084* (.0404) -.313*** (.0330) .042 (.0740) -.128** (.0405) -.305*** (.0335) -.0135 (.0754) Constant 76.61*** (3.072) 64.01*** (3.321) 72.15*** (6.802) 70.19*** (4.02) 98.72*** (3.464) 56.59*** (8.342) 87.67*** (4.743) 94.32*** (4.587) 74.07*** (9.903) /sigma 9.87 (.143) 10.24 (.162) 10.10 (.306) 9.95 (.144) 10.01 (.158) 10.18 (.309) 9.85 (.142) 10.01 (.158) 10.09 (.306)
LR chi2(6) 424.14 635.41 161.51 389.22 728.14 151.98 435.01 730.27 162.18
Prob > chi2 .0000 .0000 .0000 .0000 .0000 .0000 .0000 .0000 .0000
N 2,425 2,025 569 2,425 2,025 569 2,425 2,025 569
notes: standard errors are in brackets. * significant at the 5% level; ** significant at the 1% level; *** significant at the 0.1% level.
DOES SOCIOEC
ONOMIC INEQU
ALITY AFFECT EDUCA
TION MORE IN LES
S WEAL
THY MUNICIP
ALITIES
?
49
0
CADERNO
S DE PESQUIS
A v
.4
7 n.
164 p
.4
7
0-4
9
3 abr
./jun. 20
17
Independently of clusters and models, Table 4 shows that the coefficients for maternal education and dropout rates are statistically significant, i.e., an increase in maternal education increases educational efficiency, and an increase in dropout rates reduces educational efficiency. These results are expected; many studies link dropout rates to fewer educational achievements, and socioeconomic background and ethnicity are usually cited as factors of dropping out (RUMBERGER, 1995; GOLDSCHMIDT; WANG, 1999). However, in general, income is not statistically significant for all clusters.
In contrast, Table 4 clearly shows significant differences in the effects of the other socioeconomic variables on the three clusters. For the wealthiest cluster (cluster 3), the Gini index is statistically significant, but the variables that are related to the basic factors of education such as illiteracy rate and appropriate level are not statistically significant. Otherwise, for cluster 2 (the poorest cluster), the illiteracy rate and appropriate level are statistically significant, but the Gini index is not. That is, considering the two extremes, the wealthiest cluster and the poorest cluster, the social development indicator (Gini index) is statistically significant for the wealthy cluster and the basic factors of a satisfactory education (illiteracy rate and appropriate level variables) are statistically significant for the poorest cluster. These results suggest that, for the poorest cluster, the main concern is the public policies that reduce the illiteracy rate and increase the rate of students at the fundamental level at the right age; how the municipality is spending the money, not how much it is spending, is important. In the poorest municipalities, a lack of an assertive public policy is much more deeply felt. In addition, this result corroborates the results that were obtained in the first step, that indicated that the municipalities from cluster 2 need better management of expenditure per capita.
CONCLUSIONS
Strong evidence confirms the importance of analyzing educational efficiency by categorizing municipalities into clusters when considering a country with promising economic development but high socioeconomic inequality. The results clearly indicate that, if we consider Brazil as a whole, we will merely obtain an overall educational classification, and many key indicators, such as the basic factors of education, will likely be overlooked.
In addition to the classification of Brazilian municipalities by clusters, in this paper, we propose a two-step educational model. First, this study evaluates the educational efficiency of 5,020 Brazilian municipalities and finds evidence (i) of heterogeneity in the effects of expenditure on educational assessments, similar to Holmlund, Mcnally
4
Maria Cris
tina Gr
amani
CADERNO
S DE PESQUIS
A v
.4
7 n.
164 p
.4
7
0-4
9
3 abr
./jun. 20
17
49
1
and Viarengo (2010), and (ii) that the quality of teachers deserves more attention in the entire country. The second step uses a Tobit regression to estimate the influence of the non-discretionary variables on educational efficiency. The main results suggest that (i) income has no significant influence on outcome, (ii) maternal education and dropout rates have a great influence on all clusters, and (iii) for the wealthier clusters, the Gini index has a great influence on educational outcome, whereas the variables that are related to student evolution in school (illiteracy rate and appropriate level) have no significant influence; but the opposite results occur for the least wealthy cluster.
This last result may be used to compare developed countries with emerging ones. For developed countries, a focus on the variables that are related to the basic factors of a prosperous education, such as the appropriate level and illiteracy rate may not make sense because the public policies already exist and work well, and a possible problem for these countries is related to income inequality (the Gini index). However, for developing and poor countries, the variables that are related to how to manage expenditures and design appropriate public policies deserve much more attention. These results corroborate those of Commander, Davoodi and Lee (1997), for example, who showed that countries with the worst income distribution obtain worse results from their policies with regard to preventing infant mortality and their life expectancy statistics. These results also corroborate those of Miranda and Mendes (2004), which show that this same situation may be occurring in Brazilian municipalities: the municipalities with the worst distribution of income are less able to implement effective social policies.
REfEREncEs
AFONSO, A.; AUBYN, M. St. Cross-country efficiency of secondary education provision: a semi-parametric analysis with non-discretionary inputs. Economic Modelling, v. 23, n. 3, p. 476-491, 2006.
AGASISTI, T. The efficiency of Italian secondary schools and the potential role of competition: a data envelopment analysis using OECD-PISA 2006 data. Education Economics, v. 21, n. 5, p. 520-544, 2013. Available at: <http://www.oecd.org/edu/Brazil_EAG2013%20Country%20Note. pdf>. Access on: 03 may 2017.
AGENCY FOR INTERNATIONAL DEVELOPMENT IN COOPERATION. Health Systems 20/20.
The health system assessment approach: a how-to manual, 2012. Available at: <http://apps.who.int/
medicinedocs/documents/s19838en/s19838en.pdf>. Access on: 03 May 2017.
BRADLEY, S.; JOHNES, G.; MILLINGTON, J. The effect of competition on the efficiency of secondary schools in England. European Journal of Operational Research, v. 135, n. 3, p. 545-568, 2001.
BRYK, A. S.; THUM, Y. M. The effects of high school organization on dropping out: an exploratory investigation. American Educational Research Journal, v. 26, n. 3, p. 353-383, 1989.
CHARNES, A.; COOPER, W. W.; RHODES, E. Measuring the efficiency of decision- making units.
European Journal of Operational Research, Amsterdã, v. 2, n. 6, p. 429-442, 1978.
49
DOES SOCIOEC
ONOMIC INEQU
ALITY AFFECT EDUCA
TION MORE IN LES
S WEAL
THY MUNICIP
ALITIES
?
492
CADERNO
S DE PESQUIS
A v
.4
7 n.
164 p
.4
7
0-4
9
3 abr
./jun. 20
17
CHUDGAR, A.; LUSCHEI, T. National income, income inequality and the importance of schools: a hierarchical cross-national comparison. American Educational Research Journal, v. 46, n. 3, p. 626-58, 2009.
CHUDGAR, A.; SHAFIK, M. N. Family, community, and educational outcomes in South Asia.
Prospects, v. 40, n. 4, p. 517-534, 2010.
COELLI, T. J.; RAO, D. S. P.; O’DONNELL, C. J.; BATTESSE, G. E. An introduction to efficiency and
productivity analysis. 2. ed. New York: Springer Science, 2005.
COMMANDER, S.; DAVOODI, H. R.; LEE, U. J. 1997. The causes of government and the consequences
for growth and well-being. Washington, DC: World Bank, 1997. (Policy, Research working paper,
n. WPS 1785). Available at: <http://documents.worldbank.org/curated/en/375251468766769196/ The-causes-of-government-and-the-consequences-for-growth-and-well-being>. Access on: 03 May 2017.
DRINEAS, P.; KANNAN, R.; MAHONEY, M. W. Fast Monte Carlo algorithms for matrices II: computing a low-rank approximation to a matrix. SIAM Journal on Computing, v. 36, n. 1, p. 158-183, 2006.
DYSON, R. G.; ALLEN, R.; CAMANHO, A. S.; PODINOVSKI, V. V.; SARRICO, C. S.; SHALE, E. A. Pitfalls and protocols in DEA. European Journal of Operational Research, v. 132, n. 2, p. 245-259, 2001.
FERNANDES, R. Índice de Desenvolvimento da Educação Básica (Ideb): metas intermediárias para a sua trajetória no Brasil, estados, municípios e escolas. Brasília, DF: MEC/Inep, 2007. 5 p. Available at: <http://download.inep.gov.br/educacao_basica/portal_ideb/o_que_sao_as_metas/ Artigo_projecoes.pdf>. Access on: 03 May 2017.
FUNDO DAS NAÇÕES UNIDAS PARA A INFÂNCIA – UNICEF. Situação da infância e da adolescência
brasileira em 2009. O direito de aprender: potencializar avanços e reduzir desigualdades. Brasília,
2009. Available at: <http://www.unicef.org/brazil/pt/siab_capitulos.pdf>. Access on: 03 May 2017.
GOLDSCHMIDT, P.; WANG, J. When can schools affect dropout behavior? A longitudinal multilevel analysis. American Educational Research Journal, Thousand Oaks, CA, v. 36, n. 4, p. 715-738, 1999.
HANUSHEK, E. A. The economics of schooling: production and efficiency in public schools.
Journal of Economic Literature, Washington, D.C, v. 24, n. 3, p. 1141-1177, 1986.
HANUSHEK, E. A.; LUQUE, J. A. Efficiency and equity in schools around the world. Economics of
Education Review, Denver, v. 22, n. 5, p. 481-502, 2003.
HAUNER, D. Explaining differences in public sector efficiency: evidence from Russia’s regions.
World Development, Michigan, v. 36, n. 10, p. 1745-1765, 2008.
HEDGES, L. V.; LAINE, R.; GREENWALD, R. Does money matter? A meta-analysis of studies of the effect of different school inputs on student outcomes. Educational Researcher, Thousand Oaks, CA, v. 23, n. 3, p. 5-14, 1994.
HENRIQUEZ, F.; LARA, B.; MIZALA, A.; REPETTO, A. Effective schools do exist: low-income children’s academic performance in Chile. Applied Economics Letters,London, v. 19, n. 5, p. 445-451, 2012.
HOLMLUND, H.; MCNALLY, S.; VIARENGO, M. Does money matter for schools? Economics of
Education Review, Denver, v. 29, n. 6, p. 1154-1164, 2010.
JAIN, A. K. Data clustering: 50 years beyond K-means. Pattern Recognition Letters, v.31, n. 8, p. 651-666, 2010.
JAIN, A. K.; DUBES, R. Algorithms for clustering data. Prentice-Hall, Englewood Cliffs, NJ, 1988.
KIRJAVAINEN, T.; LOIKKANEN, H. A. Efficiency differences of finnish senior secondary schools: an application of DEA and Tobit analysis. Economics of Education Review, Denver, v. 17, n. 4, p. 377-394, 1998.
LEE, V. E.; BURKAM, D. T. Dropping out of high school: the role of school organization and structure. American Educational Research Journal, Thousand Oaks, CA, v.40, n. 2, p. 353-393, 2003.
49
Maria Cris
tina Gr
amani
CADERNO
S DE PESQUIS
A v
.4
7 n.
164 p
.4
7
0-4
9
3 abr
./jun. 20
17
493
LIU, J. S.; LU, L. Y. Y.; LU, W. M.; LIN, B. J. Y. A survey of DEA applications. Omega, v. 41, n. 5, p. 893-902, 2013.
MANCEBON, M. J.; BANDRÉS, E. Efficiency evaluation in secondary schools: the key role of model specification and of ex post analysis of results. Education Economics, London, v. 7, n. 2, p. 131-52, 1999.
MIRANDA, R. N.; MENDES, M. Municípios em extrema pobreza: só dinheiro não resolve. Brasília: Consultoria Legislativa do Senado Federal, 2004 (Textos para discussão, n. 15). Available at: <https://www12.senado.leg.br/publicacoes/estudos-legislativos/tipos-de-estudos/textos-para-discussao/td-15-municipios-em-extrema-pobreza-so-dinheiro-nao-resolve>. Access on: 03 May 2017.
MURILLO, F. J.; ROMÁN, M. School infrastructure and resources do matter: analysis of the incidence of school resources on the performance of Latin American students. School
Effectiveness and School Improvement, London, v. 22, n. 1, p. 29-50, 2011.
NEAL, D. The effects of Catholic secondary schooling on educational achievement. Journal of
Labor Economics, Chicago, v. 15, n. 1, p. 98-123, 1997.
ORGANISATION FOR ECONOMIC CO-OPERATION AND DEVELOPMENT. Education at a glance, 2012. Available at: <https://www.oecd.org/edu/EAG%202012_e-book_EN_200912.pdf>. Access on: 03 May 2017.
ORGANISATION FOR ECONOMIC CO-OPERATION AND DEVELOPMENT. Education at a glance, 2013. Available at: <http://www.oecd-ilibrary.org/education/education-at-a-glance-2013_eag-2013-en>. Access on: 03 May 2017.
PRIMONT, D. F.; DOMAZLICKY, B. Student achievement and efficiency in Missouri schools and the No Child Left Behind Act. Economics of Education Review, Denver, v. 25, n. 1, p. 77-90, 2006.
RASSOULI-CURRIER, S. Assessing the efficiency of Oklahoma public schools: a data envelopment analysis. Southwestern Economic Review,Texas, v. 34, n. 1, p. 131-144, 2007.
RAY, S. C. Resource use efficiency in public schools: a study of Connecticut data. Management
Science, Chicago, v. 37, n. 12, p. 1620-1628, 1991.
RODRÍGUEZ-POSE, A.; TSELIOS, V. Mapping the European regional educational distribution.
European Urban and Regional Studies, Pennsylvania, v. 18, n. 4, p. 358-374, 2011. Available at:
<http://citeseerx.ist.psu.edu/viewdoc/download?doi=10.1.1.1014.1569&rep=rep1&type=pdf>. Access on: 03 May 2017.
RUMBERGER, R. W. Dropping out of middle school: a multilevel analysis of students and schools. American Educational Research Journal, Thousand Oaks, CA, v. 32, n. 3, p. 583-625, 1995.
RUMBERGER, R. W.; PALARDY, G. J. High school performance: test scores, dropout rates, and transfer rates as alternative indicators of high school performance. American Educational
Research Journal, Thousand Oaks, CA, v. 42, n. 3, p. 3-42, 2005.
RUMBERGER, R. W.; THOMAS, S. L. The distribution of dropout and turnover rates among urban and suburban high schools. Sociology of Education, v.73, n. 1, p. 39-67, 2000.
SHAH, A. A practitioner’s guide to intergovernmental fiscal transfers. Washington, DC: World Bank, 2006 (World Bank Policy Research Working Paper, 4039).
SIMAR, L.; WILSON, P. W. Performance of the bootstrap for DEA estimators and iterating the principle. In: COOPER, W.W.; SEIFORD, L. M.; ZHU, J. (Ed.). Handbook on Data Envelopment
Analysis. Boston: Kluwer Academic, 2004. p. 265-298.
TODOS PELA EDUCAÇÃO. Anuário Brasileiro da Educação Básica. São Paulo: Moderna, 2012. Available at: <http://www.todospelaeducacao.org.br/biblioteca/1450/anuario-brasileiro-da-educacao-basica>. Access on: 03 May 2017.
UNITED KINGDOM. Parliament. Department for Education. What impact does school spending have
on pupil attainment? A review of the recent literature. London: Strategic Analysis and Research
Division & Infrastructure Funding and Longitudinal Analysis Division, 2014. Available at: <http://www.parliament.uk/documents/commons-committees/Education/Impact-of-school-spending-on-pupil-attainment.pdf>. Access on: 03 May 2017.
DOES SOCIOEC
ONOMIC INEQU
ALITY AFFECT EDUCA
TION MORE IN LES
S WEAL
THY MUNICIP
ALITIES
?
49
4
CADERNO
S DE PESQUIS
A v
.4
7 n.
164 p
.4
7
0-4
9
3 abr
./jun. 20
17
ULYSSEA, G.; FERNANDES, R.; GREMAUD, A. P. O impacto do Fundef na alocação de recursos para a educação básica. Pesquisa e Planejamento Econômico, Brasília, DF, v. 36, n. 1, p. 109-136, 2006.
UNITED NATIONS. Diverging growth and development. New York: World Economic and Social Survey, 2006.
YANG, Z. Cross system bank branch evaluation using clustering and data envelopment analysis. In: HUANG, D.S. et al. (Ed.). Advanced intelligent computing theories and applications. Berlin, Heidelberg: Springer, 2010. p. 238-245. (Lecture Notes in Computer Science, v. 6215)
MARIA CRISTINA GRAMANI
Insper, São Paulo, São Paulo, Brasil
Received on: SEPTEMBER 2016 | approved for publication on: MARCH 2017