Malnutrition and associated variables in an elderly population of
Criciúma, SC
RITA SUSELAINE VIEIRA RIBEIRO1, MARIA INÊSDA ROSA2, MARY CLARISSE BOZZETTI3
1 Laboratory of Epidemiology, Post-Graduation Program in Health Sciences, Universidade do Extremo Sul Catarinense, Criciúma, SC
2 Laboratory of Epidemiology, Instituto de Pesquisa Translacional em Medicina, Post-Graduation Program in Health Sciences, Universidade do Extremo Sul Catarinense, Criciúma, SC 3 Post-Graduation Program in Epidemiology, Universidade Federal do Rio Grande do Sul, Porto Alegre, RS
Study conducted in the Laboratory of Epidemiology of the Universidade do Extremo Sul Catarinense, Criciúma, SC
Submitted on: 05/20/2010
Approved on: 09/28/2010
Correspondence to:
Maria Inês da Rosa Rua Cruz e Souza, 510 Bairro Pio Correa Criciúma-SC CEP: 88811-550 [email protected]
Conlict of interest: None.
SUMMARY
Objective: Determining malnutrition and associated variables in the elderly. Methods:
A cross-sectional study was conducted among elderly people vaccinated against inluen-za in order to evaluate their nutritional status. Nutritional assessment was performed with the Mini Nutritional Assessment. To verify association of studied variables with the outcome, odds ratios was estimated using multiple logistic regression. Results: A total of 236 elderly patients were recruited. he Mini Nutritional Assessment identiied three patients (1.3%) with malnutrition and 59 (25%) at risk of malnutrition. Factors with a positive association to the outcome were psychological stress or acute disease in the past three months, weight loss (< 3 kg) during the last three months and sores or skin ulcers. On the other hand, consuming two or more servings of fruits or vegetables daily, eating meat, ish or poultry every day and drinking more than three cups of luids per day were negatively associated to malnutrition and risk of malnutrition. Conclusion: he low pre-valence of malnutrition found in this study may be due to the study sample of elderly in-dividuals in good health. Some factors related to a recent health problem (psychological stress or acute disease) seem to be positively associated while regular consumption of luids and certain foods seem to be negatively associated with malnutrition.
Keywords: Elderly; malnutrition; prevalence.
RESUMO
Desnutrição e variáveis associadas em uma população de idosos em Criciúma-SC
Objetivo: Determinar a desnutrição e suas variáveis associadas em idosos. Métodos:
Estudo transversal foi conduzido entre idosos vacinados contra a gripe, a im de medir o seu estado nutricional. A avaliação nutricional foi realizada por meio da Mini Avaliação Nutricional. Para veriicar a associação das variáveis estudadas com o resultado foi esti-mada a odds ratios usando a regressão logística múltipla. Resultados: No total 236 ido-sos foram recrutados. A mini avaliação nutricional identiicou três pacientes (1,3%) com desnutrição e 59 (25%) em risco de desnutrição. Os fatores com uma associação positiva para o resultado foi o estresse psicológico ou doença aguda nos últimos três meses, perda de peso < 3 kg durante os últimos três meses e feridas ou úlceras na pele. Por outro lado, o consumo de duas ou mais porções de frutas ou vegetais ao dia, consumir carne, peixe ou frango todos os dias e beber mais de três xícaras por dia de luidos foram negativa-mente associadas à desnutrição e risco de desnutrição. Conclusão: A baixa prevalência de desnutrição encontrada neste estudo é, provavelmente, devido à amostra estudada de idosos em boa saúde. Alguns fatores como problema de saúde recente (estresse psicoló-gico ou doença aguda) parecem estar positivamente associados a desnutrição e risco de desnutrição, enquanto o consumo regular de luidos e alguns tipos de alimentos parece estar associado negativamente com desnutrição
INTRODUCTION
Despite the high prevalence of malnutrition among el-derly patients, nutritional problems are not yet acknowl-edged by health professionals as a priority for the elderly. he need for nutritional assessments and interventions is particularly crucial in this age group, where incidence of chronic illness is high and a myriad of socioeconomic factors enhance likelihood of malnutrition1.
he nutritional status of the elderly may be inluenced by many factors, including dentition, Alzheimer’s disease, depression, functional limitations, income and polyphar-macy2.Prevalence of malnutrition, which is relatively low in community living elderly (5-10%), is considerably higher (30-60%) in those hospitalized or institutional-ized 3.
he elderly are typically major users of health care services and place a burden on limited health care re-sources. Malnutrition in this age group is associated with serious negative consequences, such as higher prevalence of infections, hospitalization and increased morbidity
and mortality4.Prevalence of malnutrition among the
el-derly living in nursing homes ranges from 17% to 65%5.
Conventional malnutrition assessment techniques clude anthropometrics, dietary recall and laboratory
in-vestigation. he Mini Nutritional Assessment (MNA)6-8
was irst validated in 600 elderly people of varying health status (healthy community-living, frail, or hospitalized). he MNA classiies individuals into three levels of nutri-tional status on the basis of scores that range from 0 to 30. A score of 24 or higher indicates satisfactory nutri-tional status; a score of 17-23.5 indicates risk of malnutri-tion and a score lower than 17 indicates protein energy malnutrition.
he MNA is easy to administer9-11, patient-friendly,
inexpensive (laboratory investigations are not required), very sensitive (96%), highly speciic (98%) and reproduc-ible. A study of geriatric inpatients 9 found that interrater reproducibility is good for scores of 17-23.5 and excellent for scores above and below this range.
he purpose of this study was to estimate the preva-lence of malnutrition and its associated variables in el-variables in el-in el-derly between 60-92 years of age who participated in the campaign of vaccination against inluenza.
METHODS
A cross-sectional study was conducted enrolling the el-derly who participated in the campaign of vaccination against inluenza in the irst half of 2008 in southern Brazil. his campaign is part of a strategy developed for the adhesion of the elderly to inluenza vaccination. he sample size calculation was performed considering a maximum variability of p = 0.4, a conidence interval level equal to 95%, an error of 0.065 and a inite popula-tion (people aged 60 or older in 2007) equal to 12 717
(source: IBGE). We calculated a sample of 236 elderly, chosen randomly in consecutive order with an estimated interval of 10 to 10 elderly vaccinated against inluenza whose nutritional status was assessed by questionnaires including demographic data administered by trained ieldworkers.
MINI NUTRITIONAL ASSESSMENT
Baseline nutritional status was deined and graded ac-cording to the MNA. his instrument consists of eigh-teen questions in four groups addressing anthropometry (BMI, weight loss, mid-upper arm and calf circumfer-ences), general state (medications, mobility, presence of pressure ulcers, lifestyle, presence of psychological stress or neuropsychological problems), dietary as-sessment (autonomy of feeding, quality and number of meals, luid intake) and self-perception about health and nutrition. When all items are completed, a maxi-mal score of thirty points is achievable and threshold values are set as follows: adequately nourished, MNA ≥ 24; at risk of malnutrition, MNA in the range of 17-23.5; protein-energy malnutrition, MNA, < 178-12 .
ANTHROPOMETRICMEASUREMENTS
All anthropometric measurements were taken in dupli-cate by trained interviewers and an average of the two measurements was calculated. Height was recorded using a stadiometer and weight was recorded on a calibrated scale to the nearest 100 g. BMI was calculated as weight (kilograms) divided by height (meters) squared and clas-siied according to World Health Organisation catego-ries13. Calf circumference was measured to the nearest 0.5 cm at the largest circumference of the calf with the knee
and ankle bent at 90-degree angles13. Mid-arm
circum-ference (MAC) was measured as the circumcircum-ference of the right upper arm (centimeters).
STATISTICALANALYSIS
Data are presented as mean values and standard deviations. To verify the association of categorical variables with the outcome i.e. malnutrition and risk of malnutrition deined by MNA, the chi-square test (or Fishers exact, when indi-the chi-square test (or Fishers exact, when indi-cated) were applied. he Student’s t test or Mann-Whitney test was used for continuous variables. All results with p < 0.15 in univariate analysis and/or with clinical/epide-miological relevance for the study were selected for the logistic regression model. All variables associated to the outcome with p< 0.05 remain in the inal model. Analy- Analy-sis was performed using SPSS sotware (version 17.0).
RESULTS
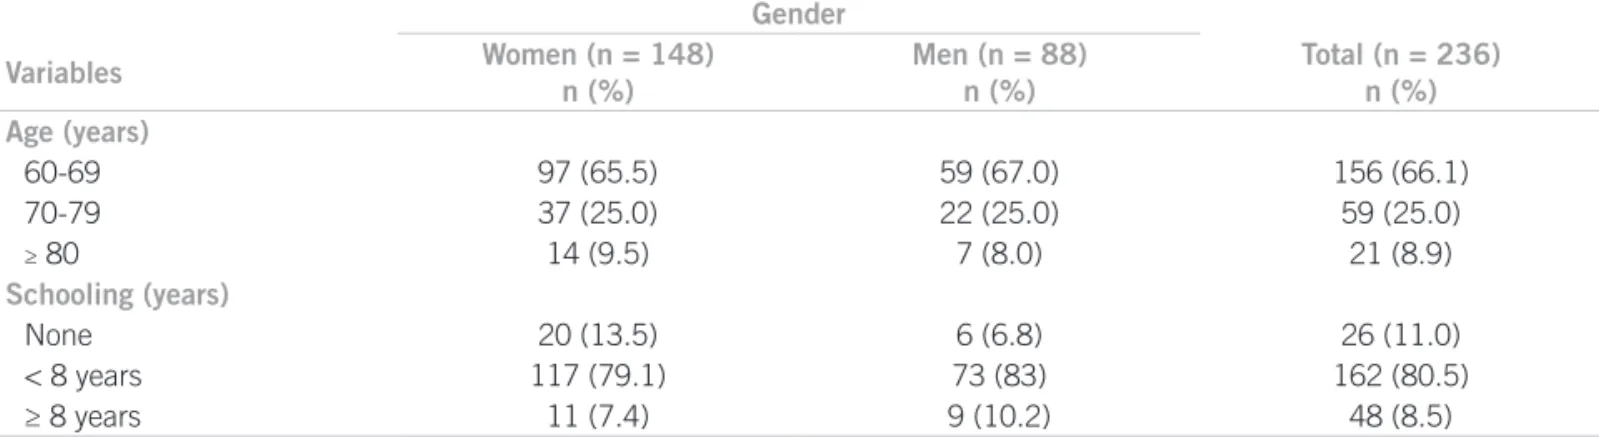
A total of 236 elderly patients (37.3% male and 62.7% female) were recruited. he overall mean age was 68.0 (± 7.0) years (range 60-92 years). he age group with the largest number of individuals was the 60-69 years group (66.1%), followed by the 70-79 years group (25.0%). Re-garding educational status, 11.0% had never gone to school, 20.4% had eight or more years of schooling.
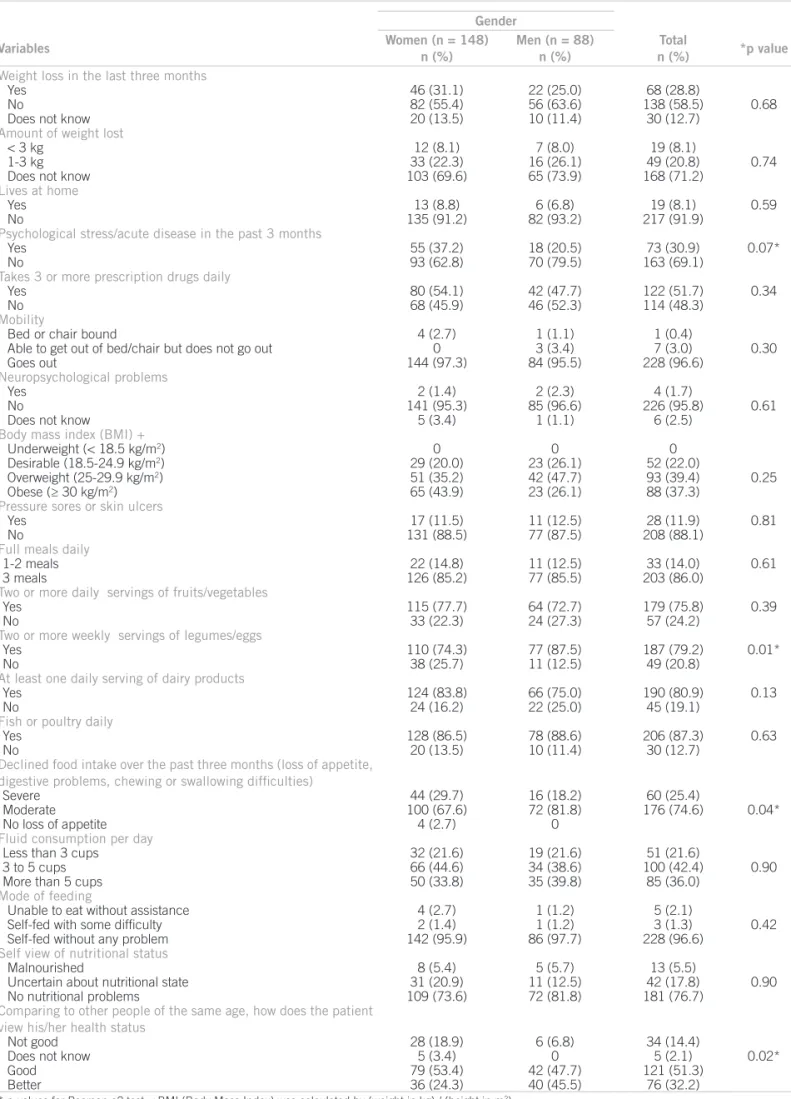
Anthropometric measurements showed that the age groups present a statistically signiicant diference between women and men regarding weight, height, BMI, calf circumference and MNA score. For each age group, men were taller (p < 0.001); the 60-69 group was heavier (p = 0.04); and in the 70-79 year group, men had a higher average MNA score than women (p = 0.05). In the 60-69 year group, women had greater calf circumference (p = 0.04) and BMI (p = 0.02) (Table 1). No statistical dif-ferences were found between genders in mid-arm
cir-cumferenceof any age group. he distribution of MNA
responses, stratiied by gender is shown in Table 2. BMI was used to classify participants as malnour-ished, overweight or obese. Most women (43.9%) were obese and an additional 35.2% were overweight. Most men (47.7%) were overweight, while 26.1% had BMI in the desirable range for health and an additional 26.1%
were obese. None had a BMI of 18.5 kg/m2 or less (i.e.,
underweight).
Incomplete responses to items in the MNA score resulted in missing data for ive subjects. Mean MNA scores and SD were calculated for men (25.6 ± 2.6, range 15-30) and women (24.8 ± 2.8, range 16-30). Considering both genders together, 27.7 percent of participants were in the “at risk of malnutrition” category (i.e., 17-23.9). Three subjects were classified as malnourished (i.e., MNA score < 17).
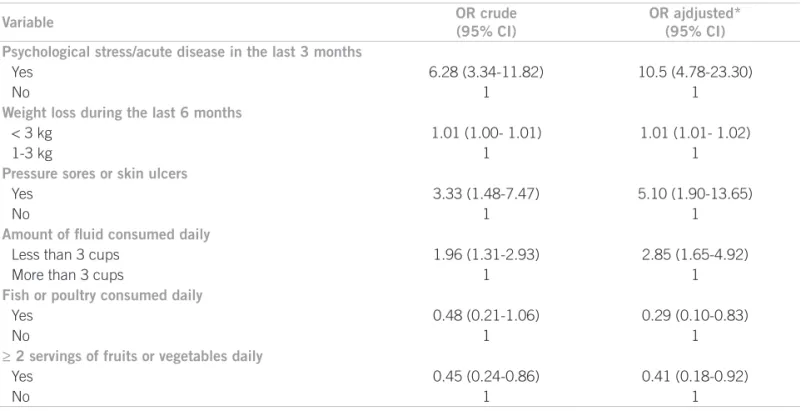
In univariate analyses, many variables were associat-ed with the outcome (malnutrition and risk of malnutri-tion), whereas upon adjustment for confounding factors through a logistic regression model the following factors showed signiicant association to the outcome: “psycho- psycho-logical stress or acute disease in the past three months”,
weight loss (< 3 kg) during the last three months and sores or skin ulcers. On the other hand, factors that nega-tively associated to malnutrition and risk of malnutrition were: consuming two or more servings of fruits or veg-etables per day, eating meat, ish or poultry every day and drinking more than three cups of luid per day (Table 3).
DISCUSSION
In both, clinical practice and epidemiology, BMI is the most used indicator of individual and collective general nutritional status. In this study, malnutrition was determined using the BMI (< 18.5) and MNA (< 17) scores. Malnutrition was not observed in terms of BMI scores, whereas by MNA it was observed in 1.3% of the studied population. Some authors have indicated that BMI thresholds should be modiied for the elderly popu-lation. Sergi et al.16 recommended a BMI < 20.0 as the threshold for malnutrition among the elderly. Using this criterion, our study included a single elderly individual with malnutrition (0.4%). Prevalence of malnutrition observed in this study is lower than in other studies17,18, perhaps because it included only elderly people who came to a healthcare unit for vaccination against inlu-enza and excluded the elderly hospitalized population.
Studies in elderly hospitalized populations have shown a higher percentage of malnutrition and weight loss a month prior to hospital admission. hus, weight loss and malnutrition may increase the risk of hospital admission17,18.
In most previous studies of malnutrition screening tools, investigators did not use multivariate techniques to assess the weighted efects of the variables of interest19. In the present investigation, logistic regression analysis was used to identify the most signiicant variables associ-ated to malnutrition and then this item was incorporassoci-ated to the screening process.
Prevalence of malnutrition, which is relatively low in community living elderly (5 ± 10%), is considerably higher (30 ± 60%) in hospitalized or institutionalized elderly 18.
Recently, Saletti et al.20 completed a study of 994 elderly persons in assisted living situations. hey found that the
Gender
Variables Women (n = 148)
n (%)
Men (n = 88) n (%)
Total (n = 236) n (%)
Age (years)
60-69 97 (65.5) 59 (67.0) 156 (66.1)
70-79 37 (25.0) 22 (25.0) 59 (25.0)
≥ 80 14 (9.5) 7 (8.0) 21 (8.9)
Schooling (years)
None 20 (13.5) 6 (6.8) 26 (11.0)
< 8 years 117 (79.1) 73 (83) 162 (80.5)
≥ 8 years 11 (7.4) 9 (10.2) 48 (8.5)
Gender
Variables Women (n = 148)
n (%)
Men (n = 88) n (%)
Total
n (%) *p value
Weight loss in the last three months
Yes 46 (31.1) 22 (25.0) 68 (28.8)
No 82 (55.4) 56 (63.6) 138 (58.5) 0.68
Does not know 20 (13.5) 10 (11.4) 30 (12.7)
Amountofweightlost
< 3 kg 12 (8.1) 7 (8.0) 19 (8.1)
1-3 kg 33 (22.3) 16 (26.1) 49 (20.8) 0.74
Does not know 103 (69.6) 65 (73.9) 168 (71.2)
Lives at home
Yes 13 (8.8) 6 (6.8) 19 (8.1) 0.59
No 135 (91.2) 82 (93.2) 217 (91.9)
Psychological stress/acute disease in the past 3 months
Yes 55 (37.2) 18 (20.5) 73 (30.9) 0.07*
No 93 (62.8) 70 (79.5) 163 (69.1)
Takes 3 or more prescription drugs daily
Yes 80 (54.1) 42 (47.7) 122 (51.7) 0.34
No 68 (45.9) 46 (52.3) 114 (48.3)
Mobility
Bedor chair bound 4 (2.7) 1 (1.1) 1 (0.4)
Able to get out of bed/chair but does not go out 0 3 (3.4) 7 (3.0) 0.30
Goes out 144 (97.3) 84 (95.5) 228 (96.6)
Neuropsychological problems
Yes 2 (1.4) 2 (2.3) 4 (1.7)
No 141 (95.3) 85 (96.6) 226 (95.8) 0.61
Does not know 5 (3.4) 1 (1.1) 6 (2.5)
Body mass index (BMI) +
Underweight (< 18.5 kg/m2) 0 0 0
Desirable (18.5-24.9 kg/m2) 29 (20.0) 23 (26.1) 52 (22.0)
Overweight (25-29.9 kg/m2) 51 (35.2) 42 (47.7) 93 (39.4) 0.25
Obese (≥ 30 kg/m2) 65 (43.9) 23 (26.1) 88 (37.3)
Pressure sores or skin ulcers
Yes 17 (11.5) 11 (12.5) 28 (11.9) 0.81
No 131 (88.5) 77 (87.5) 208 (88.1)
Full meals daily
1-2 meals 22 (14.8) 11 (12.5) 33 (14.0) 0.61
3 meals 126 (85.2) 77 (85.5) 203 (86.0)
Two or more daily servings of fruits/vegetables
Yes 115 (77.7) 64 (72.7) 179 (75.8) 0.39
No 33 (22.3) 24 (27.3) 57 (24.2)
Two or more weekly servings of legumes/eggs
Yes 110 (74.3) 77 (87.5) 187 (79.2) 0.01*
No 38 (25.7) 11 (12.5) 49 (20.8)
At least one daily serving of dairy products
Yes 124 (83.8) 66 (75.0) 190 (80.9) 0.13
No 24 (16.2) 22 (25.0) 45 (19.1)
Fish or poultry daily
Yes 128 (86.5) 78 (88.6) 206 (87.3) 0.63
No 20 (13.5) 10 (11.4) 30 (12.7)
Declined food intake over the past three months (loss of appetite,
digestive problems, chewing or swallowing dificulties)
Severe 44 (29.7) 16 (18.2) 60 (25.4)
Moderate 100 (67.6) 72 (81.8) 176 (74.6) 0.04*
No loss of appetite 4 (2.7) 0
Fluid consumption per day
Less than 3 cups 32 (21.6) 19 (21.6) 51 (21.6)
3 to 5 cups 66 (44.6) 34 (38.6) 100 (42.4) 0.90
More than 5 cups 50 (33.8) 35 (39.8) 85 (36.0)
Mode of feeding
Unable to eat without assistance 4 (2.7) 1 (1.2) 5 (2.1)
Self-fed with some dificulty 2 (1.4) 1 (1.2) 3 (1.3) 0.42
Self-fed without any problem 142 (95.9) 86 (97.7) 228 (96.6)
Self view of nutritional status
Malnourished 8 (5.4) 5 (5.7) 13 (5.5)
Uncertain about nutritional state 31 (20.9) 11 (12.5) 42 (17.8) 0.90
No nutritional problems 109 (73.6) 72 (81.8) 181 (76.7)
Comparing to other people of the same age, how does the patient
view his/her health status
Not good 28 (18.9) 6 (6.8) 34 (14.4)
Does not know 5 (3.4) 0 5 (2.1) 0.02*
Good 79 (53.4) 42 (47.7) 121 (51.3)
Better 36 (24.3) 40 (45.5) 76 (32.2)
* p-values for Pearson c2 test; +BMI (Body Mass Index) was calculated by (weight in kg) / (height in m2)
MNA score was below 17 in 21% of individuals in service, 33% of those living in retirement homes, 38% of those in group living homes for dementia suferers and 71% of those in nursing homes. A study in Switzerland of 166 hos-pitalized patients older than 70 years of age showed that admission MNA scores below 17 correlated with mean hospital stays that were 10 days longer than those of indi-viduals with MNA scores higher than 17 at admission21 .
In the inal model, variables that conferred a positive association with malnutrition were: a worse state of health as compared to others, loss of appetite and loss of more than 3 kg during the last three months, indicating that rel-ative health status and weight loss in the elderly should be warning signs for health professionals.
It seems that elderly individuals should be encouraged to consume meat, fruits and vegetables and drink at least three glasses of liquid daily since these factors seem to be negatively associated to malnutrition or risk of malnutrition.
he number of older adults in the world is growing both in absolute and relative terms. Good nutrition seems to play a crucial role in maintaining the elderly healthy. Older adults oten have health problems that can lead to decreased appetite or trouble eating, such as chronic illness, use of certain medications, trouble chewing due to dental issues, problems swallowing or diiculty to absorb nutrients. A re-cent hospitalization may be accompanied by loss of appetite or other nutrition problems. In other cases, a diminished sense of taste and smell decreases appetite.
Research eforts and nutrition education strategies should be directed towards health of the elderly to develop nutritional guidelines promoting successful aging.
Weight loss in the elderly is clearly a prevalent and complex problem. It is associated with increased risk of morbidity and mortality and therefore merits serious at-tention by the attending physician. Patients who are identi-ied as high risk require immediate intervention, including medical and psychological evaluations. Although such diagnostic uncertainty may be troubling, the prognosis in most cases is surprisingly good. Appropriate social and psychological support is necessary and until more is known about the efective treatment of this problem, practical approaches that improve caloric intake should be envisaged 22,23.
CONCLUSION
Although the low prevalence of malnutrition found in this study is probably due to the studied sample of elderly in-dividuals in good health, some factors related to a recent health problem (psychological stress or acute disease) seem to be positively associated to malnutrition, while regular consumption of luids and certain foods seem to be nega-tively associated to this outcome.
CONTRIBUTORS
RSVB organized the study, collected the data and helped drat the article. MIR and M.C.B. did the statistical, inter-preted the data and drated the manuscript.
REFERENCES
1. Pepersack T. Nutritional problems in the elderly. Acta Clin Belg. 2009; 64:85-91.
2. McGee M, Jensen GL. Nutrition in the elderly. J Clin Gastroenterol. 2000; 30:374-8.
Variable OR crude
(95% CI)
OR ajdjusted* (95% CI) Psychological stress/acute disease in the last 3 months
Yes 6.28 (3.34-11.82) 10.5 (4.78-23.30)
No 1 1
Weight loss during the last 6 months
< 3 kg 1.01 (1.00- 1.01) 1.01 (1.01- 1.02)
1-3 kg 1 1
Pressure sores or skin ulcers
Yes 3.33 (1.48-7.47) 5.10 (1.90-13.65)
No 1 1
Amount of luid consumed daily
Less than 3 cups 1.96 (1.31-2.93) 2.85 (1.65-4.92)
More than 3 cups 1 1
Fish or poultry consumed daily
Yes 0.48 (0.21-1.06) 0.29 (0.10-0.83)
No 1 1
≥ 2 servings of fruits or vegetables daily
Yes 0.45 (0.24-0.86) 0.41 (0.18-0.92)
No 1 1
*Adjusted for age and gender and for all other variables in the model.
3. Rush D. Nutrition screening in old people: its place in a coherent practice of preventive health care. Ann Rev Nutr. 1997; 17:101-25. 4. Sullivan DH, Patch GA, Walls RC, Lipschitz DA. Impact of
nutri-tion status on morbidity and mortality in a select populanutri-tion of geriatric rehabilitation patients. Am J Clin Nutr. 1990; 51:749-58. 5. Morley JE, Silver AJ. Nutritional issues in nursing home care. Ann
Intern Med. 1995; 123:850 -9.
6. Guigoz Y, Vellas B. Assessing the nutritional status of the elderly: the Mini Nutritional Assessment as part of the geriatric evaluation. Nutr Rev. 1996; 54(Suppl 2):S59-S65.
7. Guigoz Y, Vellas B, Garry P. Mini Nutritional Assessment: a practi-cal tool for grading the nutritional state of elderly patients. Facts re-search and intervention in geriatrics. In: Vellas BJ, Guigoz Y, Garry
PJ, Albarède JL, editors. Nutrition in the elderly. 3rd ed. he Mini
Nutritional Assessment (MNA); 1997: 15-60.
8. Vellas B, Guigoz Y, Garry P. he mini nutritional assessment (MNA) and is use in grading the nutritional state of elderly pa-tients. Nutrition. 1999; 15:116-22.
9. Gazzotti C, Pepinster A, Petermans J, Albert A. Interobserver agreement on MNA nutritional scale of hospitalized elderly pa-tients. J Nutr Health Aging. 1997; 1:23-7.
10. Compan B, Dicastri A, Plaze JM, Arnaud-Battandier F. Epidemio-logical study of malnutrition in elderly patients in acute, sub-acute and long-term care using the MNA. J Nutr Health Aging. 1999; 3:146-51.
11. Rubenstein LZ. Comprehensive Geriatric Assessment (CGA) and the MNA: an overview of CGA , nutritional assessment and development of a shortened version of the Mini Nutritional Assessment. In: Vellas B, Garry PJ, Guigoz Y, editors. Mini Nutritional Assessment (MNA): research and practice in elderly. Nestlé clinical and performance nutri-tion workshop series, vol 1. Basel: Karger; 1999. v.1, p.101-16. 12. Guigoz Y. he Mini Nutritional Assessment (MNA) review of the
literature - what does it tell us? J Nutr Health Aging. 2006; 10:466-87.
13. World Health Organization. Obesity: preventing and managing the global epidemic. Report on a consultative meeting. Geneva: World Health Organization; 1997.
14. Patrick JM, Bassey EJ, Fentem PH. Changes in body fat and muscle in manual workers at and ater retirement. Eur J Appl Physiol Occup Physiol.1982; 49:187-96.
15. Conceição J. Study of the anthropometric indicators among a popu-lation of 224 elderly subjects living in a retirement home. Ann Ger-ontol. 1993; 23:26-34.
16. Sergi G, Perissinotto E, Pisent C, Buja A, Maggi S, Coin A, et al. An
adequate threshold for body mass index to detect underweight con-dition in elderly persons: the Italian Longitudinal Study on Aging (ILSA). J Gerontol A Biol Sci Med Sci. 2005; 60:866-71.
17. Mowe M, Bohmer T, Kindt E: Reduced nutritional status in an elderly population (> 70 y) is probable before disease and possibly contributes to the development of disease. Am J Clin Nutr. 1994; 59:317-24. 18. Rush D. Nutrition screening in old people: its place in a coherent
practice of preventive health care. Ann Rev Nutr. 1997; 17:101-25. 19. Jones JM. he methodology of nutritional screening and assessment
tools. J Hum Nutr Diet. 2002; 15:59 -71
20. Quadri P, Fraggiacomo C, Pertoldi W, Guigoz Y, Herrmann F, Rapin CH. MNA and cost of care. In: Mini Nutritional Assessment (MNA): research and practice in elderly. Nestle. A clinical and performance nutrition workshop series. Basel: Karger; 1999. v.1, p.141-9. 21. Saletti A, Lindgren EY, Johansson L, Cederholm T. Nutritional status
according to Mini Nutritional Assessment in an institutionalized el-derly population in Sweden. Gerontology. 2000; 46:139-45. 22. Moriguti JC, Moriguti EKU, Ferriolli E, Cação JC, Lucif Junior N,
Marchin JS. Involuntary weight loss in elderly individuals: assess-Involuntary weight loss in elderly individuals: assess-ment and treatassess-ment. São Paulo Med J. 2001; 119(2):72-7.