1. School of Physical Education of the M ato Grosso Federal University. 2. Laboratory of M ass Spectrometry, Nutrology Division – M edical Clinic
Department of the School of M edicine – São Paulo University, Av. Ban-deirantes, 3.900 – 14049-900 – Ribeirão Preto, SP, Brazil.
Received in 24/9/04. Final version received in 29/8/05. Approved in 8/9/05.
Correspondence to: Carlos Alexandre Fett, Av. Fernando Correa da Cos-ta, s/n, Cidade Universitária, Ginásio de Esportes – 78060-900 – Cuiabá, M T, Brazil. E-mail: [email protected]
Body composition and somatotype in overw eight and
obese w omen pre- and post-circuit training or jogging
Carlos Alexandre Fett1, Waléria Christiane Rezende Fett2, Sandra Regina Oyama2 and Julio Sérgio M archini2
O
RIGINALA
RTICLEKeyw ords: Endomorphy. M esomorphy. Ectomorphy. Bio-impedance. 1-M R.
ENGLISH VERSION
ABSTRACT
Purposes: To compare different assessment methods of the body composition in overw eight and sedentary obese w omen sub-mitted to tw o months of circuit training (CIRC) or Jogging (JOGG) and to associate the physical performance to the muscular index calculated using tw o methods. M ethods: Groups: CIRC, n = 14, body mass index (BDI, kg/m2) = 32 ± 8 (mean ± SD; age = 34 ± 10
years; and JOGG, n = 12, BM I = 30 ± 3; age = 38 ± 11. Training: 60 min. x 3d/w eek in the first month, and 60 min. x 4d/w eek in the second month. Assessment of the body composition:
anthropom-etry(1,2), bio-impedance(3), and somatotype(4). It w as performed one
maximal repetition test (1-M R) to the bench press, leg press and low -seated row ing exercises. Results: The mass, the BM I, the body fat percentage by the anthropometry and bio-impedance, and the endomorphy w ere significantly reduced in both groups. The mesomorphy had a decrease, and the ectomorphy increased in the JOGG. The bio-impedance slim and muscular mass did not change in both groups. The muscular circumference of the arm (M CA) had a significant increase in the CIRC. The result of the bio-impedance fat percentage and the anthropometry w ere the same and significantly correlated. The endomorphy w as significantly cor-related to the anthropometry fat percentage, and to the mesomor-phy to the slim mass anthropometry. The ectomormesomor-phy w as not correlated to the slim mass of the anthropometry. Conclusion: The somatotype had a good result to assess the phenotypical changes in obese w omen submitted to the training. Nevertheless, the endomorphy presented the best concordance, and the ecto-morphy had the w orst one compared to other methods. The re-sults of the somatotype suggest that the CIRC attained the best result into this group. The bio-impedance and the anthropometry produced similar results to assess the body composition.
INTRODUCTION
The morphologic classification of men has a scientific and gen-eral interest since the times of Hypocrates, that is, around 400 b.C. The major part of the first methods w as not satisfactory, di-viding the population from tw o to five different categories. It w as not easy to separate one from another, since few persons had a clear idea to w hich group they belonged to(5). In 1921, M atiegka
proposed the first systematic anthropometric human classifica-tion through the quantificaclassifica-tion of the body tissues of a sampling composed by barbers, butchers, smiths, and gymnastic instruc-tors.
Later, other physical descriptions w ere elaborated and it w as denominated somatotype by Sheldon and colleagues in 1940, Par-nell in 1954, and that classification w as review ed and modified by Heath and Carter in 1967(6). The somatotype consists in three
com-ponents: the endomorphy, w hich is the greasy component; the mesmorphy, w hich is related to the muscular component and pre-sents the solidity and “ square” body aspect, and the ectomorphy in w hich it predominates the linearity and the fragility of the body(7).
An important concept to the fitness and aesthetics, similar to the w eight-lifting sportive modality is the symmetry and propor-tionality added to the muscular definition(8). The fat percentage or
the body mass index (BM I, kg/m2) calculations, for instance, do
not define the body fat or the slim mass distribution, and this does not allow define the above mentioned concepts. The somatotype is a form measurement instead of the size, presuming that adults w ith different body sizes are geometrically similar, that is, sym-metrical and proportional, and they are best fitted to assume such role(6).
The somatotype is a description composed by the individual’s physique, and it is defined by a set of components(9).
Neverthe-less, it w as observed that the circumference of the athletes’ thigh compared to the control individuals had a higher increase than that predicted by the body’s geometrical similarity proportional to the mass(6). Furthermore, generally, the endurance athlete has an
increased body density, appendiceal muscular mass and reduced cutaneous folds compared to non-athlete individuals w ith the same w eight. The physical aerobic activities have a predominant effect on the fat catabolism w ith little muscular improvement(7,10).
There-fore, the result of different interventions can be a specific body improvement that reflects not only the global increase or decrease in a proportional and geometrically distributed w ay.
On the other hand, the body composition is capable to perform the evolution assessment aside from the slim and fat mass. Re-sisted exercises stimulate the muscular improvement(11),
confound-ing the reduction of the body fat in the body mass appraisal. The general anthropometric formulas to calculate the body composi-tion are more comprising, and those for specific populacomposi-tions are more accurate(12). How ever, Pollock et al.(1,13) have developed
equa-tions for both genders w ith age adjustments, and it is used in big populations w ith a quite high accuracy index. Other studies have show n the significant relationship betw een generic equations and the result of the doubled scanning X-Ray (DEXA)(14,15). The
bio-im-pedance has also show n a good relationship to estimate the slim body mass comparing to the hydrostatic w eighing(3).
M ETHODS
Volunteers: The study started w ith forty-three 25 to 57 BM I w omen, no records of metabolic diseases except the ow n obesi-ty, no orthopedic limitations, sedentary, and clinically examined by a physician. Next, they w ere randomly divided in tw o groups, and after some discontinuances, it remained in the study the fol-low ing data: CIRC, n = 14, BM I = 32 ± 8 (mean ± SD); age = 34 ± 10 years; and, JOGG, n = 12, BM I = 30 ± 3; age = 38 ± 11. As the groups had a random formation, there w as a certain difference on their age and BM I.
It w as 60 min x 3 d/w eek training in the first month, and 60 min. x 4 d/w eek training in the second month. The CIRC consisted of fifteen 30sec. resisted exercise stations intercalated by 30 sec. jogging/trotting repeated for 40-45 min. The jogging w as a 45 min. w alking, and the remaining 15 min. w ere used in the w arm up and cooling in both groups. The nutritional guidance w as to consume similar daily caloric amounts than in the energetic resting expendi-tures, measured through indirect calorimetry containing 20% pro-teins, 20% fat, and 60% carbohydrates. Every volunteer signed a free and clarified consent term approved by the Human Research Ethics Committee from the second institution listed in the first page of this paper.
Anthropometric assessment: Every anthropometric assess-ment w as made using the conventional techniques described by Pollock et al.(13). It w as evaluated the total body mass (kg) and the
height (cm) by means of a type ID 1500 Electronic platform scale Fillizola® (São Paulo, SP, Brazil) w ith 0.1 kg and 0.5 cm accuracy, respectively.
To measure the cutaneous folds, it w as used a Lange® 10 g/ mm2 constant pressure on the contact surface, 1 mm accuracy
and 0-65 mm scale adipometer (Beta Technology Inc., Santa Cruz, CA, USA) w ith. The recorded value w as the mean taken from three consecutive measurements. The body density w as calculated by the three cutaneous fold equations for w omen, corrected by their age(1):
1) DC = 1,0994921 – (0,0009929 x X) + (0,0000023 x X2) – (0,0001392 x Y)
w here: DC = body density (g/ml); X = sum of the triceps cutane-ous, suprailiac and thigh folds in mm; Y = age in years.
The percentage of fat w as attained from the DC calculation(2):
2) % G = [(4,95 / DC) – 4,5] x 100
w here: %G = fat percentage calculated from the anthropometric variables; DC = body density (see 1 above).
The fat body mass can be attained from the follow ing formula:
3) M G = (M x G) / 100
w here: M G = fat body mass (kg) calculated from anthropometric variables; M = body mass (kg); G = fat percentage by the anthro-pometry (see 2 above).
The slim mass w as attained by the subtraction of the fat mass from the total mass.
Circumferences (cm): extended arm, forearm, w rist, neck, w aist, abdomen, hip, thigh and calf. It w as used a flexible inextensible metallic tape w ith 0.1 cm accuracy, according to conventional tech-niques(13).
The muscular circumference of the arm and thigh w ere calcu-lated by the follow ing formula:
4) CM B ou CM C = A – (B x π)
w here: CM B or CM C = muscular circumference of the arm and thigh, respectively (cm); A = circumference of the arm or the thigh (cm); B = cutaneous fold from the triceps or the thigh (cm).
The muscular area of the arm w as calculated by an equation developed through multi-varied analysis of the variance, having as golden standard the computerized tomography(16):
5) AM B = 1,403 x CM B
w here: AM B = muscular area of the arm (cm2); CM B = muscular
circumference of the arm (cm) (see 4 above).
The body muscular mass w as calculated from anthropometric measurements, according to the follow ing equation modified from M artin et al.(17):
6) M M u = [E x (0,0553 x A2 + 0,0987 x B2 + 0,0331 x C2) – 2445] x 1000
w here: M M u = muscular mass (kg); E = height (cm); A = muscular circumference of the thigh (cm).
7) A = CC – π x PCC;
w here, CC = circumference of the thigh (cm); PCC = cutaneous fold of the thigh (cm); B = maximal circumference of the forearm (cm), and; C = muscular circumference of the calf (cm).
8) C = CP – π x PCP;
w here, CP = circumference of the calf (cm); and PCP = cutaneous fold of the calf (cm).
This is an equation intended to be used for men, and it w as found no equation aiming this variable for w omen. It might be some error in the appraisal due to differences betw een genders. Nevertheless, the intra-individual comparison as to the effects of the physical activity on the muscular mass must remain valid.
Bone diameter assessed (cm): humeral biepicondyle having the elbow in a 90o angle flexion and the pachymeter’s shafts in a 45o
angle related to the joint; and the femoral bicondyle assessed in the seated positioning at a 90o angle in the knee joint w ith the
equipment in a 45o angle.
The somatotype w as calculated from the anthropometry using the below show n formulas adapted from Heath and Carter(4) by
Brito et al.(18):
9) Endo = –0,7897977038 + 0,1506850093 x (ΣPC x 10) – 7,24011 x 10(-4) x (ΣPC x 10)2 + 2,02696 x 10(-7) x (ΣPC x 10)3 + 1,50939 x
10(-8) x (ΣPC x 10)4 – 4,42939 x 10(-11) x (ΣPC x 10)5
w here: Endo = endomorphic component of the somatotype; ΣΣΣΣΣPC
= sum of the triceps, subscapular, and suprailiac cutaneous folds.
10) M eso = 4 + (4,961390196 + 6,866194747 x BEU x 4,796637252 x BCF + 1,490130181 x (CB – PCT / 10) + 1,274233697 x (CP – PCPan / 10) – 104,961949677 x E) / 8
w here: M eso = mesomorphic component of the somatotype; BEU
= humeral biepicondyle diameter (cm); BCF = bicondyle femoral
diameter (cm); CB = circumference of the arm (cm); PCT = cuta-neous fold of the triceps (cm); CP = circumference of the calf (cm); PCP = cutaneous fold of the calf (cm); E = height (m).
11) Ecto = 73,2043628 x (E / M1/3) – 28,56
w here: Ecto = ectomorphic component of the somatotype; E = height (m); M = body mass (kg).
Note: if the result of the above formula is < 0, the value of the ectomorphy is 0.5; in the event the result is > 0, the value of the ectomorphy is the result attained by the formula.
Bio-impedance: The bio-impedance w as performed using a Quantum BIA-101Q device (RJL Systems, Inc. Clinton: M I, USA) w ith a 50 kHz frequency in alternate 4-electrodes current. To de-termine the slim mass, it w as used a formula validated by Segal et al.(3):
12) M M bia = 0,0011E2 – 0,021R + 0,232M – 0,068I + 14,595
w here: M M bia = slim mass attained by the bio-impedance (kg); E
= height (m); R = resistance (Ω); M = body mass (kg); I = age
(years).
by Physical Education professionals. Test 1: straight supine (tri-ceps, shoulders, and chest); Test 2: leg press (thighs and gluteus); Test 3: seated-pulley dow n row ing (biceps, shoulders, and back). Statistical analysis: The normality w as tested through Kolmog-orov and Smirnov. To the correlations, it used the Pearson or Spear-man methods to the normality or not, respectively. The beginning (M 1) and end (M 2) of the study w ere compared through the paired t-test or the Wilcoxon test, w henever there w as or not normality, respectively. The variance betw een groups (∆; M 2-M 1) it w as as-sessed through the non-paired t-test or M ann-Whitney test, w hen-ever there w as or not normality, respectively. The results are the mean and the standard deviation, and to the correlations, the indi-vidual data w ith the central bias line. The statistical conclusions w ere performed at 5% significance w ith a 95% reliance interval(19).
RESULTS
There w ere seventeen discontinuances due to: non-compliance to the interventions (n = 7), difficulties in the training schedules (n = 3), disease in the family (n = 1), fall (n = 1), depression and/or anxiety (n = 5).
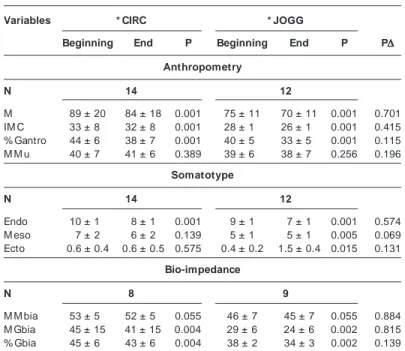
The results of the body composition by the anthropometry and bio-impedance, the BM I and somatotype are presented on table 1. There w as a reduction in the body fat in both groups, the CIRC has increased the muscularity and the JOGG has increased the fragility.
TABLE 1
Anthropometric assessment and bio-impedance Variables * CIRC * JOGG
Beginning End P Beginning End P P∆∆∆∆∆ Anthropometry
N 14 12
M 89 ± 20 84 ± 18 0.001 75 ± 11 70 ± 11 0.001 0.701
IM C 33 ± 80 32 ± 80 0.001 28 ± 10 26 ± 10 0.001 0.415
% Gantro 44 ± 60 38 ± 70 0.001 40 ± 50 33 ± 50 0.001 0.115
M M u 40 ± 70 41 ± 60 0.389 39 ± 60 38 ± 70 0.256 0.196
Somatotype
N 14 12
Endo 10 ± 10 8 ± 1 0.001 9 ± 1 7 ± 1 0.001 0.574
M eso 7 ± 2 6 ± 2 0.139 5 ± 1 5 ± 1 0.005 0.069
Ecto 0.6 ± 0.4 0.6 ± 0.5 0.575 0.4 ± 0.2 1.5 ± 0.4 0.015 0.131
Bio-impedance
N 8 9
M M bia 53 ± 50 52 ± 50 0.055 46 ± 7 45 ± 7 0.055 0.884
M Gbia 45 ± 15 41 ± 15 0.004 29 ± 6 24 ± 6 0.002 0.815
% Gbia 45 ± 60 43 ± 60 0.004 38 ± 2 34 ± 3 0.002 0.139
The values are mean ± SD. * CIRC = circuit training group, and CAM = jogging training group. P = statistical result M 1xM 2 (intra-groups); P∆ = variations betw een groups (intergroups) (∆ = M 2-M 1 for each group). M = body mass (kg); IM C = body mass index (kg/m2); % Gantro = fat percentage
through the anthropometry; M M u = muscular mass calculated through the anthropometry (kg)(17);
Endo = endomorphic component of the somatotype; M eso = mesomorphic component of the somatotype; Ecto = ectomorphic component of the somatotype(4); M M bia = slim mass calculated
through the bio-impedance (kg); M Gbia = fat mass calculated through the bio-impedance (kg); % Gbia = fat percentage calculated through the bio-impedance(3).
The M CA and the muscular area of the arm had a significant increase in the CIRC (p = 0.023 both). The muscular circumfer-ence of the thigh did not present any differcircumfer-ence in both groups (p > 0.05). The M CA deltas and the muscular circumference of the thigh w ere not different betw een both groups (p > 0.05). The mean 1-M R for the three exercises had a significant increase betw een M 1 and M 2 to the CIRC (58 ± 25 kg x 65 ± 26 kg, p < 0.0001), and to the JOGG (48 ± 22 kg x 53 ± 21 kg, p < 0.0001).
Fig. 2 – Pearson linear correlation betw een the fat percentage attained
through the bio-impedance (% Gbia)(3) and the anthropometric variables
(% Gantro)(1,2),before the interventions (M 1), according to the
methodolo-gy described. Statistics: n = 43; r = 0.83; r2 = 0.69; P < 0.0001.
% Gbia
%
G
a
n
tr
o
Fig. 1 – Comparison betw een the fat percentage calculated through the
bio-impedance (% Gbia)(3) and anthropometric variables (% Gantro)(1,2)
be-fore the interventions (M 1) according to the methodology described. Re-sults are the mean ± standard deviation; N = 43; P = 0.356.
Bio-impedance x anthropometry
F
a
t
p
e
rc
e
n
ta
g
e
% Gbia M 1 % Gantro M 1
60
50
40
30
20
10
0
Fig. 3 – Pearson’s linear correlation betw een the endomorphic and
meso-morphic components of the somatotype(18) the fat percentage (% Gantro),
and the slim mass (M M antro)(1,2) respectively, calculated through the
an-thropometry, according to the methodology described. The endomorphy w as significantly correlated to the % Gantro before (M 1-A) and after (M 2-B) the interventions (N = 26, P < 0.0001 in both). The mesomorphy w as significantly correlated to the M M antro before (M 1-C) and after (M 2-D) the interventions (N = 26, P = 0.003 and P = 0.032 respectively).
M 1 – A M 1 – C
M 2 – B M 2 – D
Endomorphy M esomorphy
%
G
a
n
tr
o
%
G
a
n
tr
o
M
M
a
n
tr
o
(
k
g
)
M
M
a
n
tr
o
(
k
g
)
60 55 50 45 40 35 30 25 55 50 45 40 35 30 25
80
70
60
50
40
30 80
70
60
50
40
30
In order to compare the correspondence of the somatotype com-ponents to the other variables, the groups w ere treated as they w ere one sole group. The means of the fat percentage of the bio-impedance and anthropometry in M 1 w ere not different among them, and they w ere significantly correlated (figures 1 and 2, re-spectively).
The endomorphy w as significantly correlated to the fat percent-age of the anthropometry in both moments, and the mesomorphy w as correlated to the anthropometry slim mass (fig. 3 A, B, C, D). The ectomorphy w as not correlated to the anthropometry slim mass in no moment (p > 0.05).
The mesomorphy variations and the anthropometry slim mass w ere not correlated to the ∆ of the sum of the 1-M R (p > 0.05). There w as no difference betw een groups to the sum of the 1-M R (p > 0.05).
DISCUSSION
It is suggested that the separate treatment of the somatotype components confounds the result, leading to non-significant inter-pretations. How ever, it is impossible to make a direct analysis of the alterations betw een plotted points in a 3-dimensional space(20).
In order to test these assertions, w e have tried to verify both ap-proaches to assess the alterations caused by the exercise proto-cols.
In general, the interventions caused a reduction in the body fat in those assessed w omen, and this w as indicated by every meth-od used in this study.
In an individual analysis, the somatotype components, the re-sults suggest that the CIRC group became stronger and the JOGG groups became more fragile. This is reinforced by the increase in the M CA and in the muscular area of the arm only in the CIRC. Nevertheless, the other muscularity indicators (muscular circum-ference of the thigh, slim mass of the bio-impedance and muscu-lar mass) w ere not modified in any group.
The conjunct analysis of the somatotype of its three compo-nents has show n that both groups w alked tow ards the mesomor-phoendomorpho category, w here the first and second components are equal or are not more than a half unit different, and the third one is low er(18), but they did not begin to change their category.
How ever, this suggests a reduction in the fat component and an increase in the muscular component. This is characteristic of the somatotype, that can show a “ type” alteration in the physic, and not only in the quantification and proportion of the fat and slim tissues. M aybe a longer interventional time could evidence those alterations as to the strength and “ robustness” in favor of the CIRC to the variables that had not any alteration. Nevertheless, these set of results do not allow assert that the CIRC became stronger and the JOGG became more fragile, since this may be a limitation in interpreting the somatotype components isolate.
Similar to w hat happened in the present study, other studies also found a good(21) or moderate(5) relationship of the
endomor-phy and the body fat in both genders. As to the sports, those rep-resentatives w ith more endomorphic expressivity w ere the chan-nel sw immers, the football players, the golf players, and those w ith the low est amount of that component w ere the long-distance runners, w restling fighters, and w eight lifters of the lighter cate-gories(22) and physi-culturists(8), suggesting that such component
has an important correspondence to the body fat.
The mesomorphy and the slim mass w ere not correlated to the strength increase observed, and the neuromuscular factors might have been more important to the strength gain in this phase than the muscular hypertrophy per se(7). Although the muscular mass
has pointed tow ards the direction of the mesomorphic results, w ith an approximate 1 kg increase in the CIRC and a decrease in the JOGG, these w ere not significant. At last, the increase in the ectomorphy in the JOGG might have occurred mainly due to the
reduction in the body mass, once from all variables to calculate that component, this is the only skilled for adult individuals.
Similar to w hat w as observed in this study, Wilmore(5) found a
w eak correlation of the mesomorphy and the slim mass, and the shared variance (r2) w as 2.6% and 16.8% for w omen and men,
respectively. The strength is related to the slim mass and conse-quently to the m esom orphy(4). Therefore, the increase in the
strength estimated by the sum of the 1-M R justifies such relation-ship in the CIRC, but not to the JOGG, that has reduced the morphy. Still, it w as observed that the relationship of the meso-morphy to the slim mass and the body density is gender-dependent. In a study involving men and w omen, Susanne et al.(21) found a
positive correlation betw een the muscular improvement and the body density only in the first ones. How ever, Carter(22) observed
that the mesomorphy w as a characteristic generally found in ath-letes, and the w omen that had the highest expression of that com-ponent w ere the gymnasts and among w eigh-lifters.
The lack of a mesomorphic relationship w ith the 1-M R tests may in part have been due to the relatively short endurance of the protocol, and partially because w omen do not respond w ell to such component.
On the other hand, the increase in the ectomorphy only in the JOGG might have been due to the type of the activity performed by the groups. The CIRC group practiced resisted activities relat-ed to the muscular hypertrophy(10). In the sports, individuals
in-volved in the endurance training, such as w eight-lifters(22) and
phys-ic-culturists(8) presented higher mesomorphic values and low er
ectomorphic values. The endurance activities such as the mara-thon, presents an inverse bias(22).
It w as observed that the ectomorphy w as positively related to the skeletal factor and negatively related to the muscular factor and the body fat. How ever, the ectomorphy w as not an indepen-dent factor in both genders(21). Another study has observed that
the ectomorphy w as higher in main Italian volleyball league play-ers compared to the secondary league. Still, the secondary league players w ere more mesomorphic than those of the main league. The main league players w ere taller and presented a higher height/ w eight relationship in both genders, and low er values as to the cutaneous folds compared to the secondary league(23). This must
have influenced the higher ectomorphic expression, but not nec-essarily indicating that they w ere more fragile, being reinforced even by the best sportive performance found in the main league. Therefore, it is necessary to interpret these results very carefully. M any studies have been performed w ith athletes, and this lim-its the comparison w ith non-athlete individuals.
The anthropometry is subject to several types of errors to be used as accurate measurements due to a lack of an adequate train-ing and non-appropriate equations. In a recent study, it w as ob-served that the anthropometric measurements has underestimat-ed about 29% of the fat, and overestimatunderestimat-ed 4-5% of the muscular area of the arm upon the comparison on the computerized tomog-raphy(16). How ever, the fat percentage estimated through the
an-thropometry w as positively correlated in the present study, and did not present any difference betw een means compared in the bio-impedance. Still, in another study w ith type-2 diabetic old w om-en conducted by our group, the result had equal statistical means and it w as highly correlated to the results attained in the DEXA(14).
The cutaneous folds w ere capable to perform an adequate predic-tion on the total body fat as w ell as the trunk fat in children com-pared t o t he DEXA(15). Theref ore, t he equat ions used in t his
study(1,13) seem to perform a quite w ell role as to the general use
in different populations.
As to the somatotype, its different components presented dif-ferent results compared to other methods: a) the endomorphy seemed to be w ell-correlated to the body fat; b) the mesomorphy had a fragile relationship to the slim and muscular mass; and, c) the ectomorphy is not an independent factor, and it must be inter-preted along w ith other data. The strength improvement in those w omen did not depend only on the muscular improvement, sug-gesting that other factors, such as neuromuscular factors should participate in that process. At last, the anthropometry using a ge-neric equation to estimate the body composition presented simi-lar results than the bio-impedance did.
All the authors declared there is not any potential conflict of inter-ests regarding this article.
REFERENCES
1. Pollock M L, Schmidt DH, Jackson AS. M easurement of cardio respiratory fitness and body composition in the clinical setting. Comp Ther 1980;6:12-7.
2. Siri WE. Body composition from fluid spaces and density. In: Brozek J, Henschel A, editors. Techniques for measuring body composition. Washington DC: Nation-al Academy of Science, 1961;223-4.
3. Segal KR, Van Loan M , Fitzerald PI, Hodgdon JA, Van Itallie TB. Lean body mass estimation by bioelectrical impedance analyses: a four-site cross-validation study. Am J Clin Nutr 1988;47:7-14.
4. Heath BH, Carter JEL. A modified somatotype method. Am J Phys Anthropol 1967;27:57-74.
5. Wilmore JH. Validation of the first and second components of the Heath-Carter modified somatotype method. Am J Phys Anthropol 1970;32:369-72.
6. Nevill AM , Stew art AD, Olds T, Holder R. Are adult physiques geometrically sim-ilar? The dangers of allometric scalling using body mass pow er law s. Am J Phys Anthropol 2004;124:177-82.
7. Pow ers SK, How ley ET. Fisiologia do exercício: Teoria e aplicação ao condiciona-mento e ao desempenho. 3ª ed., São Paulo, SP: M anole, 2000:50;286-7.
8. Silva PRP, Trindade RS, De Rose EH. Composição corporal, somatotipo e propor-cionalidade de culturistas de elite do Brasil. Rev Bras M ed Esporte 2003;9:403-7.
9. Song TM K, Perusse L, M alina RM , Bouchard C. Tw in resemblance in somatotype and comparisons w ith others tw in studies. Hum Biol 1994;66:453-64.
10. Fett CA, Naílsa M , Burini RC. Alterações metabólicas, na força e massa muscula-res, induzidas por um protocolo de musculação em atletas sem e com a suple-mentação de Omega-3 (W-3) ou triglicerídios de cadeia média (TCM ). Fit & Per-form J 2002;1:28-35.
11. Fett CA, Rezende Fett WC. Correlação de parâmetros antropométricos e hormonais ao desenvolvimento da hipertrofia e força muscular. R Bras Ci M ov 2003;11:27-32. 12. Salem M , Fernandes Filho J, Pires Neto CS. Desenvolvimento e validação de equa-ções antropométricas específicas para a determinação da densidade corporal de mulheres militares do Exército Brasileiro. Rev Bras M ed Esporte 2004; 10:141-46.
13. Pollock M L, Wilmore JH, Fox III SM . Exercícios na saúde e na doença – Avaliação e prescrição para prevenção e reabilitação. Rio de Janeiro, RJ: Editora M EDSI, 1986;229-40.
14. Fett WCR. Comparação entre a antropometria e o raio-X de dupla varredura para avaliação da composição corporal de idosas diabéticas tipo 2 e sua associação com a força de preensão da mão. Dissertação de M estrado em Clínica M édica – Investigação Biomédica da Faculdade de M edicina de Ribeirão Preto, da Univer-sidade de São Paulo, Ribeirão Preto, SP, 2005.
15. Leppik A, Jurimae T, Jurimae J. Influence of anthropometric parameters on body composition measured by bioelectrical impedance analysis or DXA in children. Acta Paediatr 2004;93:1036-41.
16. Jordão Jr AA, Bellucci AD, Dutra de Oliveira JE, M archini JS. M idarm computer-ized tomography fat, muscle and total areas correlation w ith nutritional assess-ment data. Int J Obes 2004;28:1451-5.
17. M artin AD, Spenst LF, Drinkw ater DT, Clarys JP. Anthropometrical estimation of muscle mass in men. M ed Sci Sports Exerc 1990;22:729-33.
18. Brito WF, M eirelles SM P, M archini JS. Somatotipo e antropometria de indivíduos de 10 à 60 anos da região Polonoroeste do Brasil – dados de Jaurú-M ato Grosso. Rev UFM T 1984;4:163-75.
19. Daw son B, Trapp RG. Basic & Clinical Biostatistics. 2nd ed., Lange M edical Books/ M cGraw -Hill, USA, 1994;82-97, 99-122, 162-83.
20. Rahmaw ati NT, Hastuti J, Ashizaw a K. Grow th and somatotype of urban and rural Javanese children in Yogyakarta and Bantul, Indonesia. Anthropol Sci 2004;112:99-108.
21. Susanne C, Bodzsar EB, Castro S. Factor analysis and somatotyping, are these tw o physique classification methods comparable? Ann Hum Biol 1998;25:405-14.
22. Carter JEL. The somatotypes of athletes – A review. Hum Biol 1970;42:535-69.