Correlation between Metabolic and Body Composition Variables in
Female Adolescents
Eliane Rodrigues de Faria, Sylvia do Carmo Castro Franceschini, Maria do Carmo Gouveia Peluzio, Luciana Ferreira
da Rocha Sant’Ana, Silvia Eloiza Priore
Universidade Federal de Viçosa, Viçosa, MG, Brazil
Summary
Background: Analysis of metabolic alterations and body composition in adolescents.
Objective: To study the correlation of serum levels of lipids, glycemia, insulin, homocysteine, HOMA-IR and blood pressure among themselves and with body variables.
Methods: Data concerning glycemia, total cholesterol and fractions (LDL, HDL and VLDL), triacylglycerols, insulin, homocysteine and blood pressure were measured in 100 adolescents at the age range of 14 to 17 years, who had already had menarche and attended the public schools in Vicosa, state of Minas Gerais, Brazil. The percentage of body fat (%BF) was evaluated by horizontal bioimpedance.
Results: In relation to nutritional status, 83%, 11% and 6%, respectively were eutrophic (EU), presented overweight/ overweight risk (OW/OR) or low weight (LW) (CDC/NCHS, 2000) and 61% presented high percentage of BF. Total cholesterol presented the highest percentage of inadequacy (57%), followed by HDL (50%), LDL (47%) and triacylglycerols (22%). Inadequacy in 11%, 9%, 5% and 4% were observed in relation to insulin resistance, insulin, blood pressure and glycemia, respectively. For total cholesterol, insulin, HOMA-IR and nutritional state, OW/OR>LW (p<0.05). For body composition and nutritional status, OW/OR>EU>LW (p <0.001). Some positive and strong correlations were found between BMI and the anthropometrical measures estimating the % of total BF, as well as central distribution, except for the waist/hip ratio. The %BF was correlated with insulin levels (r=0.303; p <0.001) and HOMA-IR (r=0.281; p<0.001).
Conclusions: Some metabolic alterations, most often related with excess weight and body fat as well as insulin resistance were found, reinforcing the importance of specific programs directed at the adolescent health. (Arq Bras Cardiol 2009; 93(2):112-120)
Key Words: Adolescent; female; body composition; insulin resistance; body weight changes.
Mailing Address: Eliane Rodrigues de Faria •
Rua Adezílio Bicalho, 252 - Santa Clara - 36570-000 – Viçosa, MG, Brazil. E-mail: [email protected]
Manuscript received August 12, 2008; revised manuscript received October 15, 2008; accepted October 24, 2008.
Introduction
The World Health Organization defines adolescence as the period between 10 to 19 years of age that involves physical, psychological and social transformations, which can manifest in different ways and at periods for each individual1.
Obesity in childhood and adolescence has acquired epidemic characteristics worldwide. Data from the Family Income Research (FIR) carried out in 2002-2003, demonstrated that of the 35.5 million adolescents aged 10 to 19 years, 16.75% were overweight2.
Contrarily to what occurred until recently, when the concern regarding obese children and adolescents was the high risk of becoming obese adults, currently, the main concern is related to the consequences of obesity still during these early phases of life. Problems such as the formation of atherosclerotic plaques, glucose intolerance, non-insulin dependent diabetes mellitus, dyslipidemia, arterial hypertension, hyperleptinemia, among others, associated to the body fat distribution found in obese
adults, are already present in obese children and adolescents. The development of insulin resistance seems to led to the metabolic syndrome, which includes a higher number of complications such as dyslipidemia and arterial hypertension3.
Oliveira et al4 state that one must take into account
the presence of early atherosclerosis lesions as early as in the first decade of life. The presence of metabolic alterations – insulin resistance, dyslipidemia, hypertension, thrombogenic alterations, and hyperuricemia – can contribute to the development of this process, as there is an association between the excess weight in the first decades of life and the high rate of morbimortality in the adult life due to cardiovascular diseases. Therefore, this study aimed at assessing the correlation between serum levels of lipids, glycemia, insulin, homocysteine, HOMA-IR and blood pressure among them and with the body composition variables, in female adolescents.
Methods
Sample
years, recruited from public high schools in the city of Vicosa, state of Minas Gerais, Brazil. The enrolled adolescents had had menarche at least one year prior to study enrollment; those who presented chronic diseases, regularly used medications that could alter the blood pressure (BP), fasting glycemia or lipid metabolism, had used oral contraceptives for less than 2 months, regularly used diuretics/laxatives, had pacemaker or prosthesis and those who refused to participate in the study were excluded.
Menarche is an easy-access marker of pubertal development, demonstrating that the adolescent has gone through the growth spurt, that is, has undergone the physiological body alterations of this age range. Therefore, this study assessed female adolescents one year after menarche, as they are expected to be at the phase of sexual maturation, resulting in a more homogenous group.
The sample selection was based on the total number of adolescents, at the age range of interest, registered during the year 2006 in public high schools in the urban area of the city of Vicosa, state of Minas Gerais, Brazil5. The sample
was calculated through the Epi Info program, version 6.04 for cross-sectional studies, considering a total population of 2,500 individuals, expected frequency of metabolic syndrome of 8% and variability of 2.5%, totaling 90 individuals, with a 95% confidence interval. Ten percent was added to recover possible losses related to withdrawal from the study. Of all the adolescents that met the inclusion criteria (n=336), a random selection was carried out by drawing lots until a sample of 100 adolescents was obtained. each individual participated only once in the drawing of lots, that is, the name drawn was included in an appropriate protocol and was not returned to the remaining names that were still available for the respective purpose.
Of all the adolescents invited to participate in the study, 18 refused to do it and thus, a new drawing of lots was carried out to substitute them.
The project was approved by the Committee of Ethics in Research in Humans of the Federal University of Vicosa.
Methods
Weight was measured on a digital scale, with a maximum capacity of 136 kg and a 100 g-subdivision, and height was measured in a stadiometer, with a 2-meter extension and o.1-cm scale, with a plastic viewer and a set square couple to one of the extremities. Weight and height were measured according to the techniques recommended by Jellife6.
The assessment of the nutritional status was carried out through the calculation of the body mass index (BMI), using the cutoffs and anthropometric reference established by the Center for Disease Control and Prevention – National Center for Health Statistics (CDC/NCHS, 2000)7. Adolescents with
overweight risk and overweight (> p85) were grouped in excess weight8-10.
The Body Mass Index of Fat (BMIF) and the Fat-free Body Mass Index (FFBMI) were also calculated. Body fat location was carried out by adding the bicipital skinfold - BSF, tricipital skinfold -TSF, (peripheral fat - PF) and subscapular skinfold -
SSSF, suprailiac skinfold - SISF (central fat - CF), using a Lange Skinfold Calipeequipment.
The waist and hip circumferences were measured with a flexible and inelastic measuring tape with a 2-meter extension, divided in centimeters and sub-divided in millimeters, taking care not to exercise pressure on soft tissues. The waist/hip ratio (WHR) was calculated. The percentage of body fat as well as the fat mass and fat-free mass was estimated in kilograms, using a tetrapolar horizontal electrical bioimpedance equipment (Biodynamics, model 310, version 7.1). The assessment was carried out between 7 AM and 8:30 AM, following a protocol of care prior to the test9. The percentage of body fat was analyzed according
to the classification proposed by Lohman11.
The values obtained with the bioimpedance equipment were compared with the equation for the prediction body fat by Houtkooper et al12 for adolescents aged 10 to 19 years, to
verify if the values differed.
Equation by Houtkooper et al12: FFM (kg) = 0.61(height (m)x
height(m)/Resistance) + 0,.25 [Body weight (kg)] + 1.31 Resistance = measure given by the BIA in ohms (Ω) *By difference, the body fat was obtained (kg) and, consequently, its percentage.
Blood pressure (BP) was measured with an automatic inflation blood pressure monitor, recommended by the Brazilian Society of Cardiology, according to the recommendations of the V Brazilian Directives of Arterial Hypertension (2006). The values proposed according to the adolescents’ height percentiles were considered for the cutoffs regarding the systolic and diastolic pressure13.
Blood was collected from the participants after a 12-hour fasting for glycemia, plasma insulin and homocysteine analysis, as well as to for the assessment of serum lipids, such as total cholesterol, triacylglycerols, HDL (high density lipoprotein), LDL (low density lipoprotein) and VLDL (very low density lipoprotein).
For altered results related to dyslipidemia and fasting insulin levels (> 15µU/mL) the cutoffs for adolescents were those recommended by the I Directive of Atherosclerosis Prevention in Childhood and Adolescence14. For the fasting glycemia, we used
the recommendation of the American Diabetes Association15,
which considers as criterion a fasting glycemia > 100 mg/ dL. Insulin resistance was measured through the HOMA-IR (Homeostasis Model Assessment - Insulin Resistance) method = [(fasting insulin (µU/mL) x fasting glycemia [mmol/L])/22.5] >3.16)14.
Software and Statistical Analysis
characteristics of the variables. The level of the null hypothesis rejection was < 0.05 or 5%.
Results
The mean age range was 16.02 ± 0.67 and the median was 15.96 years. Age at the menarche showed mean, median, minimum and maximum values of 12.32 (± 1.14); 12.08; 10.0 and 15.07 years, respectively. The prevalence of overweight and low weight was 11% and 6%, respectively. However, when classified by the percentage of body fat, 48 and 61% of the adolescents, respectively, presented overweight risk
or overweight, according to the bioimpedance data and the formula used in the analysis.
Total cholesterol total was the marker that showed the highest degree of inadequacy (57%), followed by the HDL (50%) and LDL fractions (47%) and triacylglycerols (22%). Regarding the fasting insulin, 9% presented inadequate levels, whereas 4% presented altered fasting glycemia levels. HOMA-IR index was elevated in 11% and 5% had altered BP levels.
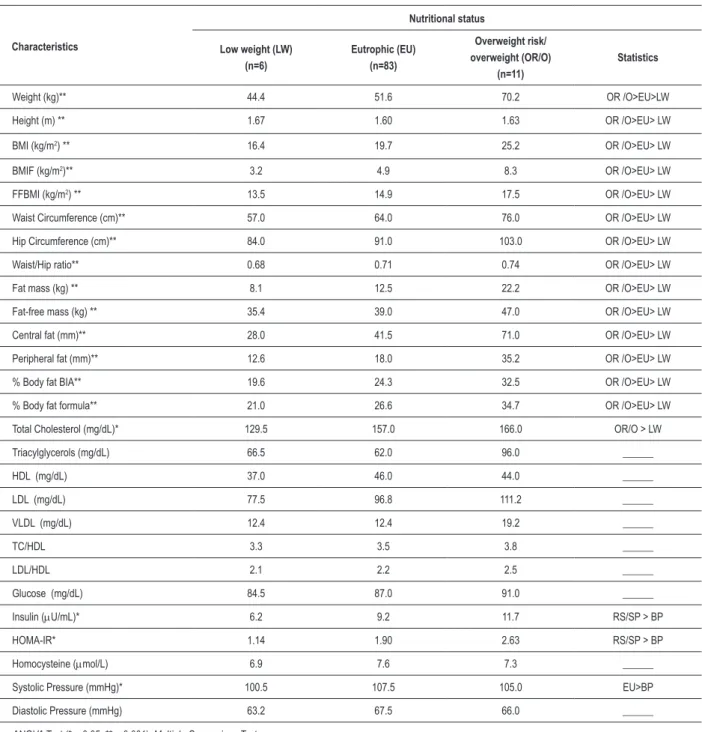
Table 1 shows the median values of the anthropometric and metabolic characteristics in relation to the adolescents’ nutritional status.
Table 1 – Median values of anthropometric and metabolic characteristics in relation to the nutritional status of the adolescents.
Characteristics
Nutritional status
Low weight (LW) (n=6)
Eutrophic (EU) (n=83)
Overweight risk/ overweight (OR/O)
(n=11)
Statistics
Weight (kg)** 44.4 51.6 70.2 OR /O>EU>LW Height (m) ** 1.67 1.60 1.63 OR /O>EU> LW BMI (kg/m2) ** 16.4 19.7 25.2 OR /O>EU> LW
BMIF (kg/m2)** 3.2 4.9 8.3 OR /O>EU> LW
FFBMI (kg/m2) ** 13.5 14.9 17.5 OR /O>EU> LW
Waist Circumference (cm)** 57.0 64.0 76.0 OR /O>EU> LW Hip Circumference (cm)** 84.0 91.0 103.0 OR /O>EU> LW Waist/Hip ratio** 0.68 0.71 0.74 OR /O>EU> LW Fat mass (kg) ** 8.1 12.5 22.2 OR /O>EU> LW Fat-free mass (kg) ** 35.4 39.0 47.0 OR /O>EU> LW Central fat (mm)** 28.0 41.5 71.0 OR /O>EU> LW Peripheral fat (mm)** 12.6 18.0 35.2 OR /O>EU> LW % Body fat BIA** 19.6 24.3 32.5 OR /O>EU> LW % Body fat formula** 21.0 26.6 34.7 OR /O>EU> LW Total Cholesterol (mg/dL)* 129.5 157.0 166.0 OR/O > LW Triacylglycerols (mg/dL) 66.5 62.0 96.0 ______
HDL (mg/dL) 37.0 46.0 44.0 ______
LDL (mg/dL) 77.5 96.8 111.2 ______
VLDL (mg/dL) 12.4 12.4 19.2 ______
TC/HDL 3.3 3.5 3.8 ______
LDL/HDL 2.1 2.2 2.5 ______
Glucose (mg/dL) 84.5 87.0 91.0 ______
Insulin (µU/mL)* 6.2 9.2 11.7 RS/SP > BP
HOMA-IR* 1.14 1.90 2.63 RS/SP > BP
Homocysteine (µmol/L) 6.9 7.6 7.3 ______
Systolic Pressure (mmHg)* 100.5 107.5 105.0 EU>BP Diastolic Pressure (mmHg) 63.2 67.5 66.0 ______
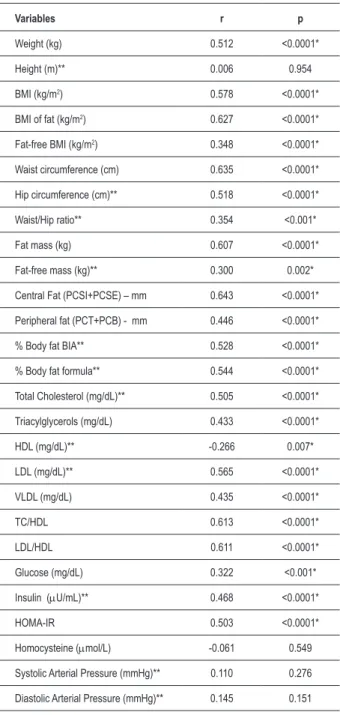
Table 2 - Correlation between the number of risk factors presented by the adolescents and the body composition, biochemistry and blood pressure variables.
Variables r p
Weight (kg) 0.512 <0.0001* Height (m)** 0.006 0.954 BMI (kg/m2) 0.578 <0.0001*
BMI of fat (kg/m2) 0.627 <0.0001*
Fat-free BMI (kg/m2) 0.348 <0.0001*
Waist circumference (cm) 0.635 <0.0001* Hip circumference (cm)** 0.518 <0.0001* Waist/Hip ratio** 0.354 <0.001* Fat mass (kg) 0.607 <0.0001* Fat-free mass (kg)** 0.300 0.002* Central Fat (PCSI+PCSE) – mm 0.643 <0.0001* Peripheral fat (PCT+PCB) - mm 0.446 <0.0001* % Body fat BIA** 0.528 <0.0001* % Body fat formula** 0.544 <0.0001* Total Cholesterol (mg/dL)** 0.505 <0.0001* Triacylglycerols (mg/dL) 0.433 <0.0001* HDL (mg/dL)** -0.266 0.007* LDL (mg/dL)** 0.565 <0.0001* VLDL (mg/dL) 0.435 <0.0001* TC/HDL 0.613 <0.0001* LDL/HDL 0.611 <0.0001* Glucose (mg/dL) 0.322 <0.001* Insulin (µU/mL)** 0.468 <0.0001* HOMA-IR 0.503 <0.0001* Homocysteine (µmol/L) -0.061 0.549 Systolic Arterial Pressure (mmHg)** 0.110 0.276 Diastolic Arterial Pressure (mmHg)** 0.145 0.151
n–100; Pearson’s correlation – parametric variables, Spearman’s correlation – non-parametric variables *statistically signiicant results ** variables with com normal distribution.
Table 2 shows the correlation between the number of risk factors presented by the adolescents (overweight risk/ overweight, high percentage of body fat, total cholesterol, triacylglycerols and LDL results above the desired levels, HDL results below the desired levels as well as altered BP, fasting glycemia and insulin levels and insulin resistance defined by the HOMA-IR index) and the anthropometric, body composition, biochemical and blood pressure variables.
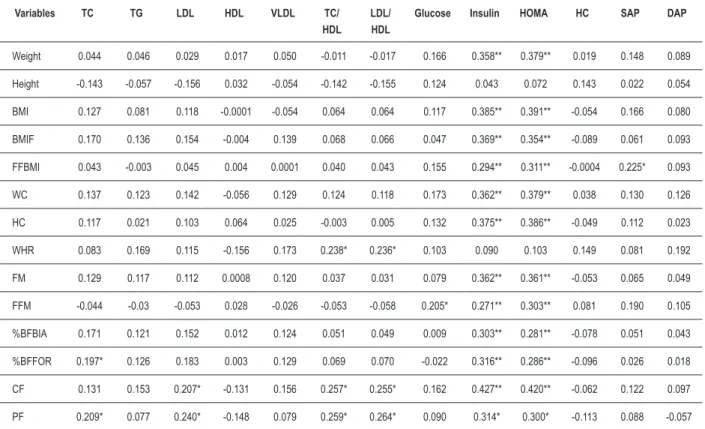
Tables 3, 4 and 5 show the correlations among the anthropometric, body composition, biochemical and blood pressure variables.
Discussion
Most of the studied adolescents were eutrophic, when analyzed by BMI, but they presented alterations such as excess weight calculated by the BMI as well as by the percentage of body fat. The excess weight was associated to higher total cholesterol, insulin and insulin resistance levels, as well as with body composition variables. In this sense, it is noteworthy that, even with a predominance of eutrophic adolescents in the studied sample, 96% presented one or more alterations related to body composition and metabolic variables, with correlations being observed between the number of alterations and most of the analyzed variables, except for height, homocysteine, systolic and diastolic blood pressure levels (Table 2). These risk factors, when considered alone, have the capacity to induce atherosclerotic cardiovascular disease. The attempts to establish diagnostic criteria for the metabolic syndrome are based on the principle that these components can act synergistically or as a group, increasing the risk, which has yet to be demonstrated16.
The isolated measurement of the abdominal circumference has shown a better association with the metabolic alterations than the WHR, as confirmed by the present study, in which the isolated measurements of the waist and hip circumferences presented higher correlation with the metabolic and body composition variables than the WHR, showing that the latter was not a good index of body fat for adolescents. According to Oliveira et al4, the WHR in adolescents is not appropriate
to evaluate the distribution of body fat, as the pelvic bone structure undergoes rapid alterations during the sexual maturation process and thus, the WHR can be more related to this variation than to the body fat distribution itself.
However, no cutoffs have been established for the abdominal circumference that would indicate the risk of an adolescent developing cardiovascular disease in the future. Therefore, for adolescents, BMI seems to be a better criterion for obesity classification, considering that even at early ages, BMI is generally associated to the onset and development of risk factors that can predispose adults to a higher incidence of metabolic and functional disorders, in addition to being easy to use and correlating to body fat17.
Despite the positive and significant correlation between BMI and the measurements that estimate the percentage of total body fat, as well as its central distribution observed in the present study and others18,19, the isolated use of the BMI
is not indicated, as it presents some limitations. According to Wells20, obesity is the excess of body fat and not the excess
of body weight and the isolated use of the BMI for routine body composition assessments, in at-risk individuals, may fail in the identification of excess body fat and its associated risk factors in the population aged < 20 years.
Table 3 – Correlation (r) between the variables of body composition with biochemical and blood pressure variables.
Variables TC TG LDL HDL VLDL TC/ HDL
LDL/ HDL
Glucose Insulin HOMA HC SAP DAP
Weight 0.044 0.046 0.029 0.017 0.050 -0.011 -0.017 0.166 0.358** 0.379** 0.019 0.148 0.089 Height -0.143 -0.057 -0.156 0.032 -0.054 -0.142 -0.155 0.124 0.043 0.072 0.143 0.022 0.054 BMI 0.127 0.081 0.118 -0.0001 -0.054 0.064 0.064 0.117 0.385** 0.391** -0.054 0.166 0.080 BMIF 0.170 0.136 0.154 -0.004 0.139 0.068 0.066 0.047 0.369** 0.354** -0.089 0.061 0.093 FFBMI 0.043 -0.003 0.045 0.004 0.0001 0.040 0.043 0.155 0.294** 0.311** -0.0004 0.225* 0.093 WC 0.137 0.123 0.142 -0.056 0.129 0.124 0.118 0.173 0.362** 0.379** 0.038 0.130 0.126 HC 0.117 0.021 0.103 0.064 0.025 -0.003 0.005 0.132 0.375** 0.386** -0.049 0.112 0.023 WHR 0.083 0.169 0.115 -0.156 0.173 0.238* 0.236* 0.103 0.090 0.103 0.149 0.081 0.192 FM 0.129 0.117 0.112 0.0008 0.120 0.037 0.031 0.079 0.362** 0.361** -0.053 0.065 0.049 FFM -0.044 -0.03 -0.053 0.028 -0.026 -0.053 -0.058 0.205* 0.271** 0.303** 0.081 0.190 0.105 %BFBIA 0.171 0.121 0.152 0.012 0.124 0.051 0.049 0.009 0.303** 0.281** -0.078 0.051 0.043 %BFFOR 0.197* 0.126 0.183 0.003 0.129 0.069 0.070 -0.022 0.316** 0.286** -0.096 0.026 0.018 CF 0.131 0.153 0.207* -0.131 0.156 0.257* 0.255* 0.162 0.427** 0.420** -0.062 0.122 0.097 PF 0.209* 0.077 0.240* -0.148 0.079 0.259* 0.264* 0.090 0.314* 0.300* -0.113 0.088 -0.057
* p < 0.05 ** p<0.001; Pearson’s correlation – parametric variables, Spearman’s correlation – non-parametric variables.
Table 4 – Correlation (r) between biochemical variables and blood pressure.
TG LDL HDL VLDL CT/HDL LDL/HDL GLICOSE INSULINA HOMA HC PAS PAD
TC 0,240* 0,929** 0,309** 0,241* 0,408** 0,477** 0,025 0,15 0,115 -0,123 -0,025 0,038 TG ___ 0,162 -0,338** 1,000** 0,502** 0,367** 0,103 0,435** 0,419** 0,021 0,0003 0,109 LDL ___ -0,058 0,164 0,649** 0,744** 0,109 0,112 0,119 -0,146 -0,022 0,014 HDL ___ -0,337** -0,713** -0,646** -0,263** -0,143 -0,179 0,013 -0,014 0,002 VLDL ___ 0,503** 0,368** 0,107 0,440** 0,425** 0,023 0,002 0,112 TC/HDL ___ 0,983** 0,244* 0,269** 0,291** -0,050 -0,029 0,057 LDL/HDL ___ 0,225* 0,223* 0,247* -0,073 -0,035 0,039 GLUCOSE ___ 0,365** 0,518** -0,029 0,129 0,172
INSULIN ___ 0,983** -0,233* 0,148 0,101
HOMA-IR ___ -0,215* 0,168 0,119
HC ___ 0,277** 0,107
SAP ___ 0,598**
DAP ___
to use methods to determine body fat and, among them, Rodriguez et al17 call attention to the use of the anthropometric
measures and electrical bioimpedance analysis as the most frequently used ones.
The isolated measure of the percentage of body fat, measured by horizontal bioimpedance, was also correlated to insulin and its resistance, as well as the BMI, in addition to being well correlated with the studied anthropometric variables. It is noteworthy the fact that weight and height, which are BMI components, do not behave in a similar fashion, considering that only the weight presented a positive correlation with BMI and the percentage of body fat, justifying its use to verify the presence of body fat.
However, the electrical bioimpedance analysis has its limitations, such as the lack of knowledge of the formulas used in the equipment. The present study used a formula that has been validated for adolescents, for the comparison of the results presented at the equipment reading. It was observed that the formula proposed by Houtkooper et al12 for adolescents aged 10 to 19 years presented higher
correlations than the results given by the equipment, and this formula values were different from those obtained through the equipment (p<0.0001). Therefore the data provided by the formula are better, due to their higher sensitivity, resulting in a better diagnosis of the adolescents with excess body fat, allowing the prevention of future risks.
It is noteworthy that the excess amount of body fat in adolescents is accompanied by a greater deposit of fat in the abdominal region in relation to the extremities, regardless of gender. The predominance of body fat in the abdominal region
has been associated to several metabolic disorders, such as altered fasting glycemia, insulin resistance, diabetes mellitus and dyslipidemia4. In this study, it was observed that the central
fat is strongly associated to other anthropometric variables, in addition to a higher correlation with LDL, TC/HDL, LDL/HDL, fasting insulin and insulin resistance itself.
However, one must be careful when using international references for cutoffs in adolescents when comparing the nutritional status of the Brazilian population with reference intervals from other countries, generally from the United States of America. This practice, which disregards differences in ethnicity, culture, socioeconomic conditions, physical constitution and eating habits of the Brazilian population, can lead to biases, impairing the surveillance of the nutritional status in the country.
Several indices have been developed to evaluate insulin resistance. Studies carried out by Keskin et al21, comparing
the HOMA and QUICKI indices, observed that the HOMA-IR index is the most sensitive and specific to evaluate insulin sensitivity. Additionally, these same authors determined that the cutoff for adolescents is 3.16, which is different from that of adults.
A HOMA-IR index that was above than the expected was observed in 11% of the adolescents. However, the mean values of HOMA-IR in the present study were higher than those observed in a study that evaluated female adolescents aged 12-19 years, in which the highest values were found in the overweight group, with a mean of 2.24, whereas the mean in the group without overweight was 1.918. This shows that the
interaction of the factors (nutritional, obesity and amount of
Table 5 – Correlation (r) between the anthropometric variables and body composition.
Variables Height IMC IMCG IMCGL CC CQ RCQ MG MLG %GCBIA %GCFOR GC GP
Weight 0.500** 0.868** 0.773** 0.703** 0.871** 0.925** 0.188 0.863** 0.844** 0.552** 0.580** 0.836** 0.609** Height 0.011 0.043 -0.024 0.237* 0.312* -0.039 0.264* 0.597** 0.009 0.005 0.176 0.114 BMI 0.862** 0.840** 0.875** 0.893** 0.244* 0.834** 0.689** 0.623** 0.662** 0.857** 0.517** BMIF 0.448** 0.820** 0.821** 0.249* 0.971** 0.403** 0.916** 0.919** 0.853** 0.541** FFBMI 0.664** 0.696** 0.107 0.430** 0.784** 0.116 0.183 0.599** 0.332** WC 0.808** 0.570** 0.840** 0.689** 0.613** 0.669** 0.844** 0.438** HC -0.022 0.862** 0.760** 0.635** 0.658** 0.823** 0.521**
WHR 0.223* 0.109 0.161 0.223* 0.284* 0.011
FM 0.527** 0.917** 0.922* 0.869** 0.554**
FFM 0.115 0.162 0.602** 0.348**
%BFBIA 0.965** 0.697** 0.461**
%BFFOR 0.733** 0.471**
BF 0,824**
body fat) can be the cause of higher insulin resistance levels. It is suggested that the deposition of abdominal fat is probably greater in the adolescents that presented elevated body fat and that this variable is correlated with the insulin levels (r=0.303; p<0.001) and HOMA-IR (r=0.281; p<0.001). However, other factors might also have given a strong contribution to this system, such as an inadequate lifestyle.
The levels of insulin and HOMA-IR positively correlated with the body variables, except height and WHR, in addition to correlating with triacylglycerols, VLDL, TC/HDL, LDL/HDL and glucose. The results indicate that the level of insulin resistance must be monitored in adolescents with excess weight and body fat, as it seems that, the higher the insulin resistance, the higher the presence of cardiovascular risk factors, the higher the prevalence of metabolic syndrome and, consequently, the higher the risk of premature development of diabetes and cardiovascular diseases4.
Hyperinsulinemia is considered an independent risk factor for cardiovascular diseases, as it has an important role in the development of other components of the metabolic syndrome, such as dyslipidemia, hypertension and hyperuricemia22. A
high correlation was observed between insulin and HOMA-IR (r=0.983), emphasizing that the isolated level of insulin is a good indicator of insulin resistance.
Another point to be considered is the high percentage of inadequate lipid levels found in this study, even in eutrophic adolescents without excess body fat. It is worth mentioning that the TC and HDL means and medians presented by the adolescents were already inadequate (154.1±29.2mg/dL and 44.1±11.1mg/dL, respectively), that is, these results indicate that 50% or more of this population already presented alteration in relation to these lipid levels. Additionally, the eutrophic adolescents already presented cholesterol levels that were above the desired range (Table 1).
The lipid levels undergo variations during the growth and development phase, caused by sexual maturation, with differences according to age and sex. They are higher in female children and adolescents and this difference is more significant during adolescence. On average, girls present higher levels of TC, HDL and LDL, with a progressive increase in HDL from 10 years on, becoming higher than that observed in boys at the end of adolescence. Similarly, the LDL and total cholesterol levels progressively increase from 14-15 years of age in girls, being higher than those observed in boys around 17-18 years. Perhaps menarche is important for the development of this phenomenon in adolescence14. Triacylglycerols are
substrates for the formation of VLDL; therefore, when the blood levels of triacylglycerols increase, there is consequently an increase in the levels of this lipoprotein23, explaining the
perfect correlation between these two lipid levels. Moreover, triacylglycerols and VLDL present higher correlations with the metabolic variables, including HOMA-IR and insulin, than total cholesterol and fractions, showing a higher association with insulin resistance.
This result can indicate the importance of insulin level measurements in adolescents with hypertriglyceridemia to verify the presence of insulin resistance.
Furthermore, the lipid levels presented a correlation among them and with other cardiovascular risk variables, such as glucose, insulin and HOMA-IR. Considering the important causal association between dyslipidemia and atherosclerosis and how early the onset of atherosclerotic vascular lesions can occur, it is crucial to know the lipid profile of the adolescents, with the objective of planning preventive health care actions24.
Homocysteine has been considered an important risk factor for coronary artery disease25 and although the homocysteine
levels appear to have a direct association with insulin levels in obese children and adolescents26, there was an inverse
correlation between insulin (r=-0.233; p<0.05) and HOMA-IR (r=-0.215; p<0.05). However, no correlation was observed between homocysteine and the body composition variables and most of the metabolic variables. These results can be due to the fact that the risk of the presence of cardiovascular diseases is lower than that among adults and, therefore, homocysteine was not a good indicator of these diseases in adolescents.
Although most of the correlations were considered weak (r<0.5), albeit significant (p<0.05), we must carefully consider these results, which are very relevant to help the nutritional intervention in this population. However, further studies are necessary to better understand the alterations found in this age range.
The prevalence of arterial hypertension in the present study is in accordance with epidemiological studies on primary hypertension in childhood and adolescence carried out in Brazil, varying from 0.8 – 8.2%27,28. The BP did not
present a correlation with the body composition variables, but only between the systolic pressure and homocysteine. These data can be due to the fact that most adolescents were eutrophic, as there is an association between obesity and risk of hypertension in childhood and adolescence14.
The results of the present study are the object of concern, as the metabolic and body composition alterations in adolescence can persist in adult life. Oliveira19 carried
out a study with 100 male individuals, in three different phases of life: at birth, at the end of adolescence (18 and 19 years) and at the end of the adult life. The BMI in adolescence positively correlated with the weight and BMI in the adult life (r =0.634; p<0.001; r =0.678; p<0.001; respectively). The adults with metabolic syndrome presented in adolescence higher weight, waist circumference and BMI values, reinforcing the observation that the increase in the prevalence of overweight/obesity in adolescence can reflect on the increase in the prevalence of metabolic syndrome in the adult phase. It was concluded that the adolescence, specifically the end of this period, seems to be of great importance in determining the nutritional status and in the prevention of future problems.
1. World Health Organization. Nutrition in adolescence: issues and challenges for the health sector: issues in adolescent health and development. Geneva; 2005.
2. Braga C. Síndrome metabólica na adolescência. Adolescência & Saúde. Rio de Janeiro. 2006; 3 (3): 18-20.
3. Sociedade Brasileira de Diabetes. Atualização brasileira sobre diabetes. Rio de Janeiro: Diagraphic; 2006.
4. Oliveira CL, Mello MT, Cintra IP, Fisberg M. Obesidade e síndrome metabólica na infância e adolescência.Rev Nutr. 2004; 17 (2): 237-45.
5. Ministério da Saúde. (DATASUS). 2006. [Acessado em 2006 jan 10]. Disponível em http://w3.datasus.gov.br/datasus/datasus.php.
6. Jelliffe DB. Evolución del estado de nutrición de la comunidad Ginebra: Organización Mundial de la Salud; 1968. (Série de Monografias, nº 53). 7. Centers for Disease Control and Prevention 2000. CDC/NCHS (2000),
Growth charts for the United States: improvements to the 1977 National Center for Health Statistics Version. Pediatrics. 2002; 109 (1): 45-60. 8. Alvarez MM, Vieira ACR, Moura AS, Veiga GV. Insulin resistance in Brazilian
adolescent girls: association with overweight and metabolic disorders. Diabetes Research and Clinical Practice. 2006; 74: 183-8.
9. Barbosa KBF. Consumo alimentar e marcadores de risco para a síndrome metabólica em adolescentes do sexo feminino: comparação entre instrumentos de inquérito dietético. [Dissertação]. Viçosa (MG): Universidade Federal de Viçosa; 2006.
10. Weiss R, Dziura J, Burgert TS, Tamborlane WV, Taksali SE, Yeckel CW, et al. Obesity and the metabolic syndrome in children and adolescents. N Engl J Med. 2004; 350: 2362-74.
11. Lohman TG. Assesing fat distribuition. In: Advances in body composition assessment: current issues in exercise science. Illinois: Human Kinetics Champaign; 1992. p. 57-63.
References
12. Houtkooper LB, Lohman TG, Going SB, Hall MC. Validity of bioeletric impedance for body composition assessment in children. J Appl Physiol. 1989; 66: 814-21.
13. Sociedade Brasileira de Cardiologia. V Diretrizes brasileiras de hipertensão arterial. Arq Bras Cardiol. 2007; 89 (3): e24-e79.
14. Sociedade Brasileira de Cardiologia. I Diretriz de prevenção da aterosclerose na infância e adolescência. Arq Bras Cardiol. 2007; 85 (supl 6): 1-36. 15. American Dietetic Association. Diagnosis and classification of diabetes
mellitus. Diabetes Care. 2006; 29: S43- S48.
16. Saad MJA, Zanella MT, Ferreira SRG. Síndrome metabólica: ainda indefinida, mas útil na identificação do alto risco cardiovascular. Arq Bras Endocrinol Metab. 2006; 50 (2): 161-2.
17. Rodriguez G, Moreno LA, Blay VA, Garagorri JM, Sarría A, Bueno M. Body composition in adolescents: measurements and metabolic aspects. Int J Obes. 2004; 28: 54-8.
18. Novaes JF. Fatores de risco para o sobrepeso em crianças do município de Viçosa (MG). [Dissertação]. Viçosa (MG): Universidade Federal de Viçosa; 2005.
19. Oliveira RMS. Condições de nascimento e estado nutricional na adolescência como fatores determinantes da situação nutricional de indivíduos adultos do sexo masculino em Viçosa (MG) [Dissertação]. Viçosa (MG): Universidade Federal de Viçosa; 2007.
20. Wells JCK. A Hattori chart analysis of body mass index in infants and children. Int J Obes. 2000; 24: 325-9.
21. Keskin M, Kurtoglu S, Kendirci M, Atabek ME, Yazici C. Homeostasis model assessment is more reliable than the fasting glucose/insulin ratio and quantitative insulin sensitivity check index for assessing insulin resistance among obese children and adolescents. Pediatrics. 2005; 115 (4): e500-e503.
practice, as it addresses relevant questions concerning the studied group.
Conclusion
In spite of the predominance of eutrophic adolescents, risk factors for the development of metabolic syndrome and, consequently, of cardiovascular diseases, were found. These factors were more prevalent among adolescents with excess weight and body fat, as they presented higher levels of TC, insulin and HOMA-IR.
Although some correlations were considered weak, the results also indicate that insulin resistance is a factor that must be monitored in adolescents with excess eight and body fat, as it seems that, the higher the level of insulin resistance, the higher the presence of cardiovascular risk factors, the higher the prevalence of metabolic syndrome and, consequently, the higher the risk of the premature development of cardiovascular diseases.
Therefore, it is important to adopt measures that will allow an early diagnosis of these alterations. Adolescence is emphasized as the appropriate moment to establish these measures, so that they will have a positive impact on the cardiovascular diseases in the future, as this group becomes relevant and strategic in terms of public health, health promotion and disease prevention. Hence, we reinforce the need to establish specific programs directed at the adolescents’ health care.
Funding: FAPEMIG (CDS – 1345/06) and CNPq; CAPES (Master’s Degree grant).
Acknowledgements
To the public schools of the city of Vicosa, state of Minas Gerais, Brazil, for their support regarding the study carried out with the adolescents and for their approval of the research. To the academicians of the Department of Nutrition and Health for their help in data collection. To the Division of Health of the Federal University of Vicosa for the biochemical analyses. To FAPEMIG and CNPq, for the financial support and to CAPES for the grant.
Potential Conflict of Interest
No potential conflict of interest relevant to this article was reported.
Sources of Funding
This study was funded by FAPEMIG e CNPq.
Study Association
22. Ferreira AP, Oliveira CE, França NM. Síndrome metabólica em crianças obesas e fatores de risco para doenças cardiovasculares de acordo com a resistência à insulina (HOMA-IR). J Pediatr. 2007; 83:21-6.
23. Sociedade Brasileira de Cardiologia. Departamento de Aterosclerose III Diretrizes brasileiras sobre dislipidemias e diretriz de prevenção da aterosclerose. Arq Bras Cardiol. 2001; 77(supl. 3): 1-48.
24. Giuliano ICB, Coutinho MSSA, Freitas SFT, Pires MMS, Zunino JN, Ribeiro RQC. Lípides séricos em crianças e adolescentes de Florianópolis (SC) – Estudo Floripa Saudável 2040. Arq Bras Cardiol. 2005; 85 (2): 85-91. 25. Neves LB, Macedo DM, Lopes AC. Homocisteína. J Bras Patol Med Lab. 2004;
40 (5): 311-20.
26. Glowinska B, Urban M, Koput A, Galar M. New atherosclerosis risk factors in obese, hypertensive and diabetic children and adolescents. Atherosclerosis. 2003; 167 (2): 275-86.
27. Gus I, Harzheim E, Zaslavsky C, Medina C, Gus M. Prevalence, awareness, and control of systemic arterial hypertension in the state of Rio Grande do Sul. Arq Bras Cardiol. 2004; 83 (5): 429-33.