ISSN 2179-8087 (online)
Original Article
Silviculture
Creative Commons License. All the contents of this journal, except where otherwise noted, is licensed under a Creative Commons Attribution License.
Inceptisol Physicochemical Attributes in the Caatinga Biome
Agroforestry Systems
Osvaldo Nogueira de Sousa Neto
1, Nildo da Silva Dias
1,
Eulene Francisco da Silva
1, Cybelle Barbosa e Lima Vasconcelos
1,
Ana Luíza Lima Ferreira
2, Cleyton dos Santos Fernandes
11Universidade Federal Rural do Semi-Arido – UFERSA, Mossoró/RN, Brasil
2Escola Superior de Agricultura “Luiz de Queiroz” – ESALQ, Universidade de São Paulo – USP, Piracicaba/SP, Brasil
ABSTRACT
We evaluated two areas of sustainable management within the Caatinga and one area of conventional agricultural cultivation to compare their physicochemical attributes with those of native forest. The management strategies were as follows: (1) thinning of savanna; (2) thinning of strips; (3) conventional tillage with plowing and harrowing; and (4) native forest. The main indicators of physicochemical quality of the environments were bulk density, porosity, clay amount, phosphorus content, cation exchange capacity, and organic matter. The use of soil for agricultural purposes resulted in a reduction of soil organic matter, regardless of the tillage system. Even though the management strategy, which involved thinning of savanna, further increased the soil phosphorus content and compaction, it did not reach critical values that limit crop development.
1. INTRODUCTION
Extractive agricultural systems are predominant in the semi-arid region of the Brazilian Northeast, where livestock farming is based on heavy grazing and agriculture develops through indiscriminate deforestation, burnings, and inadequate fallow periods (Araújo, 2002).
Although with little expression, the sustainable management of the Caatinga is widespread in rural communities of the Brazilian semi-arid region and represents an adaptation to local conditions. It uses the principles of an agroforestry system (AFS), which has become an alternative method of agricultural production, minimizing the effects of the human-environment interaction. In this case, thinning of the Caatinga is only performed for tillage and grazing.
However, studies on the soil physicochemical attributes under sustainable management systems of the Caatinga become more relevant. For example, Marinho et al. (2016) have demonstrated that some chemical attributes, such as P, K+, Ca+2, and organic
matter (OM), are more sensitive indicators than the separation of environments.
Studies on AFS in the Brazilian Northeast have found positive impacts of such systems on soil chemistry. One AFS study found lower contents of Al+3 and higher levels of C, N, and P after a period of
10 years (Lima et al., 2011). Lira et al. (2012) analyzed effects of conventional tillage and agroforestry in the Caatinga thinning (five and seven years) and observed a significant loss of soil fertility in the conventional tilling system in Rio Grande do Norte. The authors also pointed out that the soil from the five-year management areas presented higher pH, effective cation exchange capacity, base saturation, sum and calcium content.
Data obtained in the Brazilian Cerrado by Pezzoni et al. (2012) show that bulk density and microporosity presented lower values in areas close to tree trunks, increasing with distance; soil organic matter decreased the effects of bulk density.
In this context, this study evaluates the changes in the physicochemical attributes of an Inceptisol managed according to two different agroforestry systems in the Brazilian Caatinga areas, compared to areas with conventional tillage and native forest.
2. MATERIAL AND METHODS
The research was developed within the Moacir Lucena Settlement Project, located in the municipality of Apodi (microregion of the Chapada do Apodi and mesoregion of the Potiguar West) in Rio Grande do Norte, between 5°39’55” South latitude and 37°48’13” West longitude, at 60 m above sea level. The settlement consists of 20 families and 7 aggregates, in a total area of 549.91 ha. The average area per family (lot) is approximately 19.6 ha, and the remaining land has been divided into 50 ha of deforested area and 59.07 ha of collective area.
According to Köppen’s classification, the climate of the region is BSw’h’ type, semi-arid warm tropical, with an average annual rainfall of 550 to 940 mm and an average annual temperature of 23 °C, with two well-defined periods: dry (prolonged) and moist (short and irregular). The natural vegetation is hyper-xerophilic Caatinga. The soil of the area is classified as Inceptisol, showing high clay activity and a base saturation greater than 50% in most of the first 100 cm of the B-horizon (EMBRAPA, 2013), moderate A-horizon, clay texture, a Caatinga hyper-xerophilic phase, and flat relief originating from limestone.
We selected four areas within the settlement to evaluate the soil physical and chemical attributes. The history and management strategies adopted for these areas are described below:
(1) Management of the Caatinga area with thinning on strips (CST) – Beginning in November 2003. The thinning was performed on 10 m wide strips, interleaved with 10 m wide strips of native forest. This area has also been used for other purposes, such as beekeeping during rainy periods and goat grazing during dry periods;
(Cajanus cajan), ‘mucuna’ (Mucuna spp), ‘flor-de-seda’ (Calotropis procera), ‘mata pasto’ (Senna uniflora L.), etc. Prior to our experiment, this area has also been used for beekeeping and goat grazing;
(3) Conventional tillage area (CT) – This experiment started in 2013, when an area of 4 ha was deforested and the woody and leafy stubble was burned. Subsequently, the soil was prepared using conventional tillage (plowing) and the plot was harvested. Since 2004, this plot has been used for corn and bean crop. In dry periods, spontaneous plants and cultural residues were used as pasture to feed small ruminants;
(4) Native forest area (NF) – This represents the legal reserve area of the family settlements, which is considered to be in natural condition (control); however, it has been used for grazing and beekeeping in dry periods.
To evaluate the soil physicochemical attributes, we established soil profiles in places that represented the management strategy adopted in the respective area. We collected soil samples within the pedogenic horizons (A and Bi), where the A-horizon represented the 0-0.30 m layer, and the B-horizon the 0.30-0.60 m layer. The soil samples were air dried, disaggregated, passed through a 2 mm sieve, packed in plastic bags, and transported to the Soil, Water and Plant Laboratory (SWPL/UFERSA). To quantify soil chemical attributes, we performed the following analyses: pH in water (ratio 1:2.5), electrical conductivity of saturation extract (CEse) in water, exchangeable calcium (Ca2+) and
magnesium (Mg2+) contents with potassium chloride
extractor, soil acidity (H + Al) using calcium acetate, and analysis of phosphorus (P), sodium (Na+) and
potassium (K+) using Mehlich-1 extractor. All analyses
were performed according to the EMBRAPA guidelines (EMBRAPA, 2009). We also calculated cation exchange capacity and base saturation. For analysis of soil organic matter, soil samples were squeezed and passed through a 0.210 mm sieve (60 mesh); the soil organic matter was determined via oxidation of total organic carbon caused by potassium dichromate (wet analysis) with external heating. We then titrated the solution with ammoniacal ferrous sulphate (Mendonça & Matos, 2005).
In terms of soil physical attributes, we determined soil granulometry using a chemical dispersant (sodium hexametaphosphate) and distilled water in 20 g of soil
with slow mechanical agitation on a stirrer (Wagner 50 rpm) for 16 hours. We quantified sand (2 to 0.05 mm) by sieving, clay (< 0.002 mm) by sedimentation, and silt (0.05 to 0.002 mm) by the difference between fractions of total sand and clay. Soil particle density was measured using the volumetric flask method with soil samples dried at 105 °C and ethyl alcohol. Moisture at field capacity, permanent wilting point, and total soil porosity were determined according to Donagema et al. (2011).
The mean values of soil physicochemical attributes from different horizons (A and Bi) and management areas (CST, CSA, CT, and NF) were interpreted via multivariate analysis. In this case, we used factorial analysis (FA) by means of the main component extraction method. Each variable was estimated with eight replicates, and the averages were plotted with respective standard deviations. In addition, the number of factors to be extracted was established to explain more than 70% of the total data variance. The varimax rotation method was adopted to maximize the variance within each factor, and the value of 0.70 was defined for significant factor loads. From the factorial loads of soil physicochemical attributes, scores were calculated for different treatments; that way, we correlated scores and factorial loads with the factors, thereby facilitating arrangement and interpretation of the points in the factorial plane.
3. RESULTS
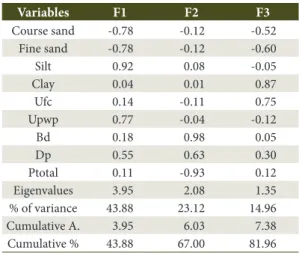
According to the results of the factorial analysis of soil physical attributes of pedogenic horizons from different management areas, the first three factors explained 81.96% of the total data variance (Table 1). The amounts of coarse and fine sand, silt, and moisture at the permanent wilting point were the most relevant attributes for the determination of factor 1 (F1), which explained 43.88% of the total variance. Bulk density and total porosity composed factor 2 (F2), which accounted for 23.12% of the total variance, while clay and moisture at field capacity determined factor 3 (F3), which explained 14.96%.
that the factorial load of the amount of sand (coarse and fine sand) was negatively correlated with F1.
On the other hand, the amounts of silt and Upwp were inter-correlated and positively correlated with F1. Bulk density had a positive correlation with F2, whereas total porosity presented an inverse behavior and was negatively correlated with F2. The amount of clay was directly related to Ufc, and both factors were positively correlated with F3.
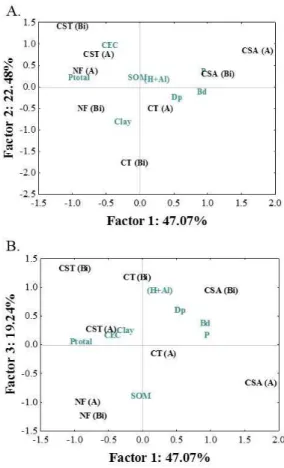
In addition, Figure 1A shows that the conventional tillage area (CT) differed from the other management areas because bulk density from CT was positively correlated with F2, while Ptotal was negatively correlated with F2. This arrangement indicates higher values of bulk density in detriment of total porosity (Table 2). Regarding texture, the amount of clay (0.48 and 0.54 kg kg-1 in
A and Bi horizons, respectively) was verified along the soil profile in CT. This indicates a greater expression of the denser mineral phase, contributing to a higher bulk density (1.20 kg dm-3) value compared to that
of native forest.
The native forest area (NF), due to the absence of heavy machines and implements, with sporadic visits by
animals, presented lower values of bulk density and higher total porosity (1.10 and 1.07 kg dm-3; 59.94 and 59.91%;
in A and Bi horizons, respectively), in both horizons, when compared to soil under cultivation (Table 2).
The management using thinning of savanna (CSA) also showed a strong and positive correlation with F2 (Figure 1A). We found higher bulk density (1.24 and 1.23 kg dm-3; in A and Bi horizons, respectively)
in both horizons in detriment of total porosity when compared to the management using thinning of strips (CST). The CST had a lower grazing pressure, resulting in lower soil bulk density (1.13 and 1.10 kg dm-3)
(Table 2). There was no significant difference between management strategies in terms of moisture at field capacity and permanent wilting point.
Figure 1. Factorial plan Factor 1 x Factor 2 (A) and Factor 2 x Factor 3 (B), showing the relationship of the physical attributes with the pedogenic horizons (A and Bi) of an Inceptisol representing thinning of savanna (CSA), thinning of strips (CST), conventional tillage (CT), and native forest (NF).
Table 1. Correlation coefficients of the main components (Factors 1, 2, and 3) for the soil physical attributes with loads greater than 0.7 (modulus) of the pedogenic horizons (A and Bi) of an Inceptisol under different land management strategies.
Variables F1 F2 F3
Course sand -0.78 -0.12 -0.52
Fine sand -0.78 -0.12 -0.60
Silt 0.92 0.08 -0.05
Clay 0.04 0.01 0.87
Ufc 0.14 -0.11 0.75
Upwp 0.77 -0.04 -0.12
Bd 0.18 0.98 0.05
Dp 0.55 0.63 0.30
Ptotal 0.11 -0.93 0.12
Eigenvalues 3.95 2.08 1.35
% of variance 43.88 23.12 14.96
Cumulative A. 3.95 6.03 7.38
Cumulative % 43.88 67.00 81.96
Factorial analysis (FA) was performed via correlation between physical and chemical attributes of the soil in order to reduce the number of the variables, leaving only the most significant ones. Thus, we could verify possible interactions and define the management that promotes greater land use sustainability.
The first three factors explained 88.79% of the total data variance. The F1 explained 47.06% of the total variance, with soil bulk density, porosity, and phosphorus concentration being the most relevant variables. In turn, F2 explained 22.48% of the total variance, with clay and CEC being the most influential variables. Finally, F3 was responsible for 19.25% of the
total variance, with OM and (H + Al) being the most important variables (Table 3).
The correlations of factorial loads of soil physicochemical attributes and the scores of pedogenic horizons of the different management areas (CSA, CST, CT, and NF) are shown in Figure 2; a greater distance of these management types from the axis of origin indicates greater expression.
Total porosity showed a negative correlation with F1, while bulk density and phosphorus content were positively correlated with F1. In contrast, F2 was positively correlated with CEC, which was expected since the amount of clay is one of the main variables Table 2. Means ± standard deviations of the physicochemical attributes of pedogenic horizons (A and Bi) of an Inceptisol representing thinning of savanna (CSA), thinning of strips (CST), conventional tillage (CT), and native forest (NF). (Complementary Table).
Variables
Management area
CT CSA CST NF
(A) (Bi) (A) (Bi) (A) (Bi) (A) (Bi)
pHH2O 6.53±0.08 5.46±0.07 7.06±0.06 7.45±0.05 7.18±0.08 7.48±0.04 7.35±0.13 7.70±0.07
ECse 55.5±0.05 63.0±0.08 52.9±0.07 30.6±0.08 132.9±0.1 143.9±0.13 53.2±0.08 42.26±0.10 SOM 1.94±0.60 0.70±0.46 2.20±0.51 1.09±0.54 1.74±0.46 0.74±0.35 2.83±0.48 2.43±0.50 P 3.25±0.32 2.75±0.99 11.8±2.23 10.6±4.22 1.91±0.89 2.13±0.56 1.52±0.31 1.05±0.29 K+ 329.9±7.2 191.6±4.5 277.8±5.2 230.9±4.1 282.4±5.1 248.13±6.1 332.9±2.8 144.6±2.92
Na+ 9.88±2.31 6.70±7.21 3.83±6.21 4.88±8.21 11.1±7.38 11.3±3.58 12.6±2.63 15.3±3.65
Ca2+ 11.2±0.78 8.13±1.15 11.7±1.21 11.5±0.22 16.9±0.88 17.80±0.56 12.7±0.46 12.55±0.35
Mg2+ 1.76±1.33 2.53±0.99 2.85±0.67 1.38±0.91 1.01±0.78 0.55±0.66 2.11±0.55 2.45±0.21
(H + Al) 1.94±0.88 2.25±0.67 1.83±0.79 2.19±0.56 1.81±0.32 2.23±0.21 1.70±0.51 0.99±0.61 SB 14.3±2.60 11.2±1.78 15.2±1.48 13.6±1.88 18.6±1.78 19.04±3.32 15.70±2.10 15.51±1.89 CEC 15.7±0.78 13.5±0.88 17.0±0.28 15.8±0.34 20.6±1.78 21.26±0.60 17.44±0.56 16.50±0.17 V 87.45±2.1 83.3±1.68 89.3±0.78 86.0±0.78 91.3±1.08 89.50±0.98 90.45±2.2 94.0±2.08 Coarse sand 0.22±0.06 0.18±0.09 0.27±0.04 0.18±0.09 0.28±0.07 0.26±0.03 0.23±0.06 0.21±0.07 Fine sand 0.11±0.03 0.09±0.05 0.13±0.06 0.09±0.02 0.13±0.05 0.12±0.06 0.11±0.06 0.11±0.09 Total sand 0.33±0.05 0.27±0.04 0.41±0.08 0.27±0.07 0.41±0.03 0.38±0.05 0.34±0.06 0.32±0.08 Silt 0.18±0.10 0.19±0.12 0.17±0.08 0.29±0.13 0.15±0.04 0.18±0.08 0.21±0.14 0.20±0.06 Clay 0.48±0.05 0.54±0.07 0.42±0.08 0.43±0.05 0.44±0.02 0.44±0.05 0.45±0.06 0.47±0.07 Ufc 0.34±0.24 0.34±0.15 0.30±0.11 0.34±0.13 0.34±0.15 0.33±0.08 0.33±0.05 0.31±0.20 Upwp 0.16±0.16 0.16±0.11 0.16±0.07 0.17±0.08 0.16±0.03 0.14±0.09 0.17±0.14 0.17±0.09 Bd 1.19±0.06 1.20±0.02 1.24±0.07 1.23±0.04 1.13±0.05 1.10±0.05 1.07±0.03 1.10±0.06 Dp 2.78±0.09 2.86±0.13 2.78±0.06 2.94±0.09 2.78±0.11 2.74±0.07 2.67±0.17 2.78±0.20 Ptotal 57.1±3.23 57.9±2.69 55.4±1.69 58.1±3.11 59.4±2.88 59.94±3.65 59.9±2.11 60.4±2.69
pHH2O = pH in water; ECse = electric conductivity in saturation extract; SOM = Soil Organic Matter (g dm-3); P = Phosphorus (mg dm-3);
K+ = Potassium (mg dm-3); Na+ = Sodium (mg dm-3); Ca2+ = Calcium (cmol c dm
-3); Mg2+ = Magnesium (cmol c dm
-3); (H + Al) = Soil
acidity (cmolc dm-3); SB = Sum of bases; CEC = Cation exchange capacity (at pH 7.0) (cmolc dm-3); V = Base saturation (%); Coarse
sand (kg kg-1); Fine sand (kg kg-1); Silt (kg kg-1); Clay (kg kg-1); Ufc = moisture at field capacity (m3 m-3); Upwp = moisture at
impacting CET (Figure 2). Soil acidity (H + Al) showed a positive correlation with F3, while soil organic matter was negatively correlated with F3.
The area submitted to thinning in strips (CST) differed from the others because it was negatively correlated with F1 and positively with F2 (Figure 1). This indicates higher total porosity and CEC of the soil (Table 2) and lower values of bulk density and clay concentration, resembling more the natural conditions of native forest (NF).
The area submitted to thinning of the savanna (CSA) showed a positive correlation with F1, indicating higher bulk density and phosphorus contents. According to the results of the factorial analysis, there may be a correlation between soil compaction from increasing bulk density and availability of phosphorus in CSA. However, it is important to emphasize that the influence of compaction on soil nutrient diffusion is not yet clearly understood.
The conventional tillage area (CT) revealed negative correlation with F2. This area differed from the others due to its lower CEC and higher amount of clay throughout the soil profile. The native forest (NF), which represented the natural condition, was
negatively correlated with Factors 1 and 2. Its distinction in relation to the other management areas is due to higher organic matter content and total porosity and lower soil acidity and bulk density throughout the soil profile.
4. DISCUSSION
Data analysis showed that bulk density was negatively correlated with total porosity, which was expected since soil compression reduces pore size and increases bulk density. In similar studies, Spera et al. (2009) and Cunha et al. (2011) found comparable results. The use of the soil for agricultural purposes promoted changes in its physical properties, regardless of the management strategy.
Table 3. Correlation coefficients of the main components (Factors 1, 2, and 3) for physical and chemical attributes with loads greater than 0.7 (modulus) of pedogenic horizons (A and Bi) of an Inceptisol under different land management strategies.
Variables F1 F2 F3
Clay -0.25 -0.93 0.16
Bd 0.92 -0.23 0.29
Dp 0.55 -0.36 0.52
Ptotal -0.90 0.10 -0.03
SOM -0.03 0.11 -0.97
P 0.95 0.24 0.08
(H + Al) 0.26 0.07 0.86
CEC -0.44 0.85 0.08
Eigenvalues 3.76 1.80 1.54
% of variance 47.06 22.48 19.24
Cumulative A. 3.76 5.56 7.10
Cumulative % 47.06 69.54 88.79
Clay; Bd = bulk density; Dp = soil particle density; Ptotal = total porosity; SOM = soil organic matter; P = phosphorus; (H + Al) = soil acidity; CEC = cation exchange capacity (at pH 7.0). Coefficients of correlation > |0.70| are significant (Manly & Alberto, 2016); F1, F2, and F3 - Factorial loads that represent the coefficients of correlation between each factor and the variables.
Therefore, conventional tillage with plowing and harrowing, takes the soil to spraying during cultural dealings. This soil mobilization favors the re-arrangement of soil particles, as observed by Silva et al. (2005). The values of bulk density obtained in this research were lower than those found by Cortez et al. (2011), who observed average levels between 1.30 and 1.43 mg m-3 in plots submitted to
tilling, gradation, and scarification.
The high grazing pressure caused by small ruminants (sheep and goats) can explain the high bulk density of the area where savanna was thinned. Parente & Maia (2011) report that areas under heavy grazing can present changes of soil physicochemical attributes, since small ruminants usually graze gregariously, that is, they almost always graze in groups and concentrate the effect of pressure on the area. In general, the critical value for bulk density is 1.40 kg dm-3; bulk
density values increase with decreasing amounts of clay (Souza et al., 2005). The maximum bulk density determined in this study was 1.24 kg dm-3. However,
this should be taken seriously, as according to Corsini & Ferraudo (1999), bulk density values between 1.27 and 1.57 kg dm-3 restrict root growth and water
infiltration into the soil.
In terms of soil porosity, Lima et al. (2007) reported an optimum level of 0.500 m3 m-3 of total soil volume;
macroporosity is responsible for water storage and generally varies between 0.250 and 0.330 m3 m-3.
Macroporosity is represented by the volume of pores and responsible for aeration of roots, varying between 0.170 and 0.250 m3 m-3. In this research, Ptotal was
not significantly affected by the increasing in bulk density, with an average value of 0.58 m3 m-3.
The continuous deposition and mineralization of vegetal residues from forest components, and the thinning of the total area contributed to a high biodiversity of species, which may have supported the increase in soil phosphorus content in the areas where savanna was thinned. When analyzing agroforestry systems and their effects on the soil chemical attributes in an acrisol of the Cerrado of Piauí, Iwata et al. (2012) observed that the contribution of organic matter and the great biodiversity of agroforestry systems increased carbon, nitrogen, and phosphorus contents in relation to cutting and burning agriculture.
The Caatinga presents well defined characteristics, such as low trees, shrubs, cetaceous species, and bromeliaceous species, grouped into three levels: arboreal, measuring from 8 to 12 m; shrubby, from 2 to 5 m; and herbaceous plants with less than 2 m of height (Alves et al., 2009). According to a study in Rio Grande do Norte, the Caatinga generates an average of 2,068.55 kg ha-1 litter, predominantly composed
of leaves, corresponding to a fraction of 79.90% of deciduous material after 12 months (Santana & Souto, 2011). This litter production contributes to increased levels of organic matter in the soils of native forest, assisting soil aggregation and increasing soil porosity. Salton et al. (2008) found a direct relationship between the stability of macroaggregates and organic carbon in the soil. Canellas et al. (2003) observed that the soil acidity (H = Al) in superficial layers was higher in areas with lower carbon content in an Inceptisol cultivated with sugarcane. This indicates that oxidation of organic matter is an important component in acidity generation, validating our results.
5. CONCLUSIONS
The main indicators of environment separation were bulk density, total porosity, clay amount (physical attributes), phosphorus levels, cation exchange capacity, and organic matter (chemical attributes).
The use of the soil for agricultural purposes caused a reduction of organic matter, regardless of the management system.
The management with thinning of savanna increased phosphorus content and soil compaction; however, the increased soil compaction did not limit crop development.
ACKNOWLEDGEMENTS
To the Universidade Federal Rural do Semi-Árido and to the Conselho Nacional de Desenvolvimento Científico e Tecnológico – CNPq.
SUBMISSION STATUS
CORRESPONDENCE TO
Cleyton dos Santos Fernandes
Centro de Ciências Agrárias, Universidade Federal Rural do Semi-Árido – UFERSA, Av. Francisco Mota, 572, Bairro Costa e Silva, CEP 59625-900, Mossoró, RN, Brasil e-mail: cleyton1959@hotmail.com
REFERENCES
Alves JJA, Araújo MA, Nascimento SS. Degradação da caatinga: uma investigação ecogeográfica. Revista Caatinga 2009; 22(3): 126-135.
Araújo JA. Caatinga: agroecologia versus desertificação. Ciência Hoje 2002; 30(1): 44-45.
Canellas LP, Velloso ACX, Marciano CR, Ramalho JFGP, Rumjanek VM, Rezende CE et al. Propriedades químicas de um Cambissolo cultivado com cana-de-açúcar, com preservação de palhiço e adição de vinhaça por longo tempo. Revista Brasileira de Ciência do Solo 2003; 27(5): 935-944. http://dx.doi.org/10.1590/S0100-06832003000500018. Corsini PC, Ferraudo AS. Efeitos de sistemas de cultivo na densidade e macroporosidade do solo e no desenvolvimento radicular do milho em Latossolo Roxo. Pesquisa Agropecuária Brasileira 1999; 34(2): 289-298. http://dx.doi.org/10.1590/ S0100-204X1999000200017.
Cortez JW, Alves ADS, Moura MRD, Olszevski N, Nagahama HJ. Atributos físicos do Argissolo amarelo do Semiárido nordestino sob sistemas de preparo. Revista Brasileira de Ciência do Solo 2011; 35(4): 1207-1216. http://dx.doi. org/10.1590/S0100-06832011000400014.
Cunha EQ, Stone LF, Moreira JAA, Ferreira EPB, Didonet AG, Leandro WM. Sistemas de preparo do solo e culturas de cobertura na produção orgânica de feijão e milho. I - Atributos físicos do solo. Revista Brasileira de Ciência do Solo 2011; 35(2): 589-602.
Donagema GK, Campos DVB, Calderano SB, Teixeira WG, Viana JHM. Manual de métodos de análise de solo. 2. ed. Rio de Janeiro: Embrapa Solos; 2011.
Empresa Brasileira de Pesquisa Agropecuária – EMBRAPA. Manual de análises químicas de solos, plantas e fertilizante. 2. ed. Brasília: Embrapa Informação Tecnológica; 2009. Empresa Brasileira de Pesquisa Agropecuária – EMBRAPA. Sistema Brasileiro de Classificação de Solos. 3. ed. Brasília: Embrapa; 2013.
Iwata BF, Leite LFC, Araújo ASF, Nunes LAPL, Gehring C, Campos LP. Sistemas agroflorestais e seus efeitos sobre os atributos químicos em Argissolo Vermelho-Amarelo do Cerrado piauiense. Revista Brasileira de Engenharia Agrícola e Ambiental 2012; 16(7): 730-738. http://dx.doi. org/10.1590/S1415-43662012000700005.
Lima CGR, Carvalho MP, Mello LMM, Lima RC. Correlação linear e espacial entre a produtividade de forragem, a
porosidade total e a densidade do solo de Pereira Barreto (SP). Revista Brasileira de Ciência do Solo 2007; 31(6): 1233-1244. http://dx.doi.org/10.1590/S0100-06832007000600002. Lima SS, Leite LFC, Oliveira FC, Costa DB. Atributos químicos e estoques de carbono e nitrogênio em Argissolo Vermelho-Amarelo sob sistemas agroflorestais e agricultura de corte e queima no norte do Piauí. Revista Árvore 2011; 35(1): 51-60. http://dx.doi.org/10.1590/S0100-67622011000100006. Lira RB, Dias NS, Alves SMC, Brito RF, Sousa ON. Efeitos dos sistemas de cultivo e manejo da Caatinga através da análise dos indicadores químicos de qualidade do solo na produção agrícola em Apodi, RN. Revista Caatinga 2012; 25(3): 18-24.
Manly BFJ, Alberto JAN. Multivariate statistical methods: a primer. Boca Raton: CRC Press; 2016
Marinho ACCS, Portela JC, Silva EF, Dias NS, Sousa Júnior FS, Silva AC et al. Organic matter and physicochemical attributes of a cambiisol under different agricultural uses in a semi-arid region of Brazil. Australian Journal of Crop Science 2016; 10(1): 32-41.
Mendonça ES, Matos ES. Matéria orgânica do solo: métodos de análises. Viçosa: UFV; 2005.
Parente HN, Maia MO. Impacto do pastejo sobre a compactação dos solos com ênfase no Semiárido. Revista Trópica - Ciências Agrárias e Biológicas 2011;5(3): 3-15. Pezzoni T, Vitorino ACT, Daniel O, Lempp B. Influência de Pterodon emarginatus Vogel sobre atributos físicos e químicos do solo e valor nutritivo de Brachiaria decumbens Stapf em sistema silvipastoril. Cerne 2012; 18(2): 293-301. http://dx.doi.org/10.1590/S0104-77602012000200014. Salton JC, Mielniczuk J, Bayer C, Boeni M, Conceição PC, Fabrício AC et al. Agregação e estabilidade de agregados do solo em sistemas agropecuários em Mato Grosso do Sul. Revista Brasileira de Ciência do Solo 2008; 32(1): 11-21. http://dx.doi.org/10.1590/S0100-06832008000100002. Santana JAS, Souto JS. Produção de serapilheira na Caatinga da região semi-árida do Rio Grande do Norte, Brasil. Idesia 2011; 29(2): 87-94. http://dx.doi.org/10.4067/ S0718-34292011000200011.
Silva RR, Silva MLN, Ferreira MM. Atributos físicos indicadores da qualidade do solo sob sistemas de manejo na bacia do Alto do Rio Grande - MG. Ciência e Agrotecnologia 2005; 29(4): 719-730. http://dx.doi.org/10.1590/S1413-70542005000400003.
Souza ED, Carneiro MAC, Paulino HB. Atributos físicos de um neossolo quartzarênico e um latossolo vermelho sob diferentes sistemas de manejo. Pesquisa Agropecuária Brasileira 2005; 40(11): 1135-1139. http://dx.doi.org/10.1590/ S0100-204X2005001100012.