Water availability to soybean crop as a function
of the least limiting water range and evapotranspiration
1Tallyta Ramalho Rodrigues2, Derblai Casaroli2, Adão Wagner Pêgo Evangelista2, José Alves Júnior2
INTRODUCTION
Soybean requires water availability of 450-850 mm cycle-1 to keep yield (Embrapa 2003). The best soybean yield and development potential may be limited by water stress during critical development stages, especially at the germination-emergence and flowering-grain filling stages. However, the effect of stress due to water deficit and/or surplus is complex and depends on the cultivar, development stage and its duration (Maehler et al. 2003, Fante et al. 2010).
ABSTRACT
RESUMO
Water surplus stress alters the root system cellular metabolism, inhibiting symbiotic fixation and absorption of nitrogen and other minerals, leading to root growth reduction and nodulation, probably due to the oxygen demand in the fixation process (Amarante & Sodek 2006). On the other hand, water deficit reduces plant photosynthetic rate, mainly by inducing stomatal closure and reducing leaf expansion, which limits CO2 assimilation (Taiz & Zeiger 2009). Therefore, drought causes reduction of soybean growth rate and, consequently, lower grain yield (Almeida et al. 2003).
1. Manuscript received in Oct./2016 and accepted for publication in May/2017 (http://dx.doi.org/10.1590/1983-40632016v4743746).
2. Universidade Federal de Goiás, Escola de Agronomia, Goiânia, GO, Brazil. E-mails: [email protected], Irrigation management aimed at optimal production has
been based only on the water factor. However, in addition to
the water potential of the soil, factors such as soil penetration resistance and soil O2 diffusion rate also affect plant growth and interfere with water absorption, even if moisture is within the available water range. This study aimed at quantifying the least limiting water range and demonstrating its potential in soil and water management in irrigated agriculture. In order to determine the least limiting water range, soil water retention curves and soil resistance to penetration were determined from undisturbed soil samples. The sequential water balance and the reference, crop and real evapotranspiration were determined for a soybean crop season. Soil aeration was the least limiting water range upper limit for soils with bulk density greater than 1.33 Mg m-3, whereas soil resistance
to penetration was the lower limit for bulk density higher than 1.43 Mg m-3. The bulk density of the soil studied was
1.35 Mg m-3, indicating 0.37 m3 m-3 of water availability, based
on the least limiting water range, which is sufficient to supply
the crop evapotranspiration. Irrigation management based on
the least limiting water range is more efficient and complete
than that based only on available water.
KEY-WORDS: Glycine max L. [Merril]; soil water balance;
water demand.
Disponibilidade hídrica para a cultura da soja em
função do intervalo hídrico ótimo e da evapotranspiração
O manejo de irrigação, visando à produção ótima, tem sido
baseado apenas no fator água. No entanto, além do potencial de água
no solo, fatores como a resistência do solo à penetração e a taxa de
difusão de O2 no solo também afetam o crescimento das plantas e interferem na absorção de água, mesmo em umidades dentro do
intervalo de água disponível. Objetivou-se quantificar o intervalo hídrico ótimo e demonstrar o seu potencial no manejo do solo e da
água, na agricultura irrigada. Para determinação do intervalo hídrico ótimo, foram estabelecidas curvas de retenção de água no solo e
de resistência do solo à penetração a partir de amostras do solo
indeformadas. O balanço hídrico sequencial e a evapotranspiração de referência, da cultura e real foram determinados para o período
de permanência da soja em campo. A aeração do solo foi o limite
superior do intervalo hídrico ótimo para densidade do solo superior a 1,33 Mg m-3, enquanto a resistência do solo à penetração foi o limite
inferior para densidade do solo superior a 1,43 Mg m-3. A densidade
do solo estudado foi de 1,35 Mg m-3, indicando disponibilidade
hídrica de 0,37 m3 m-3, com base no intervalo hídrico ótimo, o qual
é suficiente para suprir a evapotranspiração da cultura. O manejo da irrigação baseado no intervalo hídrico ótimo é mais eficiente e
completo do que o baseado apenas na água disponível.
The estimation of crop water needs is carried out through water balance, taking into account rainfall and flows in the soil and between soil and atmosphere (Araujo et al. 2011). Thus, three aspects are important to estimate water availability in agricultural crops: plant, atmosphere and soil (Allen et al. 1998, Libardi 2005, Casaroli et al. 2010, Sant’Ana et al. 2012, Pinto Junior et al. 2013). The current irrigation management, aimed at optimal production, has beenonly based on the water factor. However, in addition to the soil water potential, factors such as soil penetration resistance and soil O2 diffusion rate also affectplant growth and interfere with water absorption (Letey 1985).
The least limiting water range (LLWR), defined as the moisture amplitude in which plant growth and development limitations caused by physical constraints are minimal, includes limitations due to penetration resistance and aeration porosity, besides matric potential and soil density effects. Its amplitude indicates the thresholds in which the soil structural condition restricts plant growth and development. Reduced LLWR values indicate inadequate physical conditions for the crop (Silva et al. 1994).
In a well-structured soil, with moderate density values, the moisture range in which plants meet optimum growth conditions is defined by water content at field capacity and permanent wilting point, i.e., LLWR is equal to the available water. However, with soil structural degradation, characterized mainly by compaction, total porosity reduction occurs. Therefore, aeration becomes deficient under high water content conditions, or even in moistures equal to or less than that corresponding to field capacity. On the other hand, the soil resistance to penetration is not only related to soil moisture, but also to density, and there may be penetration resistance values that limit plant growth in soil moistures higher than the permanent wilting point with compaction. In this case, LLWR would be defined by aeration porosity at the upper limit and by soil resistance to root penetration at the lower limit (Letey 1985, Silva et al. 1994).
As it is a soil physical parameter that incorporates plant growth limitations by aeration, available water and soil mechanical resistance to root penetration in a soil moisture range, LLWR may be a good alternative for irrigation management, promoting optimal production (Tormena et al. 1999). Thus, this study aimed at quantifying the least
limiting water range and demonstrating its potential in soil and water management in irrigated agriculture.
MATERIAL AND METHODS
The study was developed at the Fazenda Capivara, an experimental unit of the Embrapa Arroz e Feijão, in Santo Antônio de Goiás, Goiás State, Brazil (16º29’15.6”S, 49º17’55.2”W and altitude of 786 m), where the climate, according to Köppen, is Aw, with annual average temperature of 23 ºC and annual rainfall of 1,500 mm (Silva et al. 2007). The soil of the experimental area was classified as a Typical Anionic Acrustox, highly clayey, containing average values of 650 g kg-1 of clay, 100 g kg-1 of silt and 250 g kg-1 of sand.
The study was carried out in the 2013/2014 agricultural season, in a 6.99 ha area cultivated with soybean (Glycine max L. [Merril]), in a crop-livestock integration system since 2000. In the grain production stage (2.5 years of annual crops), the area was managed under a no-tillage system and involved soybean (Glycine max L.), upland rice (Oryza sativa L.) and corn (Zea mays L.) cultivation, in chronological order, associated with forage in the rainy season, established by the Santa Fé system. After the corn harvest (for silage production), Urochloa brizantha grass pasture was established and managed for the next 3.5 years, without soil management during this period. After pasture, soybean was cultivated, beginning the annual crops stage again. Pasture areas were used for cattle rearing, which graze at an average stocking rate of 1.5 (winter) and 2.7 (summer) UA ha-1. Soybean sowing was carried out on October 23, 2013 with the TMG 1180 RR cultivar.
For determining LLWR, it is necessary to know the soil water retention curves and soil resistance to penetration. Undisturbed soil samples were collected between planting rows with an “Uhland” soil sampler, using stainless steel cylinders with an approximate volume of 100 cm-3, in 25 points in the area. Samples were removed at the 0.20-0.30 m layer, taking into account the crop root system effective depth, at 90 days after sowing. These samples were wrapped in plastic film, paraffin-wrapped and conditioned at a temperature of ≈ 5.0 ºC until laboratory analysis.
repetitions per curve. Low and high pressure points were obtained in tension tables and Richards’ plate extractors, respectively. After reaching stability in each of the tensions, sample masses were obtained and tests of soil resistance to penetration were carried out using a bench top electronic penetrometer. Afterwards, samples were dried in an oven at a temperature of 105 ºC, for 24 h, in order to determine water content and soil density.
The functional relationship between matric potential and soil water content was adjusted using the equation described by Silva et al. (1994):
θ = e(a + b . Bd) .ψ c
[1] where θ is the soil water content (m3 m-3), Bd the soil density (Mg3 m-3), ψ the matric potential (hPa) and a, b and c the model adjustment coefficients.
The soil resistance to penetration curve was adjusted using the function employed by Silva et al. (1994):
RP = dθe B d f [2]
where RP is the resistance to penetration (MPa) and d, e,and f are the model adjustment coefficients.
Theleast limiting water range was determined by adopting the procedures described by Silva et al. (1994). Plant growth limiting values were 100 hPa and 15,000 hPa, corresponding to water content at field capacity (θFC) and permanent wilting point (θPWP), respectively (Reichardt 1988), 10 % for aeration porosity (qAP) (Watanabe et al. 2002) and 3 MPa for soil resistance to root penetration (qRP) (Cavalieri et al. 2011). The values for θFC, θPWP and qAP were obtained by the equations 3, 4 and 5, respectively:
θFC = exp. (d + eBd) 100 f [3] θPWP = exp. (d + eBd) 15,000 [4]
θAP=
(
1 - Bd)
- 0.1 [5] Pdwhere Pd stands for particle density (2.65 Mg m-3). Data adjustment and determination for both the soil water retention and soil resistance to penetration curves were conducted using the non-linear regression method.
Air temperature and rainfall climatic data were obtained at the Embrapa Arroz e Feijão automatic weather station, being used to determine the water balance and evapotranspiration. Daily sequential water balance was estimated for the
period between sowing (October 26, 2013) and harvest (March 24, 2014) (Thornthwaite 1948). Daily reference evapotranspiration (ET0) was estimated by the Thornthwaite’s method (1948). Crop evapotranspiration (ETc) was determined by the product of ET0 and crop coefficients (Kc) for each crop development stage, being 0.3, 1.15 and 0.5, for the initial, development and reproduction, and final stages, respectively (Allen et al. 1998). In order to estimate the real evapotranspiration (RET = ETc ∙ Ks), the soil water factor (Ks) was used, according to the following equation:
Ks = AWC - Dr = AWC - Dr [6]
AWC - RAW (1 - p) . AWC
where AWC is the available water capacity (mm), obtained for a root system effective depth of 0.60 m; RAW the readily available water, obtained from AWC and a water availability factor of p = 0.5 root; and Dr the water depth depletion in the rhizosphere region (mm) (Allen et al. 1998).
The crop critical water content (θ1) was estimated by the following equation:
θ1 = θFC -
(
RAW)
[7] Zewhere θFC is the soil water content at field capacity (m3 m-3) and Ze the root system effective depth (m).
RESULTS AND DISCUSSION
The soil water retention and soil resistance to penetration curve equations are shown in equations 8 and 9:
θ = exp. (-0.92 - 0.06Bd ) ψ -0.04 R2 = 0.83 [8]
RP = 0.09ψ -2.02B d
3.35 R2 = 0.65 [9]
For the soil water retention curve, the positive sign of the coefficient related to Bd indicates that the water retention increases with Bd. Estimated coefficients of the model of soil resistance to penetration indicate that Bd positively influenced the penetration resistance, although being negatively influenced by the soil water content.
when aeration porosity replaces field capacity, as the LLWR upper limit. Thus, aeration porosity becomes the plant development limiting factor within the humidity range adopted for irrigation management (field capacityand permanent wilting point). This is due to a reduction in the number of macropores and the consequent increase in microporosity caused by soil compaction (Lanzanova et al. 2007, Suzuki et al. 2007). Thus, aeration becomes deficient under high water content conditions or, as in this case, in humidities lower than that corresponding to field capacity. This indicates that, from this density, according to the LLWR, the irrigation depth should
be established with aeration porosity as upper limit rather than field capacity.
From the density of 1.43 Mg m-3, the lower LLWR limit becomes a permanent wilting point. Root expansion mechanical impedance will interfere with water and nutrients absorption, with a consequent soybean yield decrease (Girardello et al. 2014). Thus, there is soil moisture reduction for irrigation management, according to the LLWR amplitude, due to low O2 diffusion rate in the soil, as well as due to root expansion mechanical impedance.
For the soybean cultivation period, there was a cumulative rainfall of 1,369.80 mm, which is sufficient to keep the soybean yield, which requires 450-850 mm cycle-1 (Embrapa 2003). However, even during the rainy season, when water surplus predominates, water deficit periods occur (Figure 2).
Water balance showed a deficiency of 75.63 mm throughout the cycle, being higher in the months of January and February (23.15 mm and 35.63 mm, respectively), which correspond to the period when vegetative, flowering and grain filling stages occur. Water deficiency at these stages may limit the photoassimilates supply, which may accentuate flower abortion and vegetables abscission, in an attempt by the plant to keep balance between the photoassimilates production and reproductive structures fixation. This process contributes to the reduction of grain weight and number of grains per legume (Maehler et al. 2003, Taiz & Zeiger 2009).
Figure 1. Least limiting water range (LLWR), as a function of
its limiting points: field capacity (θFC), permanent
wilting point (θPWP), resistance to root penetration (θRP),
aeration porosity (θAP) and crop critical water content
(θl), at the 0.20-0.30 m layer, in a soybean-livestock
integration system.
Figure 2. Daily precipitation (P) and soil available water, in terms of surplus, water deficit (DEF) and soil water storage (SWS). The starting point of the soil water storage was described through water depth (mm) and soil water content (θ, m3 m-3).
θ
θθAP θFC θRP θPWP θ1
AP θFC θRP θPWP θl
0.20 0.25 0.30 0.35 0.40 0.45
1.20 1.25 1.30 1.35 1.40 1.45 1.50
θ
(m
3m -3)
Bulk density (Mg m-3)
θ θ θ θ θ1
LLWR
SWS=39.94 mm
θ=0.943 m3m-3
-170 -150 -130 -110 -90 -70 -50 -30 -10 10 30 50 70 90
-15 -5 5 15 25 35 45 55 65 75 85 95 105 115
10/23/13 11/23/13 12/23/13 01/23/14 02/23/14 03/23/14
P
(
mm
d
ay
-1)
A
v
al
iab
le w
at
er
(
m
m
)
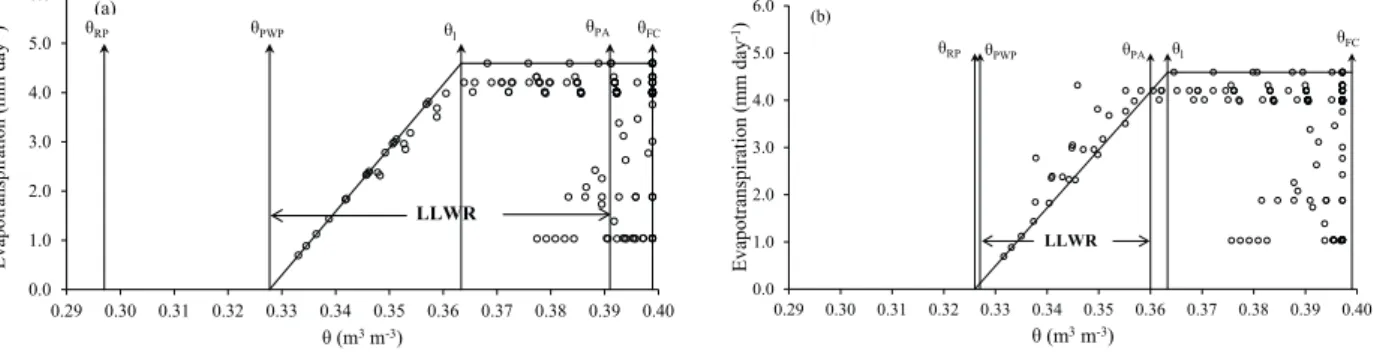
The soil density recorded during the experiment was 1.35 Mg m-3. In this soil density, the LLWR limits are equal to the aeration porosity and permanent wilting point. Thus, irrigations should be performed more often and with lower depths, reducing the aeration impairment drawbacks, which tend to intensify under conditions of heavy water application (Amarante & Sodek 2006) (Figure 3a). Taking the aeration porosity as the upper limit, instead of field capacity, the total available water would become 0.37 m3 m-3, which means a 11.27 % available water capacity reduction. Despite the reduction, the new available water capacity is still sufficient to supply the ETc.
The soil density of 1.43 Mg m-3, where the lower LLWR limit becomes permanent wilting point, indicates soil physical degradation, as it begins to restrict the water range where roots can grow and develop within the available water capacity range (Figure 3b). Using the aeration porosityand soil resistance to root penetration at this density to calculate the available water, an available water capacity reduction of almost 50 % is obtained, which may cause crop yield problems, since this humidity is not enough to supply the ETc, and humidity above that value may impair soil aeration.
Thus, soil management practices should be adopted when the soil density is equal to or higher than 1.43 Mg m-3, since the benefit promoted by irrigation, in relation to optimum production, may not be achieved from an economic point of view. At this density, soil physical factors prevent the proper use of available water.
The narrower the interval between the LLWR upper and lower limits, the greater is the difficulty of managing water for optimum production, even
in the presence of an irrigation system (Tormena et al. 1999).
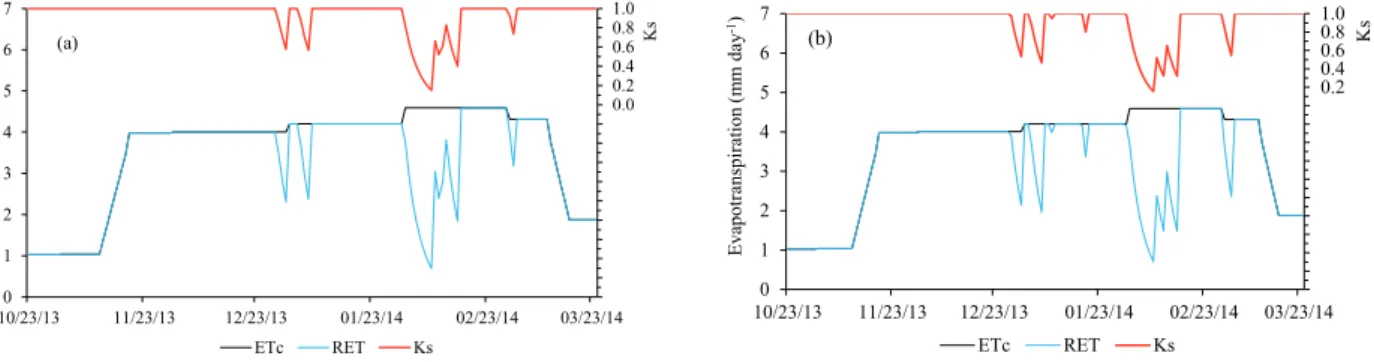
For a soil density of 1.35 Mg m-3, a 7.5 % reduction for real evapotranspiration, in relation to the ETc, was observed (Figure 4a). For the soil density of 1.43 Mg m-3, this reduction was of 9.3 %, indicating an increase of almost 2 % in the difference between the real evapotranspiration and ETc with increasing soil density (Figure 4b). This can also be observed by the Ks, which accompanied the real evapotranspiration, indicating water restriction. In these periods, irrigation would be necessary to avoid a yield decrease, since these periods occur in the vegetative, flowering, grain filling and grain maturation stages. The water deficit occurrence in a non-irrigated crop cycle may reduce yield by 26 %, when compared to plants submitted to irrigation (Almeida et al. 2003).
In crop-livestock integration systems, the high pressures applied by animal hooves and agricultural tires tend to damage the vegetation and deform the soil structure, what may result in soil compaction (Collares et al. 2011). Higher soil density increases the penetration resistance and decreases the aeration porosity, in relation to the water content, replacing the field capacity and permanent wilting point as the upper and lower limits of the LLWR, respectively. LLWR is more sensitive to soil structural changes than individual parameters evaluated (Silva et al. 1994).
In order to obtain an optimum crop production, it is necessary to take into account not only the conventional limits of water availability range, but also factors such as aeration porosity and soil resistance to penetration (Tormena et al. 1999). Thus, the LLWR-based irrigation management is more
Figure 3. Variation of crop evapotranspiration, as a function of soil moisture for the densities of 1.35 Mg m-3 (a) and
1.43 Mg m-3 (b), within the limits of the least limiting water range: field capacity (θ
FC), permanent wilting point (θPWP),
resistance to root penetration (θRP), aeration porosity (θAP) and crop critical water content (θl), at the 0.20-0.30 m layer,
in a soybean crop-livestock integration system.
0.0 1.0 2.0 3.0 4.0 5.0 6.0
0.29 0.30 0.31 0.32 0.33 0.34 0.35 0.36 0.37 0.38 0.39 0.40
E
va
pot
ra
ns
pi
ra
ti
on
(m
m
da
y
-1)
θ(m3m-3)
θFC
θRP θPWP θl θPA
(a)
LLWR
0.0 1.0 2.0 3.0 4.0 5.0 6.0
0.29 0.30 0.31 0.32 0.33 0.34 0.35 0.36 0.37 0.38 0.39 0.40
E
va
potr
an
sp
ir
ati
o
n (
m
m
da
y
-1)
θ(m3m-3)
θFC
θRP θPWP θPA θl
(b)
efficient and complete than irrigation management based only on available water, as water absorption does not depend only on its availability.
CONCLUSIONS
1. Irrigation management based on the least limiting water rangeis more efficient and complete than irrigation based on available water only;
2. The soil water availability based on the least limiting water range was 0.37 m3 m-3, in a soybean crop-livestock integration system;
3. Soil management aimed atsoil density reduction should be adopted when values are equal to or greater than 1.43 Mg m-3, as it interferes with soybean growth and root system development, consequently interfering with water absorption.
REFERENCES
ALLEN, R. G. et al. Crop evapotranspiration. Rome:
FAO, 1998. (FAO irrigation and drainage paper, 56).
ALMEIDA, A. M. et al. Molecular and physiological
mechanisms of flooding avoidance and tolerance in rice.
Russian Journal of Plant Physiology, v. 50, n. 6, p.
743-751, 2003.
AMARANTE, L.; SODEK, L. Waterlogging effect on xylem sap glutamine of nodulated soybean. Biologia
Plantarum, v. 50, n. 3, p. 405-410, 2006.
ARAUJO, M. A. et al. Modelos agrometeorológicos na
estimativa da produtividade da cultura da soja na região
de Ponta Grossa, Estado do Paraná. Acta Scientiarum
Agronomy, v. 33, n. 1, p. 23-31, 2011.
CASAROLI, D. et al. Validation of a root water uptake model to estimate transpiration constraints. Agricultural
Water Management, v. 97, n. 9, p. 1382-1388, 2010.
CAVALIERI, K. M. V. et al. Qualidade física de três solos sob colheita mecanizada de cana-de-açúcar. Revista
Brasileira de Ciência do Solo, v. 35, n. 5, p. 1541-1549,
2011.
COLLARES, G. L. et al. Compactação superficial de
Latossolos sob integração lavoura-pecuária de leite no noroeste do Rio Grande do Sul. Ciência Rural, v. 41, n. 2, p. 246-250, 2011.
E M P R E S A B R A S I L E I R A D E P E S Q U I S A AGROPECUÁRIA (Embrapa). Tecnologias de produção
de soja: região central do Brasil, 2004. Londrina: Embrapa
Soja, 2003. (Sistemas de produção, 4).
FANTE, C. A. et al. Respostas fisiológicas em cultivares de soja submetidas ao alagamento em diferentes estádios.
Bragantia, v. 69, n. 2, p. 253-261, 2010.
GIRARDELLO, V. C. et al. Resistência à penetração, eficiência de escarificadores mecânicos e produtividade da soja em Latossolo argiloso manejado sob plantio direto
de longa duração. Revista Brasileira de Ciência do Solo, v. 38, n. 4, p. 1234-1244, 2014.
LANZANOVA, M. E. et al. Atributos físicos do solo
em sistema de integração lavoura-pecuária sob plantio direto. Revista Brasileira de Ciência do Solo, v. 31, n. 4,
p. 1131-1140, 2007.
LETEY, J. Relationship between soil physical properties and crop production. Advances in Soil Science, v. 1, n. 1,
p. 277-294, 1985.
LIBARDI, P. L. Dinâmica da água no solo. São Paulo:
Edusp, 2005.
MAEHLER, A. R. et al. Potencial de rendimento da soja durante a ontogenia em razão da irrigação e arranjo de
plantas. Pesquisa Agropecuária Brasileira, v. 38, n. 2, p. 225-231, 2003.
PINTO JUNIOR, O. B. et al. Transpiração pelo método
da sonda de dissipação térmica em floresta de transição
Amazônica-Cerrado. Revista Brasileira de Engenharia
Agrícola e Ambiental, v. 17, n. 3, p. 268-274, 2013.
Figure 4. Crop evapotranspiration (ETc), real evapotranspiration (RET) and soil water factor (Ks), for densities of 1.35 Mg m-3 (a)
and 1.43 Mg m-3 (b), in a soybean crop-livestock integration system.
-2.0 -1.8 -1.6 -1.4 -1.2 -1.0 -0.8 -0.6 -0.4 -0.2 0.0 0.2 0.4 0.6 0.8 1.0 0 1 2 3 4 5 6 7
10/23/13 11/23/13 12/23/13 01/23/14 02/23/14 03/23/14
Ks E va pot ra ns pi ra ti on (m m da y -1)
ETc RET Ks
(a) -2.0 -1.8 -1.6 -1.4 -1.2 -1.0 -0.8 -0.6 -0.4 -0.2 0.0 0.2 0.4 0.6 0.8 1.0 0 1 2 3 4 5 6 7
10/23/13 11/23/13 12/23/13 01/23/14 02/23/14 03/23/14
Ks E v apot ra ns pi ra ti on ( m m da y -1)
167
Water availability to soybean crop as a function of the least limiting water range and evapotranspiration
REICHARDT, K. Capacidade de campo. Revista
Brasileira de Ciência do Solo, v. 12, n. 3, p. 211-216,
1988.
SANT’ANA, J. A. V. et al. Desempenho de sondas de TDR manufaturadas de diferentes comprimentos de hastes. Revista Brasileira de Ciência do Solo, v. 36, n. 4,
p. 1123-1129, 2012.
SILVA, A. P. et al. Characterization of the least limiting water range. Soil Science Society of America Journal, v. 58,
n. 6, p. 1775-1781, 1994.
SILVA, S. C. et al. Informações meteorológicas para
pesquisa e planejamento agrícola, referentes ao município
de Santo Antônio de Goiás. Santo Antônio de Goiás:
Embrapa Arroz e Feijão, 2007.
SUZUKI, L. E. A. S. et al. Grau de compactação,
propriedades físicas e rendimento de culturas em Latossolo
e Argissolo. Pesquisa Agropecuária Brasileira, v. 42, n. 8,
p. 1159-1167, 2007.
TAIZ, L.; ZEIGER, E. Fisiologia vegetal. Porto Alegre: Artmed, 2009.
THORNTHWAITE, C. W. An approach toward a rational classification of climate. Geographical Review, v. 38, n. 1,
p. 55-94, 1948.
TORMENA, C. A. et al. Intervalo ótimo de potencial da
água no solo: um conceito para avaliação da qualidade física do solo e manejo da água na agricultura irrigada.
Revista Brasileira de Engenharia Agrícola e Ambiental,
v. 3, n. 3, p. 286-292, 1999.
WATANABE, S. H. et al. Propriedades físicas de um Latossolo Vermelho Distrófico influenciadas por sistemas