http://dx.doi.org/10.1590/s2175-97902018000100265
Article
*Correspondence: G. Kantarcı. Department of Pharmaceutical Biotechnology,
Faculty of Pharmacy, Ege University, Bornova, İzmir, 35100, Turkey. E-mail: [email protected]
Preparation and characterization of non-viral gene delivery systems
with pEGFP-C1 Plasmid DNA
Uğur Karagöz
1, Mustafa Kotmakçı
1, Hasan Akbaba
1, Vildan Bozok Çetintaş
2, Gülten Kantarcı
1*
1Department of Pharmaceutical Biotechnology, Faculty of Pharmacy, Ege University, Bornova, Izmir, Turkey, 2Department of
Medical Biology, Faculty of Medicine, Ege University, Bornova, Izmir, Turkey
In recent years, non-viral delivery systems for plasmid DNA have become particularly important. They can overcome the disadvantages of viral systems such as insertional mutagenesis and unpredicted immunogenicity. Some additional advantages of non-viral gene delivery systems are; good stability, low cost, targetability, delivery of a high amount of genetic materials. The aim of the study was to develop novel non-viral nanosystems suitable for gene delivery. Two formulations were developed for this purpose: water-in-oil microemulsion (ME) and solid lipid nanoparticles (SLN).The microemulsion was composed of Peceol, Tween 80, Plurol oleique, ethanol and water. The SLN was consisting of Precirol, Esterquat-1 (EQ1), Tween 80, Lecithin, ethanol and water. Characterization studies were carried out by measuring particle size, zeta potential, viscosity and pH. TEM imaging was performed on SLN formulations. Protection against DNase I degradation was examined. Cytotoxicity and transfection efficacy of selected formulations were tested on L929 mouse fibroblast cells.Particle sizes of complexes were below 100 nm and with high positive zeta potential. TEM images revealed that SLNs are spherical. The SLN:DNA complexes have low toxicity and good transfection ability.All results showed that the developed SLN formulations can be considered as suitable non-viral gene delivery systems.
Keywords:Microemulsion. Solid lipid nanoparticle. DNA delivery. Transfection.
INTRODUCTION
Gene therapy using plasmid DNA molecules for specific diseases gained great importance in last decades. The main purpose of gene therapy is replacing diseased genes with new healthy ones. Selection of a proper gene delivery system is a very important issue when considering gene therapy because naked plasmid DNA (pDNA) is rapidly degraded following administration to the human body (Park et al., 2015). There are several
methods developed for gene delivery. Generally, these methods can be divided into two main groups; 1) methods applying viral delivery systems, 2) methods applying non-viral delivery systems. Viral gene delivery systems have been the main choice during early gene therapy trials (Jomary et al., 1994; Edelstein et al., 2004).
However, there were important drawbacks concerning the safety of these systems. For example, unpredicted
immunogenicity and insertional mutagenesis are very dangerous adverse reactions that can develop after the treatment (Hackett et al., 2013; Solinís et al., 2014).
Because of these complications, researchers developed non-viral gene delivery systems. Nowadays in gene delivery trials non-viral delivery systems are preferred over viruses because of their safety (Fornaguera et al., 2015). In addition, these systems possess other
advantages such as good stability, targetability to specific sites, ability to deliver a high amount of materials, high therapeutic efficacy and low cost. However, non-viral vectors possess some disadvantages too. One of these disadvantages is that non-viral systems exhibit lower delivery efficacy than viral vectors (Mellott et al., 2013).
Also, another important issue is their low transfection efficiency. Challenges in preserving the DNA intact during transportation in the biological fluids, low rate of endosomal escape and poor nuclear entry are known to contribute to the lower transfection efficiency of non-viral gene delivery systems (Glinka, 2012).
gene delivery systems. SLNs have a particle size distribution varying from approximately 50 nm to 1000 nm (Carrillo et al., 2013). Cationic SLNs are especially
promising systems for gene delivery purposes (Severino
et al., 2015). They are good alternatives to conventional
formulations such as nanoemulsions and liposomes for gene delivery because of their good physical stability and biocompatibility (Jin, Kim, 2014). It is known that positively charged nanoparticles are most likely to be taken by cells via electrostatic interaction with negatively charged cell membranes (Jin, Kim, 2014; Remaut et al.,
2014). They are easily and cost effectively produced in large scale, and easy to generate. To transfect cells, these systems need a positive surface charge which can be provided by adding cationic lipids such as etylpyridinium chloride, cetyltrimethylammonium bromide (CTAB), dimethyldioctadecylammonium (DDAB), N-[1-(2,3-dioleoyloxy)-propyl]-N,N,N-trimethylammonium methyl-sulfate (DOTAP) and esterquat-1 which are some of the most widely used cationic lipids for obtaining cationic SLNs (Severino et al., 2015). The advantages of cationic
SLNs are their good biocompatibility and low toxicity. These properties make them suitable for application by various routes (nasal, oral, ocular, topical, intravenous etc.) (Fàbregas et al., 2014). Another important advantage of
SLNs is the ability to be produced from hot microemulsion intermediates.
MEs are thermodynamically stable colloidal systems that form spontaneously under certain ratios of ingredients. MEs contain at least three main components; oil, emulsifier and water. MEs are easy to produce because of the self-assembling ability of the components. The most important property of MEs is to provide protection of encapsulated compounds (Chatzidaki et al., 2015). Water droplets formed in water-in-oil (W/O)
microemulsions are good candidates for confining DNA. Because of DNA’s high water solubility, it can be easily incorporated into the inner water phase of a W/O microemulsion (Swami et al., 2008). The high
viscosity of W/O MEs increases the stability and makes them suitable for topical application (Kajbafvala et al.,
2016; Callender et al., 2017). Chitosan is a widely used
excipient in pharmaceutical formulations. It is regarded as non-toxic and biocompatible material (Shaji, Jain, Lodha, 2010) and is widely used as a DNA condensing
cationic polymer.
The first aim of this study was to develop and characterize a non-toxic solid lipid nanoparticle system employing hot o/w microemulsion dilution technique. The second aim was to prepare and characterize a w/o microemulsion formulation for plasmid DNA delivery.
MATERIALS AND METHODS
Materials
Trizma base, Ethylenediaminetetraacetic acid (EDTA), sodium dodecyl sulfate (SDS), Didecyldimethylammonium bromide (DDAB), Cetyl trimethylammonium bromide (CTAB), Tween 80, Chitosan (medium molecular weight), Phenol, 1-propanol and Span 80 were purchased from Sigma Aldrich GmbH (Steinheim, Germany). Soybean Lecithin (90% phosphatidylcholine) and Phosphate-buffered saline (PBS) tablets (pH: 7.4) were purchased from AppliChem GmbH (Darmstadt, Germany). XTT cell proliferation kit, Dulbecco’s Modified Eagle’s medium (DMEM), fetal bovine serum (FBS), trypsin, L-glutamine and penicillin-streptomycin were purchased from Biological Industries (Beit-HaEmek, Israel). Precirol ATO-5, Labrafac PG, Labrafac Lipophile, Plurol Oleique CC, Lauroglycol FCC, Lauroglycol 90, Capryol PGMC, Labrafil M and Peceol were donated by Gattefossé (Cedex, France). DNase I (Enzyme I) was purchased from Biolabs (New England, USA). Ethanol was purchased from Merck KgaA (Darmstadt, Germany). Glacial acetic acid was purchased from Atabay Kimya (İstanbul, Turkey). Esterquat-1 (N,N-di-(β-stearoylethyl)-N,N-dimethyl ammonium
chloride) was purchased from Gerbu Biotechnik GmbH (Heidelberg, Germany). Agarose was purchased from Conda Laboratories (Madrid, Spain). Ethidium bromide was purchased from Fluka Chemie GmbH (Steinheim, Germany). pEGFP-C1 plasmid DNA and maxiprep plasmid DNA purification kit were purchased from Invitrogen (Carlsbad, CA, USA). DNA molecular weight standards (100bp and 1000bp) and DNase I (Enzyme II) were purchased from Fermentas, ThermoFischer Scientific (Waltham, Massachusetts, USA).
Plasmid DNA
pEGFP-C1 from Invitrogen (Carlsbad, CA, USA), which encodes green fluorescence protein (GFP) under CMV promoter, was used as the model plasmid in this study. pEGFP-C1 plasmid DNA was amplified in
Escherichia coli JM109 strain and purified with Invitrogen
maxiprep plasmid DNA purification kit (Carlsbad, CA, USA) according to manufacturer’s instructions.
The integrity of the plasmid was assessed by restriction enzyme digestion, followed by agarose gel electrophoresis.
by measuring the absorbance of samples at 260/280 nm wavelengths. After isolation and purification, the plasmid DNA was diluted to 100 µg/mL and stored at -20 oC until
use.
Preparation of formulations
Preparation of SLN formulations
SLNs were produced by using hot microemulsification method. Microemulsions were obtained with Precirol ATO-5 as the solid lipid, Tween 80 and Soybean lecithin as hydrophilic and lipophilic surfactants, respectively, and ethanol as the cosurfactant (Cos). Tween 80 and lecithin were used at a ratio of 2:1 (wt/wt) and represented the surfactant (S) phase, and the S/Cos ratio was 1:2 (wt/wt). For obtaining cationic SLNs either Esterquat-1 or CTAB were included in the composition of formulations.
Briefly, Precirol (100 mg), S/Cos (1440 mg), cationic lipid (56 mg) and water (2400 mg) were weighed and mixed with magnetic stirrer at 1500 rpm. The mixture was heated at 10 °C above the melting point of Precirol ATO-5 and a transparent hot microemulsion was obtained. Subsequently the microemulsion was rapidly transferred into 20 ml cold water and SLN dispersion was formed (Kotmakçı et al., 2016).
Preparation of W/O ME formulation
Following materials were selected to construct pseudo-ternary phase diagram; Peceol (HLB: 1) as the oil phase, Plurol oleique (HLB: 6) and Tween 80 (HLB: 15) as surfactants and Ethanol as co-surfactant. The purpose of generating phase diagram was to find optimum concentration ranges for formulation. Oil, S and Cos mixture which consist of predetermined amounts of the ingredients was titrated by adding 10 µL portions of water each time, and the appearance of the system was visually observed. The point where the appearance of the mixture turns to blurry was noted for each sample and used for the construction of the phase diagram. Titration was performed with constant stirring rate (300 rpm) at room temperature. Optimal ME existence areas were determined with phase diagrams drawn by means of a software developed at Ege University Faculty of Pharmacy (Ege, Karasulu, Güneri, 2004).
Chitosan was used for providing cationic charge to MEs. Chitosan solution was prepared by dissolving chitosan with 1 % (v/v) glacial acetic acid (final chitosan concentration 0.3 % (wt/wt)). In order to obtain cationic ME, stable transparent w/o systems were selected from the phase diagrams and chitosan solution was added to these systems as the water phase.
Preparation of Cationic SLN:DNA complexes
To obtain the optimum complexation ratio, the following cationic SLN-to-plasmid DNA ratios were tested; 1:1, 2:1, 3:1, 4:1, 5:1, 7:1, 10:1 (v/v). Complexation was achieved at room temperature under stirring with vortex (300 rpm) for 30 minutes. Concentration of DNA working solution was 100 µg/mL.
Confinement of DNA in ME formulation
To confine the DNA in the ME formulation, first Chitosan:DNA complex was prepared. Chitosan solution (0.003 mg/mL) and DNA solution (100 µg/mL) were mixed at 1:1 (v/v) ratio and stirred with vortex (300 rpm) for 30 minutes at room temperature. Subsequently, the Chitosan:DNA complex dispersion was used as the water phase for the microemulsion.
Characterization studies
Particle size distribution
Particle size distribution of cationic SLNs was determined by dynamic light scattering using Malvern Zetasizer Nano ZS (Malvern Instruments, UK). Low volume disposable polystyrene cuvettes were used for size measurements. Formulations were diluted 10 fold with ultrapure water and the measurements were performed at 25 °C. Particle size was measured in triplicate and mean zeta average diameter (±SD) was reported.
Zeta potential measurement
Zeta potential value of cationic SLNs was measured with Malvern Zetasizer Nano ZS (Malvern Instruments, UK). Standard zeta cuvettes were used and the working temperature was set to 25 °C during zeta potential measurements. Values were measured in triplicate and mean value (± SD) was presented.
pH measurement
pH value of formulations was measured with SevenGo Duo SG 23 pH meter (Mettler Toledo Ohio, USA) at room temperature.
Refractive index and Viscosity measurements
TEM (Transmission Electron Microscopy) analysis
The morphology of formulations was investigated with FEI Tecnai G2 high contrast transmission electron
microscope (FEI Co., USA). Approximately 10 µL samples were placed on carbon coated 200 mesh copper grids and allowed to dry overnight at room temperature. Observations were carried out at 120 kV.
SDS-induced DNA release study
The release of DNA from the SLNs was assessed with agarose gel electrophoresis. SDS was added immediately after complex formation. Following 5 minutes incubation at 25°C, samples were loaded on 1% agarose gel for electrophoresis. Two SLN:DNA ratios were tested - 1:1 and 1:2 (v/v). Optimal SDS amount was determined by applying the following SDS percentages to gel; 0.5, 1, 1.5, 2, 2.5.
DNase I protection study
Two different commercial DNase I enzymes were used for this study (Fermentas, ThermoFischer Scientific (Waltham, Massachusetts, USA) and Biolabs, (New England, USA)). SLN:DNA ratios were 1:1 and 1:2 (v/v). 0.4 IU DNase I was applied per each 1 µg DNA.
After complex formation DNase I was added and incubated for 30 minutes at 37oC in a heating water bath.
Subsequently, SDS (%1) was added to release the DNA for analysis and incubated as described above. Samples were loaded to %1 agarose gel. Electrophoresis was carried out for 1 hour at 100 volts.
Cell culture
All cell culture studies were carried out on L929 mouse fibroblast cell line, as it is a commonly used cell line. Formulations were freshly prepared and SLN:DNA complexes were obtained immediately before the application.
Cytotoxicity study
Cytotoxicity of formulations was estimated by measuring cell viability with XTT cell proliferation assay. For this purpose, cells were inoculated in 96 well plates at a density of 6x10³ cells/well. Plates were
incubated for 24 h at 37 oC in a humidified atmosphere
(%5 CO2) to allow the cell to adhere to the wells. After
24 hours, cells were treated with SLNs and SLN:DNA complexes at the following doses; 3, 5, 7, 10, 15, 20 µL/ well. Each dose was applied to the wells in a final volume
of 100 μL. After another 24 hours of incubation, cells were washed with PBS and fresh medium was added. 50 µL of XTT solution was added to each well. After 150 minutes of incubation, absorbance was measured at 450-630 nm using Varioskan Flash microplate reader (ThermoFisher Scientific, USA). Untreated cells were used as control group.
Transfection ability
Doses with low toxicity (3 µL and 5 µL) were used in transfection studies. Transfection ability was evaluated under a fluorescence microscope (Olympus, Japan). In order to evaluate the transfection ability considering vitality, cells were stained with DAPI (4’,6-diamidino-2-phenylindole) for 1-5 min after performing the transfection.
Stability
SLNs in suspension form were evaluated for change in particle size, zeta potential and PDI with Nicomp 380 ZLS (Particle Sizing Systems, USA) for two months. ME formulation was observed visually for clarity and phase separation for two years. Formulations were stored at room temperature.
Statistical analysis
All results are presented as mean ±SD of at least three measurements. Statistical analysis was performed using Student’s t-test and analysis of variance (ANOVA). A “p” value of less than 0.05 was considered significant.
RESULTS
ME formulation
As shown in Figure 1, pseudo ternary phase diagram was constructed by titration procedure with water. Optimal S:Cos ratio was 1:1 (wt/wt). The selected microemulsion formulation is presented as a black point on the microemulsion area and consists of 28 % Peceol, 21 % Plurol Oleique, 7 % Tween 80, 28 % ethanol, and 16 % water.
DNA-SLN complexation
Figure 2 shows the agarose gel photograph of samples tested for complexation at different SLNEQ1:DNA
In this preliminary study, it was seen that increasing SLN ratio from 1:1 to 2:1 has no significant effect on DNA release. It was also seen that 1% SDS will be appropriate for further studies. We aimed to compare cationic SLNs prepared with different cationic lipids in terms of complexation and SDS induced DNA release. According to the (Figure 4) lane 6 and lane 7, both formulations released DNA properly in the presence of 1% SDS.
Figure 5 shows the agarose gel photograph of SLNEQ1 for DNase I protection study. Lane 2 is the negative control (untreated plasmid). According to lane 2, uncomplexed DNA was fully digested by the DNase I. Lanes 3-10, show the protection of SLNEQ1
formulation against two different nuclease enzymes at FIGURE 1 - Pseudo ternary phase diagram obtained with peceol,
plurol oleique, T80 and ethanol. S/Cos ratio: (1:1). Grey area represents W/O microemulsion formation area. Black dot represents the selected W/O microemulsion
FIGURE 2 - Agarose gel photograph showing SLNEQ1:DNA
complexation. Lane 1: GeneRuler 1 kb DNA ladder; Lane 2: SLN; Lane 3: naked DNA as control; Lane 4: SLN:DNA 1:1; Lane 5: SLN:DNA 2:1; Lane 6: SLN:DNA 3:1; Lane 7: SLN:DNA 4:1; Lane 8: SLN:DNA 5:1; Lane 9: SLN:DNA 7:1; Lane 10: SLN:DNA 10:1.
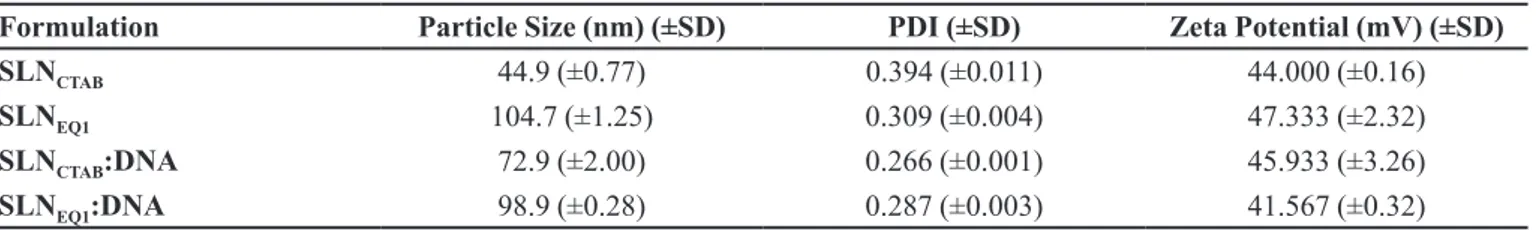
TABLE I - Particle size, PDI and Zeta potential values of SLN formulations (n=3)
Formulation Particle Size (nm) (±SD) PDI (±SD) Zeta Potential (mV) (±SD)
SLNCTAB 44.9 (±0.77) 0.394 (±0.011) 44.000 (±0.16)
SLNEQ1 104.7 (±1.25) 0.309 (±0.004) 47.333 (±2.32)
SLNCTAB:DNA 72.9 (±2.00) 0.266 (±0.001) 45.933 (±3.26)
SLNEQ1:DNA 98.9 (±0.28) 0.287 (±0.003) 41.567 (±0.32)
SD: standard deviation, SLNCTAB: SLN formulation prepared with CTAB as the cationic lipid, SLNEQ1: SLN formulation prepared with EQ1 as the cationic lipid.
Characterization of obtained microemulsion, SLNs and SLN:DNA complexes
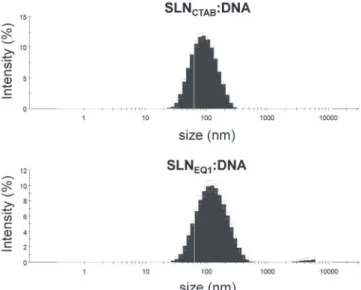
pH values of SLNEQ1 and ME formulations were determined as 3.9 and 3.4, respectively. Viscosity and refractive index values of ME formulation were obtained as 36 cP and 1.42, respectively. Table I shows the particle size, PDI and zeta potential values of SLN formulations and SLN:DNA complexes. Figure 3 shows the intensity-size distribution of SLN:DNA formulations.
SDS induced DNA release and protection against DNase I degradation
two different SLNEQ1:DNA ratios (1:1 and 1:2 (v/v)). DNase I protection study results of SLNCTAB were not
given because the formulation was determined to be cytotoxic on L929 cells.
Cytotoxicity and transfection of L929 cells
Cytotoxicity and transfection abilities of formulations were tested on L929 mouse fibroblast cells. 5, 7, 10, 15, 20 µL/well doses were tested. Cell viability after treatment with the ME, ME:DNA, SLNs and SLN:DNA formulations were presented in Figure 6.
Figure 7 shows the transfection ability of selected formulations. Blue colored images indicate DAPI staining. DAPI staining shows living cells under an inverted microscope. Green color indicates fluorescence from GFP expressed in the cells.
Stability
ME formulation was observed visually for 2 years. No turbidity or phase separation was determined during this period. The formulation was stored in a dry atmosphere in the dark in sealed glass vials. The storage temperature was 25 °C.
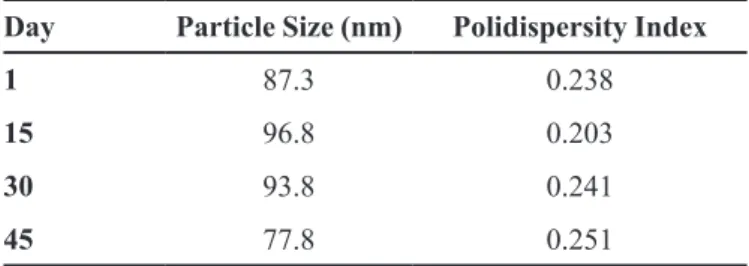
The SLNEQ1 formulation in suspension form was observed for 6 weeks for particle size and PDI change. The formulation was stored as described for ME. At the end of the 45th day, stability study was terminated because
of turbidity formation. Measurement results are presented in Table II.
TEM analysis
ME formulation could not be visualized because of its high oil content. SLNEQ1 and SLNEQ1:DNA formulations were imaged with transmission electron microscope. TEM micrographs can be seen in Figure 8. The morphology of SLNs appeared to be spherical (Figure 8A). On the other hand, the morphology of SLNEQ1:DNA complexes are observed to be granular (Figure 8B).
DISCUSSION
Microemulsion formulations have advantages for FIGURE 3 - Intensity-size distribution graphs of SLN:DNA
complexes.
FIGURE 4 - Comparison of SLNEQ1 and SLNCTAB formulations
for complexation and SDS induced DNA release abilities. Lane 1: naked plasmid DNA as control; Lane 2: SLNEQ1; Lane 3: SLNCTAB; Lane 4: SLNEQ1:DNA (1:1); Lane 5: SLNCTAB:DNA(1:1); Lane 6: SLNEQ1:DNA treated with %1 SDS; Lane 7: SLNCTAB:DNA treated with %1 SDS.
FIGURE 5 - DNase I protection of SLNEQ1:DNA complexes. Lane
DNA delivery because of their transparent appearance, spontaneous formation and thermodynamical stability. The optical density of formulations can provide indications about the reproducibility of formulations. Monitoring the solubilization is another advantage for transparent formulations (Ulrich, 2002). Besides, cationic materials (in this case chitosan), that facilitate DNA encapsulation in microemulsions, can easily be incorporated into the formulation (Lee et al., 2010). Another advantage of
W/O microemulsion is confining and protecting DNA in its inner phase (Baroli et al., 2000). In this study, Plurol
oleique was selected as a lipophilic surfactant because of its ability to create transparent ME systems. Employing Plurol oleique, the HLB value of the system was decreased
dramatically. To adjust HLB value which is appropriate for w/o ME system, Tween 80 was used as a hydrophilic surfactant. The location of selected formulation in ME area can be seen in Figure 1. HLB value of ME system was calculated as 5.63. The viscosity of ME was 36 cP, which is an appropriate value for topically administered formulations. It was previously shown that increasing viscosity values renders MEs suitable for topical application.
SLNs are good delivery tools for genetic materials. Factors such as the protection of genetic materials from degradation and efficient delivery potential into cells make SLNs a perfect choice for gene delivery purposes (Torrecilla et al., 2015). In this study, Precirol ATO5 was
used as the oil phase for SLN formulation. Ethanol was used as the co-surfactant, because of its ability to easily dissolve lecithin and its non-toxic characteristics. For an efficient transfection, the particle size of formulations should be approximately 100 nm because transfection activity strongly depends on the cellular uptake (Ulrich, 2002). SLNCTAB (44.9 nm) and SLNEQ1 (104.7 nm)
formulations have a suitable particle size for DNA delivery. PDI values of SLN formulations are 0.3 which is acceptable for monodisperse systems (Gaur et al., 2014).
SLN systems with zeta potential greater than ±30 mV can
be considered as stable systems (Ulrich, 2002; Carrillo et al., 2013). As shown in Table I the zeta potential values
of developed formulations are sufficiently high, so these formulations can be considered stable systems (Carrillo
et al., 2013; Fàbregas et al., 2014).
Considering its small particle size, SLNCTAB
appeared as a suitable formulation. However, it was highly cytotoxic. On the other hand, the cytotoxicity of SLNEQ1
was more acceptable in comparison with that of SLNCTAB.
As shown in Figure 6, SLNEQ1:DNA complex exhibited
approximately 80% cell viability at the dose 7 µL/well, which is suitable for cell culture studies. According to previous studies it is generally accepted that a zeta potential greater than +25 mV is appropriate for SLNs forming complexes with DNA (Fàbregas et al., 2014).
SLNEQ1 showed high positive zeta potential (+47.3 mV),
which is essential for the formation of stable complexes with DNA. Determining the optimum SLN:DNA ratio provides insights about maximum DNA amount that can be loaded to a given formulation (Fàbregas et al., 2014).
From Figure 2, it can be seen that the ratio of 1:1 (SLN-to-DNA) is optimal. At this complexation ratio, all DNA molecules are entrapped by the complex and show no FIGURE 7 - Transfection ability of formulations (A and
B: ME:DNA 5 µL, C and D: SLNEQ1:DNA 3 µL, E and F: SLNEQ1:DNA 5 µL, G and H: Control (naked DNA+L929 cells)). A,C,E,G images represent DAPI staining; B,D,F,H images represent fluorescence visualization.
mobility during electrophoresis. As can be seen from the lanes 6-10 in Figure 2, the complex enters the gel at the opposite side. Considering this fact, it can be suggested that at higher SLN-to-DNA ratios, the complex becomes more positively charged and its movement is observed to be towards the cathode.
As it can be seen in Figure 3 both SLN:DNA complexes have narrow size distributions. Comparison of SLNCTAB and SLNEQ1 can be seen in Figure 4. Gel image
confirms the zeta potential measurements. According to Figure 4 (lanes 4 and 5), CTAB contributed to production of cationic SLNs with higher positive charge than EQ1. Lanes 6 and 7 indicate that both SLNEQ1 and SLNCTAB are
able to release DNA in the presence of SDS.
In order to obtain more reliable results, two different commercial enzymes were used for DNase I protection assay. According to lane 2 in Figure 5, naked DNA was completely digested by DNase I enzyme. DNA is in supercoiled form and only small amounts of nick DNA are observed in the wells loaded with the complexes. According to these results, all SLNEQ1:DNA complexes
are protecting DNA from enzymatic degradation. SLNCTAB:DNA results were not given because of its poor
cytotoxicity results.
Agarose gel electrophoresis studies couldn’t be performed on ME formulations due to their high content of oil which makes them impossible to load on agarose gel wells.
The cytotoxicities of all formulations were dose dependent except SLNCTAB formulations (Figure 6). The ME showed approximately 60% viability for the doses 5, 7 and 10 µL/well. The cytotoxicity decreases when DNA complexed with ME. ME:DNA formulation showed approximately 80% viability for the doses 3 and 5 µL/ well (significantly higher than ME, p<0.0025). At higher doses, cell viability decreased drastically. Therefore, doses higher than 5 µL/well were accepted as cytotoxic and were not tested for the transfection experiments. SLNEQ1:DNA complexes showed 80% cell viability at
the dose 7 µL/well, so 3,5,7 µL/well doses were safely used for transfection studies. Moreover, the viability of cells treated with SLNEQ1:DNA at the dose 5 µL/well was not significantly reduced as compared to the control group (p=0.2867). SLNCTAB showed high toxicity on L929 cells at all tested doses. Therefore, this formulation was not included in any further experiment. DAPI binds to A-T rich regions of DNA and shows living cells in blue color. Merging DAPI-stained and GFP filter micrographs provides information about the transfection ability.
As shown in Figure 7 A and B, a small number of transfected cells were observed with ME:DNA. ME
formulation contains DNA in its inner phase. Because of the fact that the volume of the inner phase is very low (%16), the ME system contains a small amount of DNA (0.04 µg DNA in 5 µL dose). However, SLN 5 µL dose contains 0.25 µg DNA in 1:1 (v/v) complexation rate.
As shown in Table II, the particle size of SLNEQ1 decreased slightly during the storage period. However, this decrease is not an abnormal situation exactly. Related literature shows that SLNs’ particle sizes could decrease during storage nearly to 30-40% (del Pozo-Rodríguez
et al., 2009). After 45 days of storage, formulations’
appearance became cloudy. That was a sign that SLNs’ integrity was breaking down. Therefore, stability measurements were terminated at this point (Bose, Michniak-Kohn 2013; Dolatabadi et al., 2014). The
stability of ME was monitored by visual inspection for 2 years. No change in the appearance was observed during this period.
According to TEM images, the shape of SLNEQ1 is
spherical and the size of particles is about 50 nm (Figure 8 A). As shown in Figure 8 panel B, pDNA is successfully complexed with SLNEQ1 and the morphology of the complex appears wrinkled. TEM images reflects particle size more directly than the DLS measurements (Lee et al., 2013).
CONCLUSIONS
In conclusion, two non-viral DNA carrier systems were developed and evaluated for plasmid DNA delivery. Because of its high viscosity, microemulsion system is suitable for topical application. Cytotoxicity of formulations can be adjusted by screening for safe doses as evidenced by cytotoxicity studies. In this study, at lower non-toxic doses SLNEQ1:DNA complexes provided good transfection efficiency with EGFP-encoding plasmid DNA. The SLN formulation described in this study is suitable for investigating novel treatment modalities for various disease models by replacing EGFP-encoding plasmid DNA with therapeutic gene-encoding plasmids. TABLE II - Stability of SLNEQ1 at room temperature for
1.5 months
Day Particle Size (nm) Polidispersity Index
1 87.3 0.238
15 96.8 0.203
30 93.8 0.241
ACKNOWLEDGEMENT
This study was supported by the Scientific Research Fund of Ege University (project No: 13-ECZ-019).
REFERENCES
Baroli B, López-Quintela MA, Delgado-Charro MB, Fadda AM, Blanco-Méndez J. Microemulsions for topical delivery of 8-methoxsalen. J Control Release. 2000;69(1):209-18.
Bose S, Michniak-Kohn B. Preparation and characterization of lipid based nanosystems for topical delivery of quercetin. Eur J Pharm Sci. 2013;48(3):442-52.
Callender SP, Mathews JA, Kobernyk K, Wettig SD. Microemulsion utility in pharmaceuticals: Implications for multi-drug delivery. Int J Pharm. 2017;526(1-2):425-442.
Carrillo C, Sánchez-Hernández N, García-Montoya E, Pérez-Lozano P, Suñé-Negre JM, Ticó JR, etal. DNA delivery via
cationic solid lipid nanoparticles (SLNs). Eur J Pharm Sci. 2013;49(2):157-65.
Chatzidaki MD, Mitsou E, Yaghmur A, Xenakis A, Papadimitriou V. Formulation and characterization of food-grade microemulsions as carriers of natural phenolic antioxidants. Colloids Surf A Physicochem Eng Asp. 2015;483:130-6.
Dolatabadi JEN, Hamishehkar H, Eskandani M, Valizadeh H. Formulation, characterization and cytotoxicity studies of alendronate sodium-loaded solid lipid nanoparticles. Colloids Surfaces B Biointerfaces. 2014;117:21-8.
Edelstein ML, Abedi MR, Wixon J, Edelstein RM. Gene therapy clinical trials worldwide 1989-2004 - an overview. J Gene Med. 2004;6(6):597-602.
Ege MA, Karasulu HY, Güneri T. Triangle phase diagram analysis software. In: The 4th International Postgraduate Research Symposium on Pharmaceutics. İstanbul. 2004;36.
Fàbregas A, Sánchez-Hernández N, Ticó JR, García-Montoya E, Pérez-Lozano P, Suñé-Negre JM, et al. A new optimized formulation of cationic solid lipid nanoparticles intended for gene delivery: Development, characterization and DNA binding efficiency of TCERG1 expression plasmid. Int J Pharm. 2014;473(1-2):270-9.
Fornaguera C, Grijalvo S, Galán M, Fuentes-Paniagua E, de la Mata FJ, Gómez R, et al. Novel non-viral gene delivery systems composed of carbosilane dendron functionalized nanoparticles prepared from nano-emulsions as non-viral carriers for antisense oligonucleotides. Int J Pharm. 2015;478(1):113-23.
Gaur PK, Mishra S, Bajpai M, Mishra A. Enhanced oral bioavailability of Efavirenz by solid lipid nanoparticles: In vitro drug release and pharmacokinetics studies. Biomed Res Int. 2014;2014:363404.
Glinka EM. Eukaryotic expression vectors bearing genes encoding cytotoxic proteins for cancer gene therapy. Plasmid. 2012;68(2):69-85.
Hackett PB, Largaespada DA, Switzer KC, Cooper LJN. Evaluating risks of insertional mutagenesis by DNA transposons in gene therapy. Transl Res. 2013;161(4):265-83.
Jin SE, Kim CK. Charge-mediated topical delivery of plasmid DNA with cationic lipid nanoparticles to the skin. Colloids Surfaces B Biointerfaces. 2014;116:582-90.
Jomary C, Piper TA, Dickson G, Couture LA, Smith AE, Neal MJ, et al. Adenovirus-mediated gene transfer to murine retinal cells in vitro and in vivo. FEBS Lett. 1994;347(2-3):117-22.
Kajbafvala A, Salabat A, Salimi A. Formulation, characterization, and in vitro/ex vivo evaluation of quercetin-loaded microemulsion for topical application. Pharm Dev Technol. 2016. DOI: 10.1080/10837450.2016.1263995.
Kotmakçı M, Akbaba H, Erel G, Ertan G, Kantarcı G. Improved method for solid lipid nanoparticle preparation based on hot microemulsions: preparation, characterization, cytotoxicity, and hemocompatibility evaluation. AAPS PharmSciTech. 2017;18(4):1355-1365.
Lee D-H, Cho G, Lim HM, Kim DS, Kim C, Lee S-H. Ceramic processing research comparisons of particle size measurement method for colloidal silica. J Ceram Process Res. 2013;14(2):274-8.
Lee PW, Hsu SH, Tsai JS, Chen FR, Huang PJ, Ke CJ, et al. Multifunctional core-shell polymeric nanoparticles for
transdermal DNA delivery and epidermal Langerhans cells tracking. Biomaterials. 2010;31(8):2425-34.
Preparation and characterization of non-viral gene delivery systems with pEGFP-C1 PLASMID DNA
Park H, Cho S, Han YH, Janat-Amsbury MM, Boudina S, Bae YH. Combinatorial gene construct and non-viral delivery for anti-obesity in diet-induced obese mice. J Control Release. 2015;207:154-62.
del Pozo-Rodríguez A, Solinís MA, Gascón AR, Pedraz JL. Short - and long-term stability study of lyophilized solid lipid nanoparticles for gene therapy. Eur J Pharm Biopharm. 2009;71(2):181-9.
Remaut K, Oorschot V, Braeckmans K, Klumperman J, De Smedt SC. Lysosomal capturing of cytoplasmic injected nanoparticles by autophagy: an additional barrier to non viral gene delivery. J Control Release. 2014;195:29-36.
Severino P, Szymanski M, Favaro M, Azzoni AR, Chaud MV, Santana MHA, et al. Development and characterization of a
cationic lipid nanocarrier as non-viral vector for gene therapy. Eur J Pharm Sci. 2015;66:78-82.
Shaji J, Jain V, Lodha S. Chitosan: a novel pharmaceutical excipient. Int J Pharm Appl Sci. 2010;1(1):11-28.
Solinís MÁ, del Pozo-Rodríguez A, Apaolaza PS, Rodríguez-Gascón A. Treatment of ocular disorders by gene therapy. Eur J Pharm Biopharm. 2014;95B:331-42.
Swami A, Espinosa G, Guillot S, Raspaud E, Boué F, Langevin HD. Confinement of DNA in water-in-oil microemulsions. Langmuir. 2008;24(20):11828-33.
Torrecilla J, del Pozo-Rodríguez A, Apaolaza PS, Solinís MÁ, Rodríguez-Gascón A. Solid lipid nanoparticles as non-viral vector for the treatment of chronic hepatitis C by RNA interference. Int J Pharm. 2015;479(1):181-8.
Ulrich AS. Biophysical aspects of using liposomes as delivery vehicles. Biosci Rep. 2002;22(2):129-50.