AR
TICLE
2171
Social Determinants, Conditions and Performance of Health
Services in Latin American Countries, Portugal and Spain
Abstract Comparison can be an important re-source for identifying trends or interventions that improve the quality of health services. Although Portugal and Spain have accumulated important knowledge in primary health care-PHC driven national systems, the Ibero-American countries have not been object of comparative studies. This paper presents an assessment using an analytical dashboard created by the Ibero-American Obser-vatory on Policies and Health Systems. It discus-ses aspects that have stood out in monitoring the service systems of Argentina, Brazil, Colombia, Spain, Paraguay, Peru, and Portugal throughout the 21st century’s first decade. Forty-five indica-tors and time series showing the highest comple-teness degree divided into social determinants, conditions and performance were analyzed. Three trends are common to almost all countries: overweight increase, negative trade balance for pharmaceutical products, and an increase in he-alth system expenditure. This convergence trend reveals the need for changes in the way of regu-lating, organizing and delivering health services with public policies and practices that guarantee comprehensive care, including health promotion Eleonor Minho Conill 1
Diego Ricardo Xavier 1 Sérgio Francisco Piola 2 Silvio Fernandes da Silva 1 Heglaucio da Silva Barros 1 Ernesto Báscolo 3
DOI: 10.1590/1413-81232018237.07992018
1 Observatório
2172 C onil l EM et al. Introduction
What factors are important for a health sys-tem? And how to measure them? The search for answers to those questions has led the Ibe-ro-American Observatory on Policies and Health (OIAPSS) to develop a dashboard for monitoring health systems. This is an initiative from the Na-tional Council of Municipal Departments, with support from the Ministry of Health of Brazil, for promoting information exchange in defense of public and universal health systems1. Its analyt-ical dashboard is one of the main contributions and was developed in partnership with research-ers from Argentina, Brazil, Colombia, Spain, Paraguay, Peru, and Portugal, and from Instituto de Comunicação e Informação Científica e Tec-nológica from Fundação Oswaldo Cruz- ICICT/ Fiocruz2,3.
Comparison is an important resource for identifying regional blocks or interventions to improve health services quality. Although they share common historical and cultural roots, Ibe-ro-American countries have never been subject to this kind of study before. In addition, Portugal and Spain have accumulated important knowl-edge in primary health care-PHC driven national systems, which have been correlated with positive outcomes4.
This work covers aspects which have been highlighted over the 21st century’s first decade, a very favorable period to Latin America-LA coun-tries due to their capacity to keep Gross Domestic Product-GDP growth rates, reducing their exter-nal vulnerability. Social expenditure has grown in the region, representing 19.1% of the GDP in 2012-2013, mainly due to income transfer pro-grams. Education and health presented a smaller growth: education went from 3.7% to 5.0% of the GDP and health from 3.2% to 4.2%5,6. In Por-tugal and Spain, the 2008/2009 economic crisis effects resulted in a greater impact. Recession has reduced revenues, raised public deficit and in-creased unemployment. Fiscal austerity pacts re-sulted in unprecedented cuts in social programs, with strong repercussions in health policies7.
Spain and Portugal have national systems characterized by universal coverage, decentral-ized organization on a territorial basis, financing from tax sources and there is residual private in-surance. In Latin America, social insurance was the first and main way of social protection, and the lower income population has access to ser-vices in the public sector financed by tax resourc-es. This kind of system is still prevailing in
Argen-tina and Paraguay. Changes in legal framework and reforms were carried out in Brazil (Sistema Único de Saúde), Colômbia (Sistema General de Seguridad Social en Salud), and Peru (Sistema Nacional Coordinado y Descentralizado de Salud) turned to universal health care through different strategies.
Brazil went from social insurance to a uni-versal national system model financed by tax sources; Colombia and Peru have opted for a progressive universal insurance with differences between contributory and subsidized schemes (implemented in Peru case in 2011, according to Aseguramiento Universal in Salud-AUS law). For various reasons, Latin American systems still present important segmentation in access and multiple mechanisms for financing, provision and services utilization8. Private insurance ex-panded significantly after the implementation of neoliberal reforms in the 80’s and families’ direct expenditures remain high9.
Information is considered to be one of the building blocks10 for systems performances. The OIAPSS dashboard proposes an integrated ap-proach by interrelating social determinants, con-ditions and performance, besides incorporating critical points less explored2.
Methodology
To develop a tool, which in this case would be used for information management, it is nec-essary to take into account three validity types: content (adequacy for the measurement goals), operational (viability, feasibility), and predic-tion (accuracy)11. These activities were developed through four stages performed in two seminars and four workshops in the period of 2011-2015.
These steps included: 1- consensus upon tool, themes, qualitative content of the categories, di-mensions and indicators; 2- exploratory study and web design discussion; 3- databases and technical data sheets organization; 4- presenta-tion of the results on a temporary site with a val-idation process by the countries.
2173
C
iência & S
aúd e C ole tiv a, 23(7):2171-2185, 2018
datasheets with concepts and sources, identifying the possibility of historical series, as well as their comparability; suggestion of rapid estimates or qualitative approaches in the case of lack of in-formation. This process was reviewed by external consultants (Brazilian experts in each area), after discussion and consensus upon the indicators initial list.
After the exploratory research, free access databases from international organizations were prioritized in order to ensure the continuity of the dashboard. The analytical comparison was performed when there was information available from at least three countries and the indicators represented an innovative approach.
The final model comprises the following the-matic areas, dimensions, and sub-dimensions:
1. Social determinants – demographic (struc-ture, dependency ratio); socioeconomic (income, employment, inequality, education); living condi-tions (nutrition, sanitation and access to potable water, violence, mental health, urban mobility);
2. Health Policy Social Construction – Legal framework;
3. Conditions – production complex (devel-opment and innovation, medicalization, techno-logical incorporation, trade balance); financing (sectoral spending, public/private composition); PHC (labor force);
4. Performance – access (coverage, supply); effectiveness (Primary health care avoidable mortality, avoidable morbidity, programs mark-ers); technical adequacy.
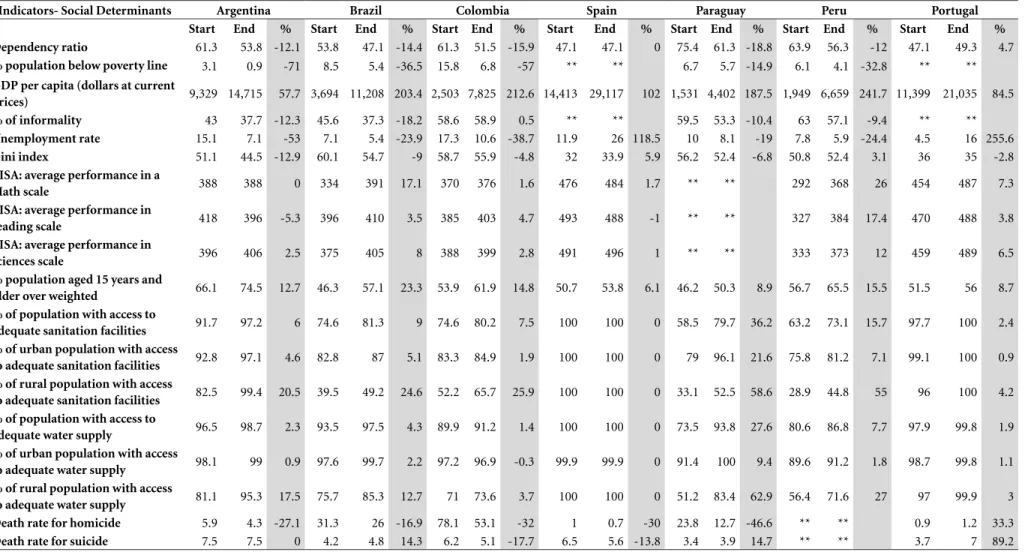
The final version available on the Observato-ry website allows the users to view 65 indicators and other complementary information about methodology (concepts, researchers and work-shops reports, completeness degree analysis, and others)12. For the analysis in this paper, we have selected 45 indicators of which time series pre-sented a greater completeness degree. Chart 1 summarizes sources, countries and periods. The results reveal the percentage variations in these periods, with the difference between the last and the first year of the series available for each indi-cator. They synthesize trends and describe how the evolution of the indicators happened. Data banks set, historical series and their graphical representations can be viewed on the OIAPSS
sions and estimates updates also may have been applied in some of the data banks after the end of the research. For this reason, dimensions, sub dimensions and indicators should be considered approximate measures to be complemented by qualitative information and improved over time. As for indicators deriving from different sourc-es, comparison must be limited to the observed trend, due to demographic structure influence on diseases prevalence and incidence.
Results
Social determinants: demographic, socioeconomic and living conditions
From 2000 to 2011, there was an increase in productive age population and a reduction in dependency rate in all Latin American countries. This rate is still greater than the one in Spain and Portugal, which have a more stable population structure.
Economic conditions show a GDP per capita growth particularly expressive in Latin America. Revenue growth was followed by a reduction in inequality, except for Spain and Peru, which had a small increase in the concentration of wealth. In LA the most significant declines occurred in Argentina and Brazil. However, it is note-worthy that these index values in Portugal and Spain arise from parameters much lower than those of Argentina – a country with the lowest concentrated income amongst Latin American countries studied. Colombia and Brazil are the countries with the greatest inequality amongst those analyzed. Population below poverty line has decreased, especially in Argentina, whose sit-uation was already better. Colombia and Brazil also showed a significant reduction in percentage (57% and 36.5%).
2174 Conill EM et al.
it continues
Chart 1. OIAPSS Dashboard Indicators, Periods and Available Sources.
Themes Dimensions Sub-dimensions Indicators Period Covered Source
Social Determinants
Demographic Dependency Ratio Population total dependency ratio 2000-2011 World Bank
Socio-economic Income % population below poverty line 2004-2010 World Bank
GDP per capita (dollars at current prices) 2000-2013 WolrdBank – OECD.
Work % of informality 2000-2012 CEPAL
Unemployment rate 2000-2013 CEPAL
Inequality GINI Index 2000-2010 World Bank
Education PISA: mathematical performance 2000, 2003, 2006, 2009 PISA-OECD
PISA: reading performance 2000, 2003, 2006, 2009 PISA-OECD
PISA: sciences performance 2000, 2003, 2006, 2009 PISA-OECD
Living Conditions Nutrition % population aged 15 years and older overweighed 2002, 2005, 2010 WHO
Sanitary Facilities % of population with access to adequate sanitation facilities 2000-2012 WHO
% of urban population with access to adequate sanitation facilities 2000-2012 WHO
% of rural population with access to adequate sanitation facilities 2000-2012 WHO
Water % of population with access to adequate water supply 2000-2012 WHO
% of urban population with access to adequate water supply 2000-2012 WHO
% of rural population with access to adequate water supply 2000-2012 WHO
Violence and Mental Health
Death rate for homicide 2000-2011 Eurostat – PAHO
Themes Dimensions Sub-dimensions Indicators Period Covered Source
Conditions Productive
Complex
Development and Innovation
Gross domestic expenditure on research and development (R&D)in health (millions of dollars – PPP)
2005-2011 OECD
Health expenditure on R&D as percentage of gross domestic expenditure on R&D
2005-2011 OECD
Private gross expenditure on R&D in health 2005-2011 OECD
Public gross expenditure on R&D in health 2005-2011 OECD
Total number of technological medical patents per applicant country 2000-2012 WIPO
Total number of pharmaceutical patents per applicant country 2000-2012 WIPO
Trade Balance Trade balance in pharmaceutical products in millions of dollars 2008-2012 WTO
Financing Sectorial
Expenditure
Health expenditure as percentage of gross domestic product (GDP %) 2000-2012 WHO
Public health expenditure as percentage of total public expenditure 2000-2012 WHO
Public/Private Composition
Private health expenditure as percentage of total health expenditure 2000-2012 WHO
Out of pocket expenditure as percentage of private health expenditure 2000-2012 WHO
Private insurance expenditure as percentage of private health expenditure 2000-2012 WHO
Public health expenditure as percentage of total total health expenditure 2000-2012 WHO
Performance Effectiveness Primare Care
Avoidable Mortality
Infant mortality rate 2000-2012 Millenium Indicators
Under-five mortality rate 2000-2012 Millenium Indicators
Maternal mortality rate 2000, 2005 and 2010 Millenium Indicators
Proportional mortality for acute diarrheal diseases in under-five 2000-2010 World Health Organization
Proportional mortality for acute respiratory diseases in under-five 2000-2010 World Health Organization
Mortality rate for ischemic heart diseases 2000-2010 Eurostat - PAHO
Mortality rate for cerebrovascular diseases 2000-2010 Eurostat - PAHO
Mortality rate for diabetes mellitus 2000-2010 Eurostat - PAHO
Neonatal mortality rate 2000-2011 Eurostat - PAHO
Post-neonatal mortality rate 2000-2011 Eurostat - PAHO
Avoidable Morbidity
% of children with low birth weight 2000-2011 PAHO – OECD
AIDS incidence rate in population aged 15 to 49 years old 2000-2012 Eurostat - PAHO
Follow-up rate for TB cases treatment 2007-2011 WHO
Programs Markers % success in Directly Observed Treatment of TB cases with positive sputum baciloscopy .
2000-2011 WHO
2176
C
onil
l EM
et al.
clined in Brazil and Argentina, and less expres-sively in Paraguay and Peru. In Colombia, there was practically no change and the rate remained high.
In all countries, there has been an increase in expected school years, being Argentina and Bra-zil cases similar to those in Portugal and Spain. Although educational scenario has experienced improvements, the analysis of Programme for International Student Assessment-PISA results shows a less favorable situation for the quality of education.
As for living conditions, a growth in over-weight population above 15 years old is clearly stated, exceeding 50% in all countries. The largest increase was seen in Brazil (23%), Peru and Co-lombia (approximately 15%). Access to adequate sanitation facilities and water supply has im-proved in LA Argentina being the country with the best situation. Although Paraguay, Peru and Brazil presented a growth of approximately 59%, 55%, and 25%, respectively, about half of rural population still remained without adequate san-itation facilities at the end of the period studied.
Mortality for homicide presents a wide vari-ation. Portugal and Spain demonstrate very low rates and amongst the countries in LA, Argentina reveals the lowest one. Besides a reduction be-tween 2000 and 2011, Colombia and Brazil pre-sented very high values – 53 and 26 per 100,000 in 2011, respectively. Whereas homicide rates reveal large differences between countries, the same does not apply to suicide. The highest rates were found in Argentina and Paraguay, Portugal and Brazil present a growth trend, although with lower rates in the series beginning year. In Por-tugal, there was an increase in both homicides and suicides. Table 1 illustrates these indicators variation.
Health services conditions factors: productive complex and financing
Research and development (R&D) indicators were obtained for Spain, Portugal and Argentina. Although the latter two show a significant gross expenditure growth in this activity (235% and 112%, respectively), values are on a much low-er level than those of Spain, being private health expenditure almost always higher than public health expenditure. Despite differences in abso-lute values, percentage in total expenditure on R&D is not so different – in 2011, 13.3% in Ar-gentina, 18.6% in Spain, and 14.2% in Portugal.
Spain and Brazil are the leaders in patent registration processes within the pharmaceuti-cal industry. While in Brazil there was a growth of 58%, Spain’s has more than tripled, jumping from 237 to 1,097%. Argentina’s reduction of 15% also demands attention. In medical technol-ogies area, Spain and Brazil presented the largest number of patent registration, with an increase of 147% and 10%, with Argentina presenting a decrease of around 50%.
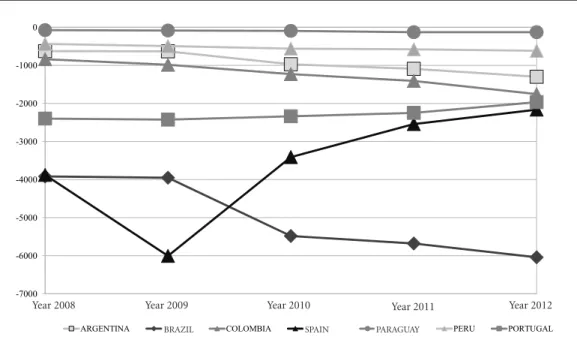
All of them presented a negative trade balance for medicines. It is noteworthy that this deficit is growing in Latin America, but has a reduction trend in Spain and Portugal. Brazilian deficit was the highest: three times higher than in Spain and Portugal for 2012, the last series year. Graphic 1 below shows this indicator’s trend. In 2012, coun-tries presented the following total expenditure values on health as a GDP proportion: Argentina 5.0%, Brazil 8.2%, Colombia 6.9%, Spain 9.4%, Paraguay 10.3%, Peru 5.2%, and Portugal 9.7%. An increase trend in total health expenditure as percentage of GDP was noted in all of them, except for Argentina, which went from 9.2% to 5.0% (2000-2012). Colombia and Brazil growth was similar (17%), being less expressive in Peru and Portugal. The increase of 30.2% in Spain and of 27.5% in Paraguay is worth highlighting. Pub-lic resources proportion in financing increased in Argentina, Brazil and Paraguay.
The proportion remained almost the same for Spain and decreased in Colombia, Peru and Portugal. In 2012, Colombia and Argentina – with a share of 76.1% and 59% in public resourc-es financing – were the Latin American countriresourc-es closer to Spanish and Portuguese rates. A differ-ent scenario is observed in Brazil and Paraguay, where public resources share is lower than pri-vate spending (around 44%).
Table 1. Percentage Variation for Social Determinants.
Indicators- Social Determinants Argentina Brazil Colombia Spain Paraguay Peru Portugal
Start End % Start End % Start End % Start End % Start End % Start End % Start End %
Dependency ratio 61.3 53.8 -12.1 53.8 47.1 -14.4 61.3 51.5 -15.9 47.1 47.1 0 75.4 61.3 -18.8 63.9 56.3 -12 47.1 49.3 4.7
% population below poverty line 3.1 0.9 -71 8.5 5.4 -36.5 15.8 6.8 -57 ** ** 6.7 5.7 -14.9 6.1 4.1 -32.8 ** **
GDP per capita (dollars at current
prices) 9,329 14,715 57.7 3,694 11,208 203.4 2,503 7,825 212.6 14,413 29,117 102 1,531 4,402 187.5 1,949 6,659 241.7 11,399 21,035 84.5
% of informality 43 37.7 -12.3 45.6 37.3 -18.2 58.6 58.9 0.5 ** ** 59.5 53.3 -10.4 63 57.1 -9.4 ** **
Unemployment rate 15.1 7.1 -53 7.1 5.4 -23.9 17.3 10.6 -38.7 11.9 26 118.5 10 8.1 -19 7.8 5.9 -24.4 4.5 16 255.6
Gini index 51.1 44.5 -12.9 60.1 54.7 -9 58.7 55.9 -4.8 32 33.9 5.9 56.2 52.4 -6.8 50.8 52.4 3.1 36 35 -2.8
PISA: average performance in a
Math scale 388 388 0 334 391 17.1 370 376 1.6 476 484 1.7 ** ** 292 368 26 454 487 7.3
PISA: average performance in
reading scale 418 396 -5.3 396 410 3.5 385 403 4.7 493 488 -1 ** ** 327 384 17.4 470 488 3.8
PISA: average performance in
sciences scale 396 406 2.5 375 405 8 388 399 2.8 491 496 1 ** ** 333 373 12 459 489 6.5
% population aged 15 years and
older over weighted 66.1 74.5 12.7 46.3 57.1 23.3 53.9 61.9 14.8 50.7 53.8 6.1 46.2 50.3 8.9 56.7 65.5 15.5 51.5 56 8.7
% of population with access to
adequate sanitation facilities 91.7 97.2 6 74.6 81.3 9 74.6 80.2 7.5 100 100 0 58.5 79.7 36.2 63.2 73.1 15.7 97.7 100 2.4
% of urban population with access
to adequate sanitation facilities 92.8 97.1 4.6 82.8 87 5.1 83.3 84.9 1.9 100 100 0 79 96.1 21.6 75.8 81.2 7.1 99.1 100 0.9
% of rural population with access
to adequate sanitation facilities 82.5 99.4 20.5 39.5 49.2 24.6 52.2 65.7 25.9 100 100 0 33.1 52.5 58.6 28.9 44.8 55 96 100 4.2
% of population with access to
adequate water supply 96.5 98.7 2.3 93.5 97.5 4.3 89.9 91.2 1.4 100 100 0 73.5 93.8 27.6 80.6 86.8 7.7 97.9 99.8 1.9
% of urban population with access
to adequate water supply 98.1 99 0.9 97.6 99.7 2.2 97.2 96.9 -0.3 99.9 99.9 0 91.4 100 9.4 89.6 91.2 1.8 98.7 99.8 1.1
% of rural population with access
to adequate water supply 81.1 95.3 17.5 75.7 85.3 12.7 71 73.6 3.7 100 100 0 51.2 83.4 62.9 56.4 71.6 27 97 99.9 3
Death rate for homicide 5.9 4.3 -27.1 31.3 26 -16.9 78.1 53.1 -32 1 0.7 -30 23.8 12.7 -46.6 ** ** 0.9 1.2 33.3
Death rate for suicide 7.5 7.5 0 4.2 4.8 14.3 6.2 5.1 -17.7 6.5 5.6 -13.8 3.4 3.9 14.7 ** ** 3.7 7 89.2
2178
C
onil
l EM
et al.
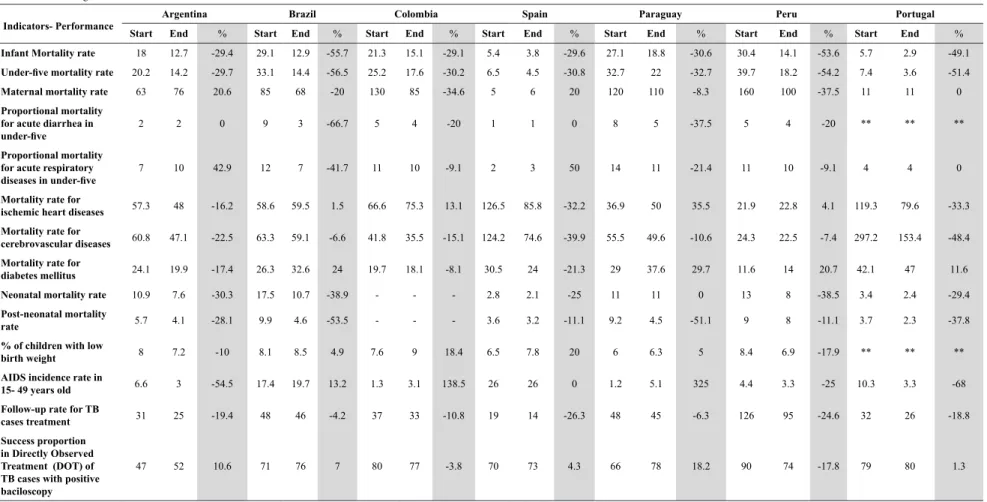
Health services performance
From 2000 to 2012, all countries reduced in-fant mortality, especially Brazil and Peru. Peru had the highest post-neonatal mortality rate, but Brazil and Paraguay reduced it by more than 50%.Under-five mortality decreased significant-ly, mainly in Brazil and Peru, but the gap between Portugal and Spain remains large. It is essential to point out Portugal’s performance, with the low-est mortality rate for this group in 2012, and a higher reduction than in Spain.
Maternal mortality rates in Iberian countries are also much lower than in Latin America. In the last series year, although Brazil presented the lowest rate, it was still seven times higher than Portugal’s and nine times than Spain’s. The in-crease in this indicator in Argentina is striking, going from 63 to 76 per 100,000 women in fertile age, from 2000 to 2010.
Acute diarrhea as a cause of death in un-der-five is decreasing in LA but more significant-ly in Brazil. Although less pronounced, a decrease trend was also observed in mortality due to acute
respiratory infection in most countries. Brazil had the largest reduction, and it is also important to note an increase in Argentina and Spain.
Mortality due to ischemic heart diseases and cerebrovascular diseases shows a decrease trend in Spain and Portugal. In LA, except for Argentina, there is a growth trend for ischemic heart diseas-es, and a reduction for cerebrovascular, mainly in Argentina (22.5%) and Colombia (15.1%). The highest mortality rates for diabetes mellitus are found in Paraguay and Brazil, with a higher mor-tality rate in Portugal when compared to Spain.
As for avoidable morbidity monitoring, Bra-zil and Colombia presented a higher proportion of low birth weight at the end of the series. Ac-quired Immunodeficiency Syndrome/AIDS de-creased significantly in Portugal and Argentina. In Brazil, the country with higher incidence, the values increased from 17.4 to 20.9 cases per 100,000 inhabitants. Paraguay and Colombia also presented a significant increase. Except for Argentina, countries presented a TB Directly Observed Treatment/DOT proportion exceeding 70%. Table 3 shows these results.
Graphic 1. Trade Balance in Pharmaceutical Products (millions of dollars), 2008-2012.
Source: Ibero-American Observatory on Policies and Health Systems Indicators dashboard12. -7000
-6000 -5000 -4000 -3000 -2000 -1000 0
Ano 2008 Ano 2009 Ano 2010 Ano 2011 Ano 2012
ARGENTINA BRASIL COLOMBIA ESPANHA PARAGUAI PERU PORTUGAL
Year 2008 Year 2009 Year 2010 Year 2011 Year 2012
Table 2. Percentage Variation of Conditions Indicators*.
Conditions - Indicators Argentina Brazil Colombia Spain Paraguay Peru Portugal
Start End % Start End % Start End % Start End % Start End % Start End % Start End %
Health gross domestic expenditure on ic research and development (R&D) (millions of dollars - PPP)
288 611 112.2 ** ** ** ** 3,329 3,733 12.1 ** ** ** ** 176 591.1 235.9
Health expenditure on R&D as percentage of gross domestic expenditure R&D
14.9 13 -12.8 ** ** ** ** 18.2 18.6 2.2 ** ** 10 14 40
Private gross expenditure on R&D 122 222 82 ** ** ** ** 1,508 1,405 -6.8 ** ** ** ** 54.4 184.9 239.9
Public t gross expenditure on R&D 85.6 168 96.3 ** ** ** ** 713 1,495 109.7 ** **
Total number of technological medical
patents per applicant country 53 26 -50.9 206 227 10.2 18 26 44.4 210 520 147.6 ** ** 1 3 200 9 33 266.79
Total number of pharmaceutical
patents per applicant country 32 27 -15.6 122 193 58.2 1 13 1200 237 1,097 362.9 ** ** ** ** 41.5 129 210.8
Trade balance in pharmaceutical
products in millions of dollars -627 -1,302 107.7 -3,920 -6,043 54.2 -840 -1,756 109 -3,879 -2,164 -44.2 -75 -130 73.3 -437 -619 41.6 -2,399 -1,967 -18
Health expenditure as percentage of
GDP 9.21 5.02 -45.5 7.03 8.26 17.5 5.91 6.93 17.3 7.21 9.39 30.24 8.1 10.3 27.5 4.83 5.18 7.2 9.14 9.74 6.6
Public health expenditure as percentage of total public expenditure
17.6 8.7 50.3 4.8 6.86 68.1 19.3 18.8 15.4 13.2 14.1 6.9 17.7 11.5 -35.3 14.1 13.9 -1.56 14.5 12.8 -11.4
Private health expenditure as
percentage of total health expenditure 46.1 41.1 -11 59.7 55.7 -6.7 20.7 23.8 15.4 28.4 28.3 -0.4 60.1 55.5 -7.7 43.6 45 3.12 32.3 36 11.5
Out of pocket as percentage of private
health expenditure 63 65.5 3.9 63.6 48.3 -24 59 60.9 3.2 83.1 79.7 -4 86.6 91.4 5.5 83.4 79.2 -5.1 70 76.2 8.8
Private insurance expenditure as percentage of private health expenditure
30.7 25.9 -15.4 34.3 49.4 44 41 39.1 -4.6 13.7 29.3 50.4 13.4 8.6 -35.6 12.8 10.3 -19.9 10.2 14.4 41.8
Public health expenditure as
percentage of total health expenditure 53.9 59 9.4 40.3 44.3 10 79.3 76.1 -4.6 71.6 71.7 0.2 39.9 44.5 11.6 56.4 55 -2.4 67.8 64 -5.5
Source: Ibero-American Observatory on Policies and Health Systems Indicators dashboard12.
2180 C onil l EM et al. Discussion
The results that refer to social determinants are correlated to the analyses of the virtuous com-bination between economic development and the reduction of inequality, which have marked the first decade of the 21st century Latin Ameri-ca13. After 20 years of recession and crises, these countries have sustained high growth rates, less unemployment and informality, and the reduc-tion of inequality and extreme poverty. Although each country had a variation in type and extent for these achievements, the association between economic progress and better wealth distribu-tion is an uncommon fact in the region’s history5. According to Pinto5, the major compounding factors were: demographic transition, Chinese economic expansion, the reduction in neoliberal policies, and the increase of income transfer pro-grams. China has become the greatest buyer of raw material from South American and African countries, which led to an increase of commod-ities prices. Economic shifts positively affected external accounts, facilitating an expansive fiscal policy, expenditure on infrastructure and social policies.
However, in countries like Brazil and Colom-bia there is a gap between economic growth and infrastructure improvements, which deserves a more careful observation, considering the impor-tance of these investments to a higher quality of life. In Brazil, water supply and waste collection scenarios are related to an increase in dissemina-tion risks and a higher incidence of infecdissemina-tions by arboviruses (dengue, Zika virus, Chikungunya fever)14,15, in addition to the exponential increase of sylvatic yellow fever cases16.
Data on demographic transition bring inter-esting points for discussion about development. There was a growth in LA’s population from 15 to 64 years, establishing a situation called “demo-graphic bonus”, a continent common trend6. To take the best out of this phenomenon, it is nec-essary to generate jobs and improve education. Besides the improvement in access to basic edu-cation, quality problems persist – in comparison with Spain and Portugal, the biggest gaps are ex-actly in mathematics and sciences fields.
Violence and mental health are significant living conditions indicators, especially in Latin America. The understanding of this phenomenon is multifactorial and should take into account in-dividual factors as well as social and communi-ty6. Even though this indicator has decreased, the permanence of high rates of homicide in Brazil
and Colombia is striking. Unlike the favorable socioeconomic scenario that characterized Latin America, Portugal and Spain were severely af-fected by the crisis with high unemployment and cuts in social policies. It is interesting to note that the trend found for violence and mental health indicators in Portugal precedes the worst years of the crisis, pointing out the importance of contin-uous monitoring.
Overweight increase can be observed in all countries. Obesity has been recognized as a pandemic disease, but it is necessary progress to control it. This implies intersectoral actions with agricultural policies, industrial production and food advertisement regulation, healthy food environments and nutrition education activi-ties17. According to an UN Report18, the discus-sion should focus on poor nutrition as an issue that affects all the countries, in one or more of its main modalities. Addressing universal health systems challenges, Temporão19 shows the in-ter-relation between demographic, epidemiolog-ical, food, technologepidemiolog-ical, cultural, organizational, economic, scientific and innovation transitions, pointing out its implications for health and for these systems.
Another common trend relates to health pro-duction complex, more specifically with med-icines utilization issue. All countries present a negative trade balance for pharmaceutical prod-ucts. This dependence pattern is more severe in Latin America, particularly in Brazil. Authors20 dealing with this issue have shown the fragility of Brazilian production, although the country occupies the seventh position in the sales global ranking.
The pharmaceutical industry has develop-ment, innovation activities and marketing with strong interaction with scientific institutions as main competitive tools. But the activities most developed technologically lie in core countries, and only the drugs final production are located in peripheral countries (depending on their mar-ket size)6. A negative dynamic for these countries arises– at the same time that access is expanded, technological dependence increases with risks to the system’s financial sustainability21.
Table 3. Percentage Variation of Performance Indicators*.
Indicators- Performance Argentina Brazil Colombia Spain Paraguay Peru Portugal
Start End % Start End % Start End % Start End % Start End % Start End % Start End %
Infant Mortality rate 18 12.7 -29.4 29.1 12.9 -55.7 21.3 15.1 -29.1 5.4 3.8 -29.6 27.1 18.8 -30.6 30.4 14.1 -53.6 5.7 2.9 -49.1
Under-five mortality rate 20.2 14.2 -29.7 33.1 14.4 -56.5 25.2 17.6 -30.2 6.5 4.5 -30.8 32.7 22 -32.7 39.7 18.2 -54.2 7.4 3.6 -51.4
Maternal mortality rate 63 76 20.6 85 68 -20 130 85 -34.6 5 6 20 120 110 -8.3 160 100 -37.5 11 11 0
Proportional mortality for acute diarrhea in
under-five
2 2 0 9 3 -66.7 5 4 -20 1 1 0 8 5 -37.5 5 4 -20 ** ** **
Proportional mortality for acute respiratory
diseases in under-five
7 10 42.9 12 7 -41.7 11 10 -9.1 2 3 50 14 11 -21.4 11 10 -9.1 4 4 0
Mortality rate for
ischemic heart diseases 57.3 48 -16.2 58.6 59.5 1.5 66.6 75.3 13.1 126.5 85.8 -32.2 36.9 50 35.5 21.9 22.8 4.1 119.3 79.6 -33.3
Mortality rate for
cerebrovascular diseases 60.8 47.1 -22.5 63.3 59.1 -6.6 41.8 35.5 -15.1 124.2 74.6 -39.9 55.5 49.6 -10.6 24.3 22.5 -7.4 297.2 153.4 -48.4
Mortality rate for
diabetes mellitus 24.1 19.9 -17.4 26.3 32.6 24 19.7 18.1 -8.1 30.5 24 -21.3 29 37.6 29.7 11.6 14 20.7 42.1 47 11.6
Neonatal mortality rate 10.9 7.6 -30.3 17.5 10.7 -38.9 - - - 2.8 2.1 -25 11 11 0 13 8 -38.5 3.4 2.4 -29.4
Post-neonatal mortality
rate 5.7 4.1 -28.1 9.9 4.6 -53.5 - - - 3.6 3.2 -11.1 9.2 4.5 -51.1 9 8 -11.1 3.7 2.3 -37.8
% of children with low
birth weight 8 7.2 -10 8.1 8.5 4.9 7.6 9 18.4 6.5 7.8 20 6 6.3 5 8.4 6.9 -17.9 ** ** **
AIDS incidence rate in
15- 49 years old 6.6 3 -54.5 17.4 19.7 13.2 1.3 3.1 138.5 26 26 0 1.2 5.1 325 4.4 3.3 -25 10.3 3.3 -68
Follow-up rate for TB
cases treatment 31 25 -19.4 48 46 -4.2 37 33 -10.8 19 14 -26.3 48 45 -6.3 126 95 -24.6 32 26 -18.8
Success proportion
in Directly Observed
Treatment (DOT) of
TB cases with positive
baciloscopy
47 52 10.6 71 76 7 80 77 -3.8 70 73 4.3 66 78 18.2 90 74 -17.8 79 80 1.3
Source: Ibero-American Observatory on Policies and Health Systems Indicators dashboard12.
2182
C
onil
l EM
et al.
in which health systems are integrated with in-dustrial and technological policies, combining universal access and national competitiveness.
Except for Argentina, all countries followed this global trend of increasing their expenditure on health. After analyzing this indicator, incon-sistencies have been noted, suggesting the need of a database review in this country. From 1998 to 2003, these expenditures annual average growth was higher (5.7%) than the world economy growth (3.6%)6, reinforcing previous discussion about systems’ sustainability as pointed by other authors22.
Expenditure growth as a GDP proportion does not necessarily mean better performance or quality, for this reason the health financing indicators should be analyzed in an integrated way. GDP percentage reflects sectoral spending relative priority, while per capita expenditures (an indicator that needs to be incorporated into the dashboard) relate with domestic product ex-tent and the population size. Considering this, besides Paraguay’s high health expenditure as a GDP proportion in the last series year, its per capita expenditure is one of the lowest due to its economy size (PPP US$ 571.7 in 2012). Lat-in American countries show relevant differences in per capita expenditures when compared with Spain and Portugal. In Brazil and Argentina, the countries with the highest values, spending was less than half of those observed in Iberian coun-tries (US$1,257 and US$1,133 versus $2,984 and $2,624 in 2012)23.
It was difficult to separate redistributive expense (tax resources) from the available fi-nancing indicators, which overestimates public spending in Argentina, Colombia, Peru and Par-aguay. Brazilian low public expenditure is con-firmed, which contradictsthe constitutional goals of a universal system, a fact that has been empha-sized in numerous studies24,25. While there was a growth in government expenditure on health26, public expenditure was still lower than that in the private sector in 2012.
Despite these financial difficulties, Brazil’s good performance in regards to women and children’s health is clearly stated. There is a co-incidence between this data and studies that have been pointing a relationship of these findings with the Family Health Strategy. This program started in 1994 and became a national policy for health care reform. In 2017, the program’s cov-erage was around 60% of the population, with more than 40,000 family health teams working at Primary Health Care Centers (Unidades Básicas
de Saúde)27. Notwithstanding some obstacles in its development, researches have demonstrated positive results in reducing inequalities for health services utilization28, under-five mortality29, and primary health care avoidable hospitalizations30.
Conclusion
The dashboard developed by OIAPSS offers a set of information and opens up numerous analyt-ical possibilities. Some of them concern specific issues that need to be discussed in each country’s context. For example, the results less favorable found in Argentina for maternal and child health indicators, and the mortality rates increasing for homicide and suicide in Portugal prior to the cri-sis on the European continent. In Brazil and Co-lombia, it would be interesting to monitor the gap identified between economic growth and sanita-tion improvements and access to potable water, as well as homicide high rates, which suggest that violence can be an important marker of social de-velopment in these and in other countries.
In LA, unlike the 1980’s to 1990’s years known as the “Lost Decade”, the most recent period has been referred to as “Golden Decade”. However, good times seem to have come to an end. Brazil, for example, has collapsed economically and po-litically since 2015. As a result, an extremely re-strictive fiscal policy arose, with the approval of a Constitutional Amendment31 that blocks Federal Government primary expenditure for 20 years, with serious repercussions on public policies32. Therefore, ensuring these indicators are moni-tored becomes crucial.
Three trends are common to almost all coun-tries: overweight increase, negative trade balance for pharmaceutical products, and an increase in health system expenditure. Services response capacity is influenced by a number of factors, which are: sustainability level in terms of essen-tial inputs, financing conditions and political-in-stitutional framework. For this reason, the tech-nological dependence issue focuses more acutely in Latin American countries. One of the main challenges lies in the countries governments’ capacity to play an effective role as a regulator, reinforcing their power as buyers and qualifying management. Without such a change, it will be difficult to impose limits to commercial interests and private accumulation that tend to overshad-ow collective interests critically.
2183
C
iência & S
aúd
e C
ole
tiv
a,
23(7):2171-2185,
2018
to organize services with a comprehensive care, incorporating intersectoral and health promo-tion acpromo-tions. Although there is sufficient evidence on primary care advantages for coordinated and efficient care, during crisis or adjustment scenar-ios these policies implementation suffers great kickback, as occurred in Portugal and Spain. Unlike in LA, the socioeconomic scenario shows signs of recovery in these countries, and a fol-low-up is important to determine whether the trend will be reversed.
This common scenario exposes the challenge of reconciling sustainability and quality in soci-eties with a consumption culture as a solution strategy. In other words, the development of uni-versal systems in LA does not only mean expand-ing coverage and care consumption, but it entails an effort to ensure a timely access, without ne-glecting social development and public policies that can promote health.
Collaborations
EM Conill coordinated the research, the text writing and review, DR Xavier participated in re-search, analysis, and text writing and review, SF Piola in the analysis and review, SF Silva, HS Bar-ros and E Báscolo in research and review.
2184 C onil l EM et al. References
1. Observatório Ibero-Americano de Políticas e Sistemas de Saúde (OIAPSS). Documento base para construção do Observatório Ibero-Americano de Políticas e Sistemas
de Saúde. OIAPSS; 2011. [acessado 2017 Nov 25].
Dis-ponível em: http://www.oiapss.org/wp-content/uplo-ads/2012/12/Documento-Base-portugu%C3%AAs. pdf.
2. Conill EM. Projeto desenvolvimento de matriz analítica para acompanhamento dos países do OIAPSS: história,
fundamentos e metodologia. Brasília: Observatório
Ibe-ro-Americano de Políticas e Sistemas de Saúde (OIAP-SS); 2011. [acessado 2017 Nov 25]. Disponível em: http://www.oiapss.org/wp-content/uploads/2015/02/ Hist%C3%B3ria fundamenta%C3%A7%C3%A3o-e-metodologia1.pdf.
3. Viacava F, Ugá MAD, Porto S, Laguardia J, Moreira RS. Avaliação de desempenho de sistemas de saúde: um modelo de análise. Cien Saude Colet 2012; 17(4):921-934.
4. Macinko J, Starfield B, Shi L. The contribution of pri-mary care systems to health outcomes within Organi-zation for Economic Cooperation and Development (OECD) countries, 1970-1998. Health Serv Res 2003; 38(3):831-865.
5. Pinto EC. América Latina na primeira década do século XXI: “Efeito China” e crescimento com inclusão In: Ro-drigues VA, organizador. Observatório Internacional de Capacidades Humanas, Desenvolvimento e Políticas
Pú-blicas, Estudos e Análises, 1. Brasília: UNB/ObservaRH/
NESP, 2013. p. 23-46.
6. Piola SF. Relatório técnico de análise da matriz de in-dicadores. Observatório Ibero-Americano de Políticas e
Sistemas de Saúde. Brasília: OIAPSS; 2011. [acessado
2017 Nov 26]. Disponível em: http://www.oiapss.org/ wp-content/uploads/2015/07/Data-03-08-2015-Re- lato%CC%81rio-Te%CC%81cnico-de-Ana%C- C%81lise-da-Matriz-de-Indicadores-do-Observa-to%CC%81riosugest%C3%B5es.pdf.
7. Giovanella L; Stegmuller K. Crise financeira europeia e sistemas de saúde: universalidade ameaçada? Tendên-cias das reformas de saúde na Alemanha, Reino Unido e Espanha. Cad Saude Publica 2014; 30(11):1-19. 8. Giovanella L, Feo O, Faria M, Tobar S, organizadores.
Sistemas de salud em Suramérica: desafios para la uni-versalidad, la integralidad y la equidad. Rio de Janeiro: ISAGS; 2012.
9. Sojo A. Condiciones para elacceso universal a la salud en América Latina: derechos sociales, protección social y restricciones financieras y políticas. Cien Saude Colet
2011; 16(6):2673-2685.
10. World Health Organization (WHO). Everbody business: strengthening health systems to improve health outcomes. Genève: WHO; 2007. (WHO’s framework for action). 11. Contandriopoulos AP, Champagne F, Potvin l, Denis,
JL, Boyle P. Saber preparar uma pesquisa. São Paulo, Rio de Janeiro: Hucitec, Abrasco; 1994.
12. Observatório Ibero-Americano de Políticas e Sistemas de Saúde (OIAPSS). Matriz de indicadores. [acessado 2017 Nov 26]. Disponível em: http://oiapss.icict.fio-cruz.br/matriz.php?ling=2
13. Nogueira RP. Capacidades humanas, desenvolvimen-to e políticas públicas. In: Rodrigues VA, organizador.
Observatório Internacional de Capacidades Humanas, Desenvolvimento e Políticas Públicas, Estudos e Análises, 1. Brasília: UNB/ObservaRH/NESP; 2013. p. 15-20. 14. Brasil. Ministério da Saúde (MS). Boletim
Epidemio-lógico n. 47, 2016. [acessado 2017 Nov 26]. Disponível
em: http://portalsaude.saude.gov.br/index.php/o-mi- nisterio/principal/secretarias/svs/boletim-epidemiolo-gico.
15. Brasil. Ministério da Saúde (MS). Centro de Operação de Emergência em Saúde Pública sobre Microcefalia,
Informe Epidemiológico n. 57, SE 52, 2016. [acessado
2017 Nov 26]. Disponível em: http://portalsaude.sau-de.gov.br/index.php/o-ministerio/principal/leia-mais -o-ministerio/1234-secretaria-svs/vigilancia-de-a-a-z/ microcefalia/l2-microcefalia-svs/22705-informe-epi-demiologicos.
16. Brasil. Ministério da Saúde (MS). Centro de Opera-ção de Emergência em Saúde Pública sobre Febre
Ama-rela, Informe Epidemiológico n. 43, 2017. [acessado
2017 Nov 26]. Disponível em: http://portalarquivos. saude.gov.br/images/pdf/2017/junho/02/COES-FE-BRE-AMARELA---INFORME-43---Atualiza----o-em -31maio2017.pdf.
17. Castro IRR. Obesidade: urge fazer avançar políticas públicas para sua prevenção e controle. Editorial. Cad
Saude Publica 2017; 33(7):e00100017.
18. Garric A. La malnutrition n´ épargne plus aucun pays dans le monde. Le Monde. [cited 2017 Nov 26]. Available from: http://www.lemonde.fr/planete/arti- cle/2017/11/04/la-malnutrition-n-epargne-plus-au-cun-pays-dans-le-monde_5210018_3244.html. 19. Temporão JG. Sistemas universales de salud em el
mundo em transformación. In: Giovanella L, Oscar F, Faria M, Tobar S, organizadores. Sistemas de salud en Suramérica: desafios para la universalidade, la integrali-dad y la equiintegrali-dad. Rio de Janeiro: ISAGS; 2012. p. 13-20. 20. Gadelha CAG, Maldonado JMSV, Costa LS. O comple-xo produtivo da saúde e sua relação com o desenvol-vimento: um olhar sobre a dinâmica da inovação em saúde. In: Giovanella L, Escorel S, Lobato LVC, Noro-nha JC, Carvalho AI, organizadores. Políticas e sistemas de saúde no Brasil. 2ª ed. rev. ampl. Rio de Janeiro: Ed. Fiocruz; 2012. p. 209-237.
21. Iñesta A, Oteo LA. La industria farmacêutica y la soste-nibilidad de los sistemas de salud desarrollados y Ame-rica latina. Cien Saude Colet 2011; 16(6):2713-2724. 22. Andreazzi MFS, Kornis GEM. Padrões de
acumula-ção setorial: finanças e serviços nas transformações contemporâneas da saúde. Cien Saude Colet 2008; 13(5):1409-1420.
2185
C
iência & S
aúd
e C
ole
tiv
a,
23(7):2171-2185,
2018
24. Marques RM, Piola SF. O financiamento da saúde de-pois de 25 anos de SUS. In: Rigotto MLF, Costa AM or-ganizadores. 25 Anos de Direito Universal à Saúde. Rio de Janeiro: Cebes; 2014. p. 177-194.
25. Piola SF, Servo LM, Sá EB, Paiva EB. Financiamento do Sistema Único de Saúde: Trajetória Recente e Cená-rios para o Futuro. Análise Econômica 2012; Ano 30(n. esp.):9-33.
26. Barros MED, Piola SF. O financiamento dos serviços de saúde no Brasil. In: Marques RM, Piola SF, Roa AC, organizadores. Sistema de Saúde no Brasil: organização e financiamento. Rio de Janeiro, Brasília: ABrES, Minis-tério da Saúde (MS), OPAS/OMS; 2016. p. 101-138. 27. Fausto MCR, Giovanella L, Mendonça MHM, Deidl H,
Gagno J. A posição da Estratégia Saúde da Família na rede de atenção à saúde na perspectiva das equipes e usuários participantes do PMAQ-AB. Saúde em Debate
2014; 38(n. esp.):13-33.
28. Macinko J, Costa MFL. Horizontal equity in health care utilization in Brazil, 1998-2008. Int J Equity Health
2012; 11:33. [acessado 2017 Nov 26]. Disponível em: https://www.ncbi.nlm.nih.gov/pmc/articles/PMC3 444440/
29. Rasella D, Aquino R, Barreto ML. Reducing Childhood Mortality From Diarrhea and Lower Respiratory Tract Infections in Brazil. Pediatrics 2010; 126(3):1-7. 30. Mendonça CS, Harzheim E, Duncan BB, Nunes LN,
LeynW. Trends in hospitalizations for primary care sensitive conditions following the implementation of Family Health Teams in Belo Horizonte, Brazil. Health
Policy Plan 2012; 27(4):348-355.
31. Brasil. Emenda Constitucional nº 95, de 2016. Altera o Ato das Disposições Constitucionais Transitórias para instituir o Novo Regime Fiscal, e dá outras providên-cias. Diário Oficial da União 2016; 16 dez.
32. Vieira FS, Benevides RPS. Os impactos do Novo Regime Fiscal para o financiamento do Sistema Único de Saúde e para a efetivação do direito à saúde no Brasil. Brasília: Ipea; 2016. (Nota Técnica 28). [acessado 2017 Nov 26]. Disponível em: http://www.ipea.gov.br/portal/images/ stories/PDFs/nota_tecnica/160920_nt_28_disoc.pdf.