IOP Conference Series: Materials Science and Engineering
PAPER • OPEN ACCESS
Analysis of Within-Test Variability of Non-Destructive Test Methods to
Evaluate Compressive Strength of Normal Vibrated and
Self-Compacting Concretes
To cite this article: Miguel C. S. Nepomuceno and Sérgio M. R. Lopes 2017 IOP Conf. Ser.: Mater. Sci. Eng. 245 032025
1
Content from this work may be used under the terms of theCreative Commons Attribution 3.0 licence. Any further distribution of this work must maintain attribution to the author(s) and the title of the work, journal citation and DOI.
Published under licence by IOP Publishing Ltd
1234567890
WMCAUS IOP Publishing
IOP Conf. Series: Materials Science and Engineering 245 (2017) 032025 doi:10.1088/1757-899X/245/3/032025
Analysis of Within-Test Variability of Non-Destructive Test
Methods to Evaluate Compressive Strength of Normal
Vibrated and Self-Compacting Concretes
Miguel C. S. Nepomuceno 1, Sérgio M. R. Lopes 2
1 University of Beira Interior, Department of Civil Engineering and Architecture,
Centre of Materials and Building Technologies, 6201-001 Covilhã - Portugal
2 University of Coimbra, Department of Civil Engineering,
Mechanical Engineering Research Centre, 3030-290 Coimbra - Portugal [email protected]
Abstract. Non-destructive tests (NDT) have been used in the last decades for the assessment of in-situ quality and integrity of concrete elements. An important step in the application of NDT methods concerns to the interpretation and validation of the test results. In general, interpretation of NDT results should involve three distinct phases leading to the development of conclusions: processing of collected data, analysis of within-test variability and quantitative evaluation of property under investigation. The analysis of within-test variability can provide valuable information, since this can be compared with that of within-test variability associated with the NDT method in use, either to provide a measure of the quality control or to detect the presence of abnormal circumstances during the in-situ application. This paper reports the analysis of the experimental results of within-test variability of NDT obtained for normal vibrated concrete and self-compacting concrete. The NDT reported includes the surface hardness test, ultrasonic pulse velocity test, penetration resistance test, pull-off test, pull-out test and maturity test. The obtained results are discussed and conclusions are presented. 1. Introduction
The application of non-destructive test methods (NDT) to evaluate the in-situ concrete compressive strength is well known since many decades [1-4]. Many of those tests were initially developed for application in normal strength vibrated concrete, but in the 1990s some of them were adapted for application in high strength vibrated concrete [5-8]. The procedures for application of NDT are defined in national standards published in many countries, although small differences can be found among them. The range of the available NDT can vary from the most economical, simple and easy to operate, to the most expensive and complicated to use. The careful selection of the types of tests to be combined in each situation is fundamental, both for the accuracy of the results and for the reduction of costs [3]. In this process, it is necessary to observe the variables that affect the test results and the correlations, being in mind that some tests are more sensitive than others.
In previous studies, Lopes and Nepomuceno [5-8] have analysed a set of NDT methods for application in normal and high strength vibrated concretes. The studied methods include: the surface hardness test, using the Schmidt hammer type N; the ultrasonic pulse velocity test, using the PUNDIT; the penetration resistance test, using the Windsor probe test system (WPTS); the pull-out test, using
1234567890
WMCAUS IOP Publishing
IOP Conf. Series: Materials Science and Engineering 245 (2017) 032025 doi:10.1088/1757-899X/245/3/032025
the Capo-test system and the pull-off test, using the Bond-test system. From this study, the authors have found that the penetration resistance test using the WPTS is limited to concrete elements of compressive strength up to 55 MPa and they proposed an Alternative Firing Apparatus (AFA) for high strength concrete [5-8]. This AFA is not still covered by standards and its use cannot be generalised. It was also verified that the pull-off test, using the Bond-test system, is limited to concrete compressive strength up to 55 MPa, due to lower tensile strength of the adhesive material used to glue the cylindrical disks to concrete surface, leading to a high number of invalid readings when testing concrete with strengths over that limit. It was concluded that, except for penetration resistance and pull-off tests, all other tests listed in this study may be used in high strength concrete.
In the last decade, many structures have been produced using self-compacting concrete (SCC), which can be considered a new type of concrete. The SCC presents some specificities when compared to normal vibrated concrete (NVC), namely a higher dosage of paste and a smaller volume of coarse aggregates. The maximum size of the coarse aggregates is also reduced in the SCC to prevent the blocking effect. Such specificities of SCC are likely to affect the results of NDT compared to those obtained in NVC, with the same level of compressive strength and materials of the same nature. Studies in SCC performed by Nepomuceno et al. [9] have revealed good correlations between compressive strength and NDT readings for the surface hardness test, ultrasonic pulse velocity test, pull-out test and maturity test, but with small differences when compared to correlations obtained in normal vibrated concrete with the same level of compressive strength.
An important step in the application of NDT methods concerns the interpretation and validation of the test results. In general, interpretation of NDT results should involve three distinct phases leading to the development of conclusions: processing of collected data, analysis of within-test variability and quantitative evaluation of property under investigation. The analysis of within-test variability can provide valuable information, since this can be compared with that of within-test variability associated with the NDT method in use, either to provide a measure of the quality control or to detect the presence of abnormal circumstances during the in-situ application.
After almost two decades of experience in application of NDT tests in different types of concretes, the authors have collected a significant number of test results to justify an analysis of within-test variability of the most used NDT for in-situ evaluation of concrete compressive strength. Those tests were selected based on the existence of standards, its large application and/or its user-friendly characteristics and includes: the surface hardness test, the ultrasonic pulse velocity test; the penetration resistance test; the pull-out test, the pull-off test and the maturity meter test.
The procedures adopted were based on British Standards (BS) and American Standards (ASTM). The analysis of within-test variability shows the variation of statistical parameters (standard deviation and coefficient of variation) with variation of concrete compressive strength. The aim was to identify typical behaviour of those parameters which better represent the repeatability. The results obtained are compared to those found in references of similar research works.
2. Experimental program
2.1. Materials, mix-design, production of specimens and properties.
For NVC, ten mixtures were produced based on Faury method [10]. Five of these mixtures were of NSC, identified as N27, N29, N30, N31 and N33. The other five mixtures were of HSC, identified as N34, N35, N36, N37 and N38. For NSC the water/cement ratio varied from 0.38 to 0.57 and concrete compressive strength varied from 18 to 53 MPa in cubes of 150 mm. For HSC, the water/cement ratio varied from 0.26 to 0.36 and concrete compressive strength varied from 49 to 82 MPa in cubes of 150 mm. All the mixtures included natural sand and coarse aggregates of crushed granite with a maximum dimension of 25.4 mm and a Mohs’ hardness scale level 7. NSC was produced using a Portland cement type CEM II/B-L32.5N and a plasticizer, while in HSC was used a Portland cement type CEM I 42.5R and a superplasticizer. For each strength level a set of specimens was produced. Each set included at least 3 cubes of 150 mm and a slab 170 mm thick, 550 mm wide and 550 to 750 mm long.
3
1234567890
WMCAUS IOP Publishing
IOP Conf. Series: Materials Science and Engineering 245 (2017) 032025 doi:10.1088/1757-899X/245/3/032025
Both the slab and the cube specimens were cast using metallic moulds. For each set of specimens, the cubes and the slab were kept under the same cure conditions. The cube specimens were tested at 28 days for compressive strength evaluation (Table 1). The NDT were applied in the slabs at the same time that cube compressive strength was evaluated. At the time of testing with NDT, the slabs presented a dry surface. Penetration resistance tests and pull-off tests were not applied in HSC due to the limitations of such tests.
Table 1. Compressive strength of NVC.
Series Age [days] fcm [MPa] Sd [MPa] Cv [%]
N27 28 23.80 2.62 11.00 N29 28 37.43 0.87 2.33 N30 28 42.33 1.74 4.11 N31 28 53.18 1.94 3.65 N33 28 17.70 0.47 2.66 N34 28 81.94 1.12 1.37 N35 28 78.35 2.17 2.77 N36 28 49.12 1.02 2.08 N37 28 58.27 0.82 1.41 N38 28 67.77 1.56 2.30
For SCC only one mixture was produced and tested at different ages. For each age of concrete (1, 2, 3, 7, 14, 28 and 94 days), a set of specimens was produced, identified as P1, P2, P3, P7, P14, P28 and P94. Each set includes 1 cube of 200 mm side and 4 cubes of 150 mm side. The cube of 200 mm side was used to accommodate the five pull-out inserts and one maturity meter M20. The cubes of 150
mm side were used for ultrasonic pulse velocity, surface hardness and compressive strength tests. The mix-design of SCC was performed according to the methodology proposed by Nepomuceno et al. [11-13]. The SCC mixture includes a Portland cement type CEM I 42.5R, fly ash, modified polycarboxylate based superplasticizer, natural sand and coarse aggregates crushed from granite with a maximum dimension of 19.1 mm and a Mohs’ hardness scale level 7. After 24 hours, the specimens were demoulded and placed at a temperature of 19 ± 1 °C and RH of 90 ± 5%. Fresh and hardened properties were evaluated according to NP EN 206-9:2010 [14]. Fresh properties of flow capacity (slump-flow with Dm of 780 mm), fluidity (v-funnel t time of 15.6 s) and passing ability (L-box with blocking ratio H2/H1 of 0.92) were obtained. The results of the compressive strength for the different sets of SCC are presented in Table 2. The density of hardened concrete was of 2300 kg/m3.
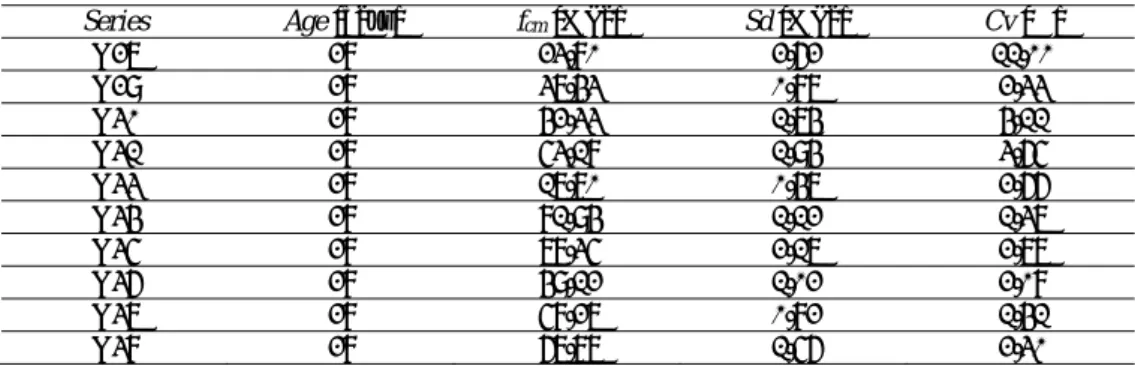
Table 2. Compressive strength of SCC. Series Age [days] fcm [MPa] Sd [MPa] Cv [%]
P1 1 45.31 1.48 3.26 P2 2 58.16 2.21 3.81 P3 3 64.06 2.09 3.26 P7 7 71.92 3.00 4.16 P14 14 81.47 6.16 7.56 P28 28 90.70 1.33 1.46 P94 94 97.00 1.79 1.84
2.2. Surface hardness test.
These tests were performed using a Schmidt rebound hammer, type N, with impact energy of 2.207 N.m. Procedures were based on the BS 1881-202:1986 [15] and BS 1881-201:1986 [16].
For NVC, the same procedure was adopted either for NSC and HSC. Tests were performed in two directions in each slab: rebound hammer in vertical direction (downwards) impacting over the moulded surface in contact with the base of the mould during cast and rebound hammer in horizontal direction impacting over the lateral moulded surfaces. In each direction 12 readings were made.
1234567890
WMCAUS IOP Publishing
IOP Conf. Series: Materials Science and Engineering 245 (2017) 032025 doi:10.1088/1757-899X/245/3/032025
For SCC, after evaluating the compressive strength in 3 cubes, the fourth 150 mm cube of each series was subjected to a tension equivalent to 1/10 of the average compressive stress in failure. This cube was placed between the plates of the compressive test machine to prevent their rebound during test. The Schmidt hammer was applied in the horizontal direction and 9 readings were performed in each of the two opposite faces of the specimen, both moulded and perpendicular to the cast direction.
2.3. Ultrasonic pulse velocity test.
Ultrasonic pulse velocity tests (UPV) were made using a Portable Ultrasonic Non-destructive Digital Indicating Tester (PUNDIT) with electro-acoustical transducers having a natural frequency of 54 kHz. The procedures were based on BS 1881-201:1986 [16] and BS 1881-203:1986 [17].
For NVC, tests were performed in two directions: transducers positioned parallel to cast direction (involving a moulded and an unmoulded surface) and transducers positioned perpendicular to cast direction (involving only moulded surfaces - lateral faces). In NSC the number of readings in each slab was 7 and 10, respectively, for perpendicular and parallel direction. For HSC, this number was reduced to 3 and 9 readings, respectively, for perpendicular and parallel direction.
For SCC, the tests were performed in each of the four 150 mm cube specimens of each series. The transducers were positioned in two opposite and parallel faces of the cubes, involving only moulded faces perpendicular to cast direction. Four individual readings were taken in each series.
2.4. Penetration resistance test.
The Windsor Probe Test System (WPTS) was used for penetration resistance tests. The apparatus was used only in NVC of NSC, since it is limited to strengths up to 55 MPa. Tests with WPTS followed the ASTM C803-90 [18]. Each slab was evaluated by the mean value of 6 individual readings of exposure length. For this research work the standard power was combined with the silver coloured probe of hardened steel alloy with 6.35 mm diameter and 79.5 mm length.
2.5. Pull-out test.
Pull-out tests were performed using two systems developed by Germann Instruments A/S, the Capo-test and the Lok-test. The two systems are similar, both involving an insert (25 mm diameter ring) placed at a depth of 25 mm and a reaction ring of 55 mm inner diameter. The main difference is that in Lok-test the insert is placed in the concrete before concreting. For concrete compressive strengths lower than 55 MPa, the load was applied using a portable hand operated hydraulic jack with maximum load capacity of 60 kN, while for higher strengths another with maximum load of 150 kN was used. Test procedures were supported by BS 1881-201:1986 [16] and BS 1881-207:1992 [19].
For NVC the Capo-test system was used. Tests were performed in the lateral moulded faces of the slabs. A number of 5 valid readings were obtained for each slab.
For SCC, the Lok-test system was used. Tests were performed in the base and in each of the lateral moulded faces of the 200 mm cube specimen, totalizing 5 valid readings for each set.
2.6. Pull-off test.
The Bond-test system developed by Germann Instruments A/S was used for pull-off test. These tests were performed using a portable hand operated hydraulic jack of maximum load capacity of 60 kN coupled with a circular steel disc with a diameter of 75 mm and 30 mm thick. All the tests were made with partial coring of concrete to a depth of 40 mm. Test procedures were supported by BS 1881-201:1986 [16] and BS 1881-207:1992 [19]. The pull-off tests were applied in top faces of the slabs (unmoulded faces) and 6 readings were made in each slab. Tests were made only in NVC of NSC, since it is limited to strengths up to 55 MPa.
2.7. Maturity test.
This test was performed only in SCC using the COMA-Meter (COncrete MAturity-Meter) with the scale of 0 to 14 M20 days. The COMA-Meter consists of a closed tube containing a special liquid.
5
1234567890
WMCAUS IOP Publishing
IOP Conf. Series: Materials Science and Engineering 245 (2017) 032025 doi:10.1088/1757-899X/245/3/032025
Immediately prior to the start of the test the capillary tube was broken at its upper end, inserted into the shell and then placed in concrete from the surface. The liquid inside the capillary tube begins to evaporate due to the temperature of the concrete. Fixed to the tube is a slide showing a scale in days of equivalent maturity M20. Maturity meters were placed in the 200 mm cubes specimens of series P1,
P2, P3, P7 and P14. Readings of maturity M20 were carried out after 1, 2, 3, 7 and 14 days. 3. Results and discussions
3.1. Surface hardness test
The results obtained when using the surface hardness test in NVC are presented in Table 3 while for SCC are presented in Table 4.
The first objective was to detect differences in standard deviation (Sd) when testing concrete with Schmidt hammer in vertical and horizontal direction, either for normal and high strength vibrated concretes. The results for NVC of NSC show that when testing in vertical direction (downwards) the
Sd varied from 0.84 to 1.54 being the average 1.16, while in horizontal direction the Sd varied from
0.70 to 1.93 being the average 1.36. For NVC of HSC, when testing in vertical direction (downwards) the Sd varied from 0.66 to 1.20 being the average 0.90, while in horizontal direction the Sd varied from 0.71 to 1.19 being the average 1.01. In view of these results it can be pointed out that there is no significant difference when comparing tests in vertical with horizontal direction, either for normal and high strength vibrated concretes. Therefore, the results of Sd can be computed for NVC of compressive strengths up to 82 MPa, with a variation between 0.66 to 1.93 and a mean value of 1.11.
The second objective was to detect differences in Sd when testing NVC and SCC. For SCC, when tests were made in horizontal direction, the Sd varied from 0.63 to 2.24 being the average 1.21. Again, there is no significant difference when testing NVC or SCC. Thus, the Sd of 12 individual readings of the rebound number, which could be expected in a location of NVC and SCC with compressive strength up to 97 MPa has shown a variation between 0.63 to 2.24 and a mean value of 1.13.
Similar analysis was done for the coefficient of variation (Cv), and it was verified that for NVC of NSC tested in vertical direction (downwards) the Cv varied from 2.6 to 4.4% being the average 3.6%, while in horizontal direction the Cv varied from 2.8 to 5.0% being the average 4.2%. For NVC of HSC, when testing in vertical direction (downwards) the Cv varied from 1.3 to 2.7% being the average 1.9%, while in horizontal direction the Cv varied from 1.5 to 2.9% being the average 2.1%. It seems that the results of Cv are not affected by the direction of testing. However, the Cv tends to be slightly lower as concrete compressive strengths increases, when using NVC. Nevertheless, if all the results for NVC of compressive strengths up to 82 MPa are computed together, including tests in horizontal and vertical directions, the Cv varies between 1.3 to 5.0% and presents a mean value of 3.0%.
Table 3. Surface hardness test in NVC.
Series Tested in vertical direction (downwards) Tested in horizontal direction
R Sd Cv [%] R Sd Cv [%] N27 29.53 1.02 3.50 29.98 1.25 4.17 N29 32.10 0.84 2.62 32.06 1.31 4.09 N30 35.37 1.54 4.35 31.86 1.60 5.01 N31 41.57 1.49 3.59 38.84 1.93 4.96 N33 23.10 0.91 3.92 25.33 0.70 2.78 N34 50.82 0.84 1.64 53.52 1.16 2.18 N35 50.80 0.66 1.29 52.92 1.05 1.98 N36 42.28 0.78 1.84 40.47 1.19 2.94 N37 44.42 1.20 2.71 46.10 0.71 1.54 N38 48.60 1.01 2.09 49.00 0.93 1.91
For SCC, when tests were made in horizontal direction, the Cv varied from 1.3 to 4.9% being the average 2.7%. Comparing the Cv for NVC and SCC it can be said that the values are quite similar and
1234567890
WMCAUS IOP Publishing
IOP Conf. Series: Materials Science and Engineering 245 (2017) 032025 doi:10.1088/1757-899X/245/3/032025
there is no justification to interpret it separately. Therefore, the Cv of 12 individual readings of the rebound number, which could be expected in a location of NVC and SCC with compressive strength up to 97 MPa has shown a variation between 1.3 to 5.0% and a mean value of 2.9%. These results are accordingly to those reported by Bungey [20], which points a typical Cv of about 4% when testing different locations of the same element produced from different concrete mixes of good quality.
In view of the results presented, it can be said that the Sd is the statistical parameter which better represents the repeatability of surface hardness test, since this value remains reasonably constant as concrete compressive strength increases, while the Cv tends to decrease with compressive strength.
Table 4. Surface hardness test in SCC.
Series R Sd Cv [%] P1 37.44 0.63 1.69 P2 41.00 1.20 2.92 P3 43.06 1.07 2.49 P7 45.39 1.39 3.06 P14 45.44 2.24 4.93 P28 47.56 1.26 2.65 P94 49.61 0.65 1.31
3.2. Ultrasonic pulse velocity test
Table 5 shows the results when using PUNDIT in NVC, while Table 6 shows the results for SCC. The first objective was to verify if a significant difference exists in Sd when testing concrete with transducers positioned parallel (involving an unmoulded face) and perpendicular (involving only moulded faces) to cast direction, either for normal and high strength vibrated concretes. For NVC of NSC and transducers in parallel direction, the Sd varied from 0.072 to 0.097 km/s being the average 0.083 km/s, while for perpendicular direction the Sd varied from 0.012 to 0.036 km/s being the average 0.024 km/s. For NVC of HSC and transducers in parallel direction, the Sd varied from 0.020 to 0.067
km/s being the average 0.051 km/s, while for perpendicular direction the Sd varied from 0.006 to 0.086
km/s being the average 0.032 km/s. The Sd shows a tendency to be higher for parallel direction, either for normal and high strength vibrated concrete. Computing all the results for NVC of compressive strengths up to 82 MPa, the Sd shows a variation between 0.020 to 0.097 km/s and a mean value of 0.067 km/s for transducers positioned parallel to cast direction, while for transducers positioned perpendicular the Sd shows a variation between 0.006 to 0.086 km/s and a mean value of 0.028 km/s.
For SCC (Table 6) the transducers were positioned perpendicular to cast direction. In this case, the
Sd varied from 0.011 to 0.063 km/s being the average 0.029 km/s. These results are similar to those
obtained in NVC for transducers positioned perpendicular to cast direction. Based on these results, it can be said that the position of transducers, especially when involving one unmoulded face, can affect the Sd. For transducers positioned perpendicular to cast direction and involving only moulded faces, the results of Sd can be applied to NVC and SCC. Therefore, the Sd of 3 to 7 individual readings of the UPV, which could be expected in a location of NVC and SCC with compressive strength up to 97 MPa has shown a variation between 0.006 to 0.086 km/s and a mean value of 0.028 km/s.
Identical behaviour was found for the coefficient of variation. For NVC of NSC, with transducers positioned parallel to cast direction, the Cv varied from 1.8 to 2.2% being the average 1.9% and for the perpendicular direction the Cv varied from 0.3 to 0.8% being the average 0.6%. For NVC of HSC, with transducers positioned parallel to cast direction, the Cv varied from 0.5 to 1.5% being the average 1.1% and for the perpendicular direction the Cv varied from 0.1 to 1.9% being the average 0.7%. Computing all the results for NVC of compressive strengths up to 82 MPa, the Cv shows a variation between 0.5 to 2.2% being the average 1.5%for transducers positioned parallel to cast direction, while for transducers positioned perpendicular the Sd shows a variation between 0.1 to 1.9% being the average 0.6%.
For SCC (Table 6), the Cv varied from 0.2 to 1.3% being the average 0.6%. The results are similar to those obtained in NVC for transducers positioned perpendicular. Thus, the Cv of 3 to 7 individual
7
1234567890
WMCAUS IOP Publishing
IOP Conf. Series: Materials Science and Engineering 245 (2017) 032025 doi:10.1088/1757-899X/245/3/032025
readings of the UPV, which could be expected in a location of NVC and SCC with compressive strength up to 97 MPa has shown a variation between 0.1 to 1.9% and a mean value of 0.6%.
In view of the results presented, there is no evidence of the statistical parameter (Sd or Cv) which better represents the repeatability of ultrasonic pulse velocity test.
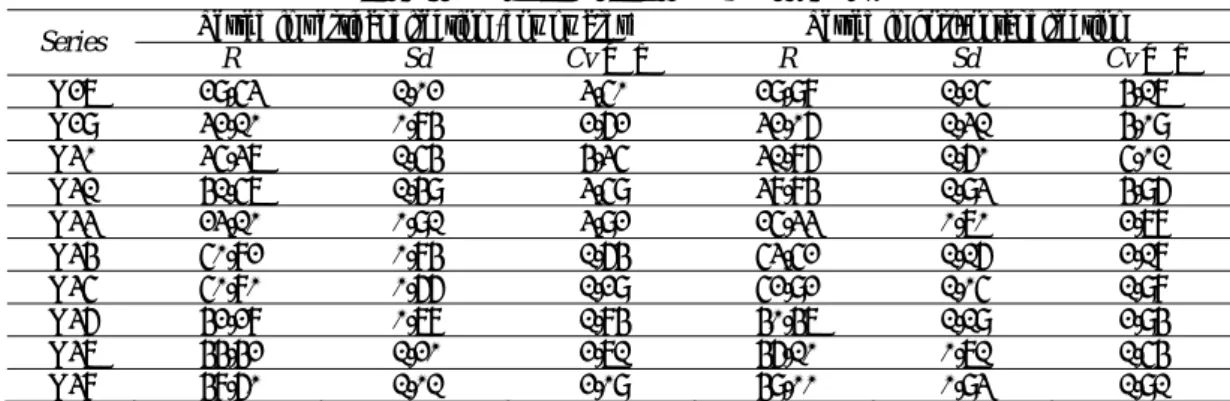
Table 5. Ultrasonic pulse velocity in NVC.
Series Parallel to casting direction Perpendicular to casting direction V [km/s] Sd [km/s] Cv [%] V [km/s] Sd [km/s] Cv [%] N27 4.371 0.081 1.86 4.195 0.018 0.43 N29 4.306 0.080 1.86 4.403 0.026 0.59 N30 4.419 0.084 1.90 4.367 0.036 0.82 N31 4.478 0.097 2.16 4.476 0.012 0.28 N33 4.076 0.072 1.78 4.064 0.028 0.70 N34 4.425 0.020 0.45 4.565 0.010 0.22 N35 4.574 0.067 1.46 4.615 0.006 0.13 N36 4.460 0.067 1.49 4.445 0.039 0.87 N37 4.559 0.043 0.95 4.524 0.086 1.91 N38 4.521 0.057 1.27 4.548 0.021 0.46
Table 6. Ultrasonic pulse velocity in SCC. Series V [km/s] Sd [km/s] Cv [%] P1 4.31 0.035 0.82 P2 4.44 0.011 0.24 P3 4.57 0.025 0.56 P7 4.64 0.030 0.64 P14 4.80 0.063 1.31 P28 4.84 0.022 0.45 P94 4.83 0.015 0.31
3.3. Penetration resistance test.
Table 7 shows the results for NVC of NSC when the WPTS was used. The Sd of 6 individual readings of exposure length in NSC varied from 1.54 to 3.34 mm being the average 2.10 mm. Under the same conditions, the Cv varied from 3.10 to 8.5% being the average 4.5%. Those values could be regarded as typical in the light of the references. Using an identical apparatus and probes, Malhotra and Carette [21] reported a Sd of exposure length between 1.37 and 4.05 mm, while the Cv varied from 3.4 to 8.3% being the average 5.5%. Also, the BS 1881-207 [19] and Bungey and Millard [1] have pointed out as probable that Cv in a location under in-situ conditions will not exceed 5%.
Table 7. Penetration resistance tests in NVC.
Series E [mm] Sd [mm] Cv [%] N27 43.59 1.54 3.53 N29 51.52 1.65 3.20 N30 52.97 1.64 3.10 N31 54,70 2.34 4.27 N33 39.14 3.34 8.53 3.4. Pull-out test
The results for the pull-out test in NVC are shown in Table 8, while the results for SCC are presented in Table 9. The first observation should be done for the Cv obtained in specimen N33, which could be assumed as an abnormal result and, for that reason, was excluded from the present analysis.
For NVC of NSC the Sd varied from 1.30 to 5.19 kN being the average 2.63 kN, while for NVC of HSC the Sd varied from 1.24 to 3.46 kN being the average 2.42 kN. There is no significant difference between Sd for normal and high strength vibrated concrete. Computing all the results for NVC of compressive strengths up to 82 MPa, the Sd varied between 1.24 to 5.19 kN being the average 2.53 kN.
1234567890
WMCAUS IOP Publishing
IOP Conf. Series: Materials Science and Engineering 245 (2017) 032025 doi:10.1088/1757-899X/245/3/032025
For SCC, the Sd varied from 1.13 to 4.27 kN being the average 2.17 kN. These values are quite similar to those obtained in NVC, which means that Sd could be specified both for NVC and SCC. In view of the results presented, the Sd of 6 individual readings of the pull-out force, which could be expected in a location of NVC and SCC with compressive strength up to 97 MPa varies from 1.13 to 5.19 kN being the average 2.38 kN. The obtained results are according to typical variation suggested by Krenchel e Petersen [2], who have reported as typical Sd values between 1.9 kN and 2.5 kN when pull-out test is applied in 150 mm cube specimens and nearly 2.8 kN when larger specimens are used (as in the present research work).
For NVC of NSC the Cv varied from 3.9 to 12.9% being the average 7.6%, while for NVC of HSC the Sd varied from 2.9 to 7.0% being the average 5.1%. For NVC, there is a tendency to the decrease of Cv as concrete compressive strength increases.
For SCC, the Sd varied from 3.0 to 8.0% being the average 4.9%. These values are quite similar to those of NVC of HSC. In fact, in both cases, the concrete compressive strengths are higher than 45 MPa. If all the results of NVC and SCC are computed together, the Cv will vary from 2.9 to 12.9% being the average 5.6%. The obtained results are according to the typical ones observed in references. In fact, Krenchel and Petersen [2] reported as typical the mean values of Cv between 6.8% and 7.5% when pull-out test is used in 150 mm cube specimens. For larger specimens, the typical Cv appears to be nearly 9.9% [2]. The BS 1881-207 [19] points out that the typical value of the in-situ Cv of pull-out tests in a location is about 7%. Carino [22] reported as typical a Cv between 4 and 15% with a mean value of 8%, when using different test geometry, different type of aggregates with different maximum dimensions and specimens of different sizes. The research reported by Carino [22] shows an increase of the Sd as concrete compressive strength increases, while the Cv remains reasonably constant. These results led Carino [22] to conclude that the Cv would better represent the test repeatability.
Considering the results obtained in the present research work, it can be said that probably the Sd will better represent the within-test variability of the pull-out test then the Cv.
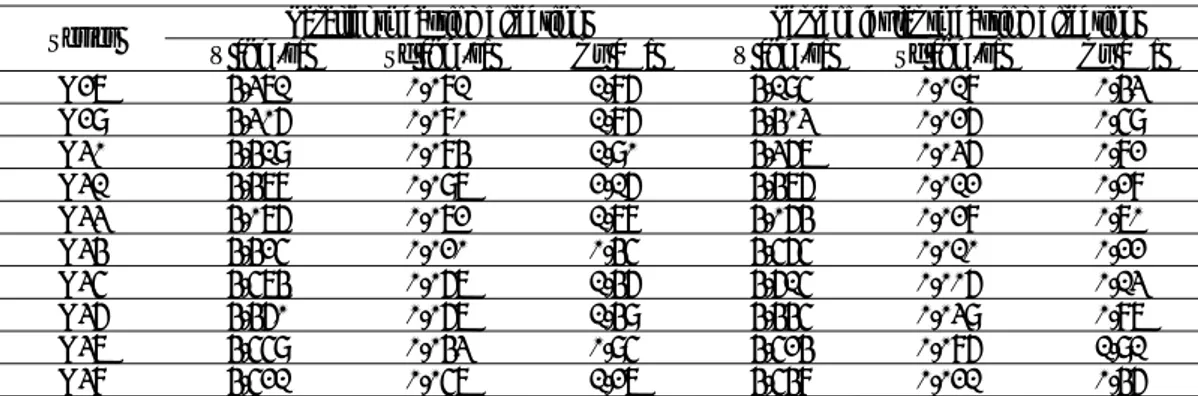
Table 8. Pull-out tests in NVC.
Series P [kN] Sd [kN] Cv [%] N27 23.4 1.44 6.15 N29 33.54 1.30 3.87 N30 32.05 2.41 7.50 N31 40.22 5.19 12.90 N33 14.96 2.83 18.92 N34 58.14 2.70 4.64 N35 58.03 2.34 4.03 N36 35.22 2.38 6.76 N37 42.54 1.24 2.91 N38 49.29 3.46 7.02
Table 9. Pull-out tests in SCC.
Series P [kN] Sd [kN] Cv [%] P1 26.81 1.50 5.58 P2 34.51 1.50 4.34 P3 35.69 1.13 3.15 P7 43.20 1.29 2.98 P14 47.74 3.23 6.76 P28 53.07 4.27 8.04 P94 60.96 2.25 3.69 3.5. Pull-off tests
The results obtained by using the Bond-test system in NVC are presented in Table 10. The Sd of pull-off stress varied from 0.16 to 0.42 MPa being the average 0.28 MPa, while the Cv varied from 4.5 to 12.2% being the average 9.0%. There is no clear tendency regarding the variation of Sd or Cv as
9
1234567890
WMCAUS IOP Publishing
IOP Conf. Series: Materials Science and Engineering 245 (2017) 032025 doi:10.1088/1757-899X/245/3/032025
concrete compressive strength increases. The mean value of Cv could be regarded as normal according to references. The BS 1881-207 [19] reported as typical a Cv of about 10% under in-situ conditions.
Table 10. Pull-off tests in NVC.
Series Pull-off force (F) Pull-off stress (T)
(*) F [kN] Sd [kN] Cv [%] T [MPa] Sd [MPa] Cv [%] N27 12.36 1.33 10.76 2.73 0.29 10.76 N29 15.60 0.71 4.53 3.44 0.16 4.53 N30 14.57 0.92 6.34 3.21 0.20 6.34 N31 17.23 1.90 11.03 3.80 0.42 11.03 N33 11.48 1.40 12.22 2.53 0.31 12.22
(*) Core dimensions in “Pull-off”: 76 mm diameter (cross section = 4535 mm2).
3.6. Maturity meter test
The results obtained in SCC by using the Maturity meter test M20 are shown in Table 11. The Sd of
5 individual readings of M20 varied from 0.09 to 0.70 days being the average 0.26 days, while the Cv
varied from 3.7 to 7.1% being the average 5.1%. The Sd tends to increase as concrete compressive strength increases, while the Cv remains almost constant. In the light of the obtained results, it can be said that the Cv will better represents the repeatability of maturity meter test.
Table 11. Maturity meter test of SCC.
Series M20 [days] Sd [days] Cv [%]
P1 1.26 0.089 7.10 P2 2.29 0.114 4.98 P3 3.26 0.119 3.66 P7 6.64 0.263 3.96 P14 11.92 0.698 5.85 4.
Conclusions
A general conclusion of the present study with respect to the within-test variability analysis is summarized in Table 12. This table presents the standard deviation (Sd) and the coefficient of variation (Cv) that could be expected in a location of different types of concrete of good quality, taking in consideration the type of NDT, the number of individual readings (N) and the interval of compressive strength (fcm). In Table 12, the statistical parameter which better represents the
repeatability of each NDT is underlined. If no significant tendency was detected, no values were underlined.
Table 12. Within-test variability for NVC and SCC.
NDT Type of concrete N Read. Measure [Units] fcm [MPa]
Standard deviation (Sd) Coef. of variation (Cv) Min. Max. Mean Min. Max. Mean
SH(1) NVC+SCC 9-12 R [---] 17-97 0.63 2.24 1.13 1.3 5.0 2.9 UPV(2) NVC 9-10 V [km/s] 17-82 0.020 0.097 0.067 0.5 2.2 1.5 UPV(3) NVC+SCC 3-7 V [km/s] 17-97 0.006 0.086 0.028 0.1 1.9 0.6 PR NVC 6 E [mm] 17-53 1.54 3.34 2.10 3.1 8.5 4.5 Pull-out NVC+SCC 5 P [kN] 17-97 1.13 5.19 2.38 2.9 12.9 5.6 Pull-off NVC 6 T [MPa] 17-53 0.16 0.42 0.28 4.5 12.2 9.0 M20 SCC 5 M20 [days] 45-97 0.09 0.70 0.26 3.7 7.1 5.1
SH (Surface hardness); UPV (ultrasonic pulse velocity); PR (Penetration resistance);(1) Tests made in horizontal or vertical direction (downwards); (2) Transducers positioned parallel to cast direction (involving an unmoulded face); (3) Transducers positioned perpendicular to cast direction (involving only moulded faces); Sd (Standard deviation with the same units as the measured value); Cv (Coefficient of variation, in percentage). References
[1] J. H. Bungey, S. G. Millard, “Testing of Concrete in Structures”, 3th edition, London, Chapman
1234567890
WMCAUS IOP Publishing
IOP Conf. Series: Materials Science and Engineering 245 (2017) 032025 doi:10.1088/1757-899X/245/3/032025
[2] H. Krenchel, C. G. Petersen, “In-situ Pullout Testing with Lok-test. Ten Years’ Experience”,
International Conference on In situ/ Non-destructive Testing of Concrete, Ottawa, Oct. 1984.
[3] M. C. S. Nepomuceno, “Non-Destructive Tests on Concrete”, P.A.P.C.C., University of Beira
Interior (UBI), Covilhã, Portugal, 1999 (Portuguese).
[4] M. C. S. Nepomuceno, S. M. R. Lopes, “Non-destructive Tests on Concrete”, Journal of
Concrete Technology Today Incorporating Structural Steel, Trade Link Media, Singapore,
Jul.-Sept., 2002, pp. 14-20.
[5] S. M. R. Lopes, M. C. S. Nepomuceno, “A Comparative Study of Penetration Resistance Apparatus on Concrete”, Proc. of ICCE/4, Hawaii, David Hui Edition, 1997, pp. 615-616. [6] S. M. R. Lopes, M. C. S. Nepomuceno, “Evaluation of In-place Concrete Strength by
Near-to-surface Tests”, 12th European Ready Mixed Concrete Congress, APEB, Lisbon, Portugal, June 1998, pp. 338-347.
[7] S. M. R. Lopes, M. C. S. Nepomuceno, “High Strength Concrete: Penetration Resistance Tests on High Strength Concrete”, 1st International Conference on High Strength Concrete, ASCE, USA, 1999, pp. 425-433.
[8] S. M. R. Lopes, M. C. S. Nepomuceno, “Non-Destructive Tests on Normal and High Strength Concrete”, 26th Conference on Our World in Concrete & Structures, vol. XX, Singapore, 2001, pp. 53-67.
[9] M. C. S. Nepomuceno, L. A. Pereira-de-Oliveira and J. J. B. Costa, “Non-Destructive Tests on Self-compacting Concrete”, IV Ibero-American Congress on Self-compacting Concrete,
BAC2015, FEUP, 6-7 July, 2015, pp. 289-298 (Portuguese).
[10] M. C. S. Nepomuceno, “Mix design of concrete”, P.A.P.C.C., University of Beira Interior (UBI), Covilhã, Portugal, 1999 (Portuguese).
[11] M. C. S. Nepomuceno, L. A. Pereira-de-Oliveira and S. M. R. Lopes, “Methodology for mix design of the mortar phase of self-compacting concrete using different mineral additions in binary blends of powders”, Construction and Building Materials, 26(1), 2012, pp. 317-326 [12] M. C. S. Nepomuceno, L. A. Pereira-de-Oliveira and S. M. R. Lopes, “Methodology for the mix
design of self-compacting concrete using different mineral additions in binary blends of powders”, Construction and Building Materials, 64, 2014, pp. 82–94.
[13] M. C. S. Nepomuceno, L. A. Pereira-de-Oliveira, S. M. R. Lopes and R. M. C. Franco, “Maximum coarse aggregate's volume fraction in self-compacting concrete for different flow restrictions”, Construction and Building Materials, 113, 2016, pp. 851-856.
[14] NP EN 206-9:2010, “Concrete. Additional rules for self-compacting concrete (SCC)”. IPQ, Lisbon, 2010 (Portuguese).
[15] British Standard BS 1881-202:1986, “Testing Concrete: Recommendations for Surface Hardness Testing by Rebound Hammer”, London, British Standards Institution, 1986. [16] British Standard BS 1881-201:1986, “Testing Concrete: Guide to the Use of Non-destructive
Methods of Test for Hardened Concrete”, London, British Standards Institution, 1986. [17] British Standard BS 1881-203:1986, “Testing Concrete: Recommendations for Measurement of
Velocity of Ultrasonic Pulses in Concrete”, London, British Standard Institution, 1986. [18] ASTM C803-90, “Standard Test Method for Penetration Resistance of Hardened Concrete”,
Philadelphia, American Society for Testing and Materials, 1990.
[19] British Standard BS 1881-207:1992, “Testing Concrete. Recommendations for the Assessment of Concrete Strength by Near-to-surface Tests”, London, British Standards Institution, 1992. [20] J. H. Bungey, “Concrete Strength Variations and In-place Testing”, 2nd Australian Conference
on Engineering Materials, University of New South Wales, Sydney, 1981, p. 85-96.
[21] V. M. Malhotra, G. G. Carette, “Penetration Resistance Methods”, Handbook on Nondestructive Testing of Concrete, Florida (EUA), CRC Press Inc., 1991, pp. 19-38.
[22] J. N. Carino, “Pullout Test, Handbook on Nondestructive Testing of Concrete”, Florida (EUA),