SCRS/2018/095 Collect. Vol. Sci. Pap. ICCAT, 75(3): 457-475 (2018)
AGE AND GROWTH OF SHORTFIN MAKO IN THE SOUTH ATLANTIC
D. Rosa1, F. Mas2, A. Mathers3,4,
L.J. Natanson5, A. Domingo2, J. Carlson3, R. Coelho1,*
SUMMARY
The shortfin mako, Isurus oxyrinchus (Lamnidae), is regularly caught as by-catch in pelagic longline fisheries and is among the most vulnerable sharks to this fishery. The age and growth of I. oxyrinchus was studied along a wide South Atlantic region. Data from 332 specimens ranging in size from 90 to 330 cm fork length (FL) for females and 81 to 250 cm FL for males
were analysed. Growth models were fitted using the von Bertalanffy growth equation re-parameterised to calculate L0, instead of t0, and a modification of this equation using the
known size at birth. The von Bertalanffy growth equation with fixed L0 (size at birth = 63 cm
FL) with resulting growth parameters of Linf = 218.5 cm FL, k = 0.170 year-1 for males and Linf
= 263.1 cm FL, k = 0.112 year-1 for females, seemed to underestimate maximum length for this
species, while overestimating k. Given the poorly estimated parameters we cannot, to this point, recommend the use of the South Atlantic growth curves.
RÉSUMÉ
Le requin-taupe bleu, Isurus oxyrinchus (Lamnidae), est régulièrement capturé en tant que prise accessoire dans les pêcheries palangrières pélagiques et figure parmi les requins les plus vulnérables à cette pêcherie. L'âge et la croissance de I. oxyrinchus ont été étudiés le long d'une large région de l'Atlantique Sud. Des données de 332 spécimens mesurant entre 90 et 330 cm de longueur à la fourche (FL) dans le cas des femelles et entre 81 et 250 cm FL dans le cas des mâles ont été analysées. Des modèles de croissance ont été ajustés au moyen de l'équation de croissance von Bertalanffy reparamétrisée afin de calculer L0 , au lieu de t0, et une modification de cette équation au moyen de la taille connue à la naissance. L'équation de croissance de von Bertalanffy avec L0 fixe (taille à la naissance = 63 cm FL) avec les paramètres de croissance résultants de Linf = 218,5 cm FL, k = 0,170 an-1 pour les mâles et Linf = 263,1 cm FL, k = 0,112 an-1 pour les femelles, semblait sous-estimer la longueur maximale de cette espèce, tout en surestimant k. Étant donné que les paramètres sont mal estimés, il n’est pour l’instant pas recommandé d’utiliser les courbes de croissance de l'Atlantique Sud.
RESUMEN
El marrajo dientuso, Isurus oxyrinchus (Lamnidae) se captura regularmente de forma fortuita en las pesquerías de palangre pelágico y es una de las especies de tiburones más vulnerable a esta pesquería. Se estudió la edad y crecimiento de I. oxyrinchus en las aguas de una amplia
región del Atlántico sur. Se analizaron los datos de 332 ejemplares con tallas de entre 90 y 330
cm de longitud a la horquilla (FL) para las hembras y tallas de entre 81 y 250 cm FL para los machos. Los modelos de crecimiento se ajustaron utilizando la ecuación de crecimiento de von Bertalanffy reparametrizada para calcular L0 en lugar de t0, y una modificación de esta ecuación utilizando una talla de nacimiento conocida. La ecuación de crecimiento von Bertalanffy con L0 fija (talla en el nacimiento = 63 cm FL), con parámetros de crecimiento resultantes de Linf = 218,5 cm FL, k = 0,170 año-1 para los machos y Linf = 263,1 cm FL, k = 0,112 año-1 para las hembras, parecía subestimar la talla máxima para esta especie, mientras que sobrestimaba k. Dada la mediocre estimación de los parámetros, no se puede por el momento recomendar la utilización de las curvas de crecimiento para el Atlántico sur.
KEYWORDS
Age and growth; Isurus oxyrinchus; Life history parameters; Shortfin mako
1 IPMA - Portuguese Institute for the Ocean and Atmosphere. Av. 5 de Outubro s/n, 8700-305 Olhão, Portugal.
2 DINARA - Dirección Nacional de Recursos Acuáticos, Laboratorio de Recursos Pelágicos (LaRPe), Montevideo, Uruguay. 3 NOAA Fisheries - Southeast Fisheries Science Center. Panama City, FL, US.
4 Riverside Technology, Inc.
5 NOAA Fisheries - Northeast Fisheries Science Center. Narragansett Laboratory, RI, US.
1. Introduction
In general, elasmobranch species have K-strategy life cycles, characterized by slow growth rates and reduced reproductive potential (Cortés et al., 2015). In general, these characteristics make these fishes vulnerable to fishing pressure with overexploitation occurring even at relatively low levels of fishing mortality. The shortfin mako (Isurus oxyrinchus) is a highly migratory species found in tropical and temperate waters worldwide (Compagno, 2001). As with other pelagic shark species, I. oxyrinchus is commonly caught as bycatch by pelagic fisheries; it is the second most common shark species in these fisheries (Mejuto et al. 2008). Contrary to other shark species, shortfin makos are usually retained for their valuable meat and fins (Compagno, 2001). In the Atlantic, Cortés et al. (2015) conducted an ecological risk assessment which considered the shortfin mako as one of the most susceptible species to the pelagic longline fisheries. It was also between the five most vulnerable species due to its high susceptibility and low productivity (Cortés et al., 2015).
Information on age and growth is often used to estimate natural mortality or total mortality, which are important components of stock assessment models, and in the calculation of population and demographic parameters such as population growth rates and generation times (Ricker, 1975). Therefore, understanding the age structure and growth dynamics of a population is crucial for the application of biologically realistic stock assessment models and, ultimately, for effective conservation and management. Successful fisheries management thus require precise and accurate age information to make informed decisions, and inaccurate age estimates can lead to serious errors in stock assessments and possibly to overexploitation (Campana, 2001).
Despite their importance to fisheries, there are still uncertainties in the age and growth parameters for shortfin mako, particularly due to assumptions on band deposition rate, with some studies using a one band pair per year hypothesis while others assume a deposition of two band pairs per year (e.g. Bishop et al., 2006; Doño et al., 2015; Semba et al., 2009). The first studies on age and growth and band deposition for this species reached different conclusions regarding band pair deposition periodicity. Pratt and Casey (1983) assumed a biennial periodicity while Cailliet et al. (1983) assumed an annual periodicity. Since then, several studies have addressed this issue, both in the Pacific and in the Atlantic Ocean using different techniques. Semba et al. (2009), Ribot-Carballal et al. (2005) and Cerna & Licandeo (2009) through centrum edge analysis found that the band pair deposition rate is annual. Furthermore, in the Atlantic, annual periodicity was validated using bomb radiocarbon techniques (Campana et al., 2002; Ardizzone et al., 2006) and oxytetracycline (OTC) tagging (Natanson et al., 2006). In the Pacific Ocean a two-band pair per year pattern was validated for juvenile specimens based on oxytetracycline tagging and a one band pair per year was validated for adults (Wells et al., 2013; Kinney et al. 2016). It has been suggested that this species might shift from depositing two band pairs per year to one band pair per year after reaching maturity. Differences in the deposition rate will have influence in the growth rate, longevity and mortality (Barreto et al., 2016).
Additionally, most of the previous studies carried out in the Atlantic have focused on relatively small areas when the geographical range of the species is considered. As such, there is the need to carry out a new and large scale Atlantic wide study that covers a wide area. Therefore, within the ICCAT SRDCP, a specific study for the age and growth of the shortfin mako in the Atlantic was developed. The main objective of this study is to improve the knowledge and biological information for I. oxyrinchus, by providing new data on the age and growth parameters of this species throughout a wide Atlantic region. In 2017, an update of the project was presented to the SCRS (Rosa et al., 2017) which presented growth curves for the North stock. The objectives of this paper are now to present the current development status of the growth models for the South Atlantic Ocean.
2. Methods
2.1 Sampling and processing
Samples were collected by IPMA, NOAA and DINARA from commercial fishing vessels, sports fishing and research vessels, respectively, over an Atlantic wide area (Figure 1). Specimens were measured for fork length (FL, cm), location, sex, maturity stage and other biological parameters were also collected. A section of four to eight vertebrae was extracted from the region below the base of the first dorsal fin and transported to the laboratories. In the laboratory, the covering connective tissue of the vertebrae was removed, and once cleaned;
reflected light and image processing software (model NIS Elements, version 4.40, Nikon, Inc.). The second method used by the other laboratories (IPMA, DINARA and NOAA-SEFSC) used a Buehler Isomet (Lake Bluff, IL) low-speed saw, using two blades spaced by approximately 0.5 mm apart. One, or both sides, of the section from IPMA and DINARA samples were stained with crystal violet (Sigma-Aldrich Co., St. Louis, MO). Once dried, the sections were mounted onto microscope slides with Cytoseal 60 (Thermo Fisher Scientific Inc., Waltham, MA). Vertebral sections were digitally photographed under a dissecting microscope using transmitted white light. For both methods, vertebrae were cut sagittally and the resulting section included the focus of the vertebra and the two halves (one on each side of the focus), in a form typically called “bow-tie”. Photographs were digitally enhanced using Adobe Photoshop to improve the contrast of the growth bands and minimize differences between the different methodologies (Figure 2).
2.2 Age estimation and comparison of age readings
To ensure that vertebral counts were consistent between laboratories, a three-laboratory inter-calibration study was done including researchers from NOAA-NEFSC, NOAA-SEFSC, IPMA and DINARA (Anon., 2016). Digital images of 60 vertebrae were used as a reference set. The ageing criteria were discussed and readers counted the band pairs (consisting of one opaque and one translucent band) without prior knowledge of the characteristics (FL and sex) of the samples. All counts were made using enhanced digital images although the actual samples were available if necessary. The final reference set consisted of 57 vertebrae (19 samples from each laboratory), with agreed ages between researchers and laboratories to ensure consistency between readers. An annual deposition rate was assumed, based on validation studies in the Atlantic (Campana et al., 2002; Ardizzone et al., 2006; Natanson et al., 2006). Also, it was considered that immediately after the deposition of the birth mark and in the first few years, there are often smaller bands (shadow bands) deposited close together to the actual growth bands, and those are likely the ones that are considered in some studies as 2-bands per year in the smaller size classes. However, in larger specimens (larger vertebrae) those smaller bands deposited closely together after the birth mark tend to disappear (join together), and were not considered as yearly growth marks in this study. These shadow bands were not counted during the age estimation process (Figure 2).
Based on the criteria from the inter-calibration, band pairs were counted twice by three readers (one from each laboratory), for growth curve analysis in the South Atlantic (latitude < 5 ºN). Each reading was finalized before starting the next one to prevent reader familiarity with any particular vertebra. The second reading of each reader was used for the following analysis. Two methods for accepting a band pair count between readers were used. In the first method (M1) an individual shark would have an accepted estimated age if the band pair counts were in agreement for at least two of the three readers and all others were discarded. In the second method (M2), for the individuals that were not assigned an estimated age using the M1 method, an age (median of the 3 readers) would be attributed if the difference in band counts between any of the three readers was within 1 band pair difference. If the band pair count difference between readers was greater than 1, the sample would be discarded. Inter and intra-reader ageing precision was examined using both the coefficient of variation (CV; Chang 1982) and the average percentage error (APE; Beamish & Fournier 1981) which were calculated and compared. The percentage of agreement (PA) was also calculated. Bias plots were used to graphically assess the ageing accuracy between the three readers (Campana 2001). Precision analysis was carried out using the R language for statistical computing version 3.4.4 (R Core Team 2018), using the package ‘FSA’ (Ogle 2015).
2.3 Growth modelling
Von Bertalanffy growth function (VBGF) re-parameterized to estimate L0 (size at birth) instead of t0 (theoretical age at which the expected length is zero) as suggested by Cailliet et al. (2006), was fit to length at age data:
Lt = Linf –(Linf –L0) × exp (− kt)
Lt = mean fork length at age t; Linf = asymptotic maximum fork length; k = growth coefficient; L0 = fork length at birth.
Two variations of the model were used: 3-parameter calculation estimated Linf, k and L0 and 2-parameter method estimated Linf and k and incorporated a fixed L0. The length at birth described for the species by Mollet et al. (2000) is 70 cm total length (TL). Because size data in our study refers to FL we used the conversion factor from Mas et al. (2014) to convert the size at birth from TL into FL:
All of the growth equations were fit to the length and vertebral band count data using non-linear regression in R (R Core Team 2018). Growth models were fit to vertebral band counts of individual readers, as well as to both methods for band pair agreement. Counts of vertebral band pairs were adjusted for the date of capture assuming a theoretical birthday of 1 March based on the beginning of the estimated period of parturition as described by Mollet et al. (2000). To assess model adequacy to the data, the Akaike Information Criterion (AIC) and the Bayesian Information Criterion (BIC) values were calculated for each model.
A likelihood ratio test was used to test the null hypotheses that there was no difference in growth parameters between males and females, using the ‘fishmethods’ package (Nelson, 2013). Plots were designed using library “ggplot2” (Wickham 2009).
3. Results
3.1 Sample characteristics
A total of 721 sampled sharks (384 males, 332 females, five specimens with undetermined sex) were collected for this study from both the North (n=379) and South Atlantic (n=342) hemispheres (Figure 1). Females in the North ranged in size between 57 and 366 cm FL (mean ± SD: 175.7 ± 53.0 cm), while males ranged in size between 52 and 279 cm FL (mean ± SD: 167.3 ± 43.6 cm). In the South, females ranged in size between 92 and 330 cm FL (mean ± SD: 176.3 ± 39.6 cm), while males ranged in size between 81 and 250 cm FL (mean ± SD: 164.4 ± 35.4 cm) (Figure 3).
3.2 Age estimation and comparison of age readings
Intra-specific percentage agreement between the two readings of each reader was 58%, 54% and 58% for Reader 1, Reader 2 and Reader 3, respectively. Reader 1 had a CV and APE of 4.9% and 3.5%, respectively. Reader 2 had a CV and APE of 6.3% and 4.4%, respectively. Reader 3 had a CV and APE of 5.2% and 3.7%, respectively. No systematic bias was observed between the readings when comparing graphically the two readings of each reader using the age-bias plots (Figure 4).
Inter-specific percentage agreement between the first and second, first and third, and second and third readers was 21%, 43% and 28%. The CV between the three readers was 17.3% and the APE was 12.9%. Between the first and second, first and third, and second and third readers CV was 19.0%, 10.1%, 13.6%, respectively. When comparing graphically the three readers using the age-bias plots Reader 2 is slightly over-estimating ages in the middle of the age range in relation to Reader 1 and 3 (Figure 5). A total of 62% of the vertebrae had at least two equal readings between all three readers, corresponding to the M1 method. The agreed band count pair increased when including individuals for which band pair counts were within 1 band pair difference, with 93% of the individuals being assigned a band pair count (M2 method).
3.3 Growth modelling
Estimated ages of the analysed specimens ranged from 0 to 27 years for females and 0 to 26 years for males. The LRT revealed significant differences between males and females (LRT: χ2 = 21.1, df = 3, P < 0.001); therefore, growth models were calculated for each sex separately.
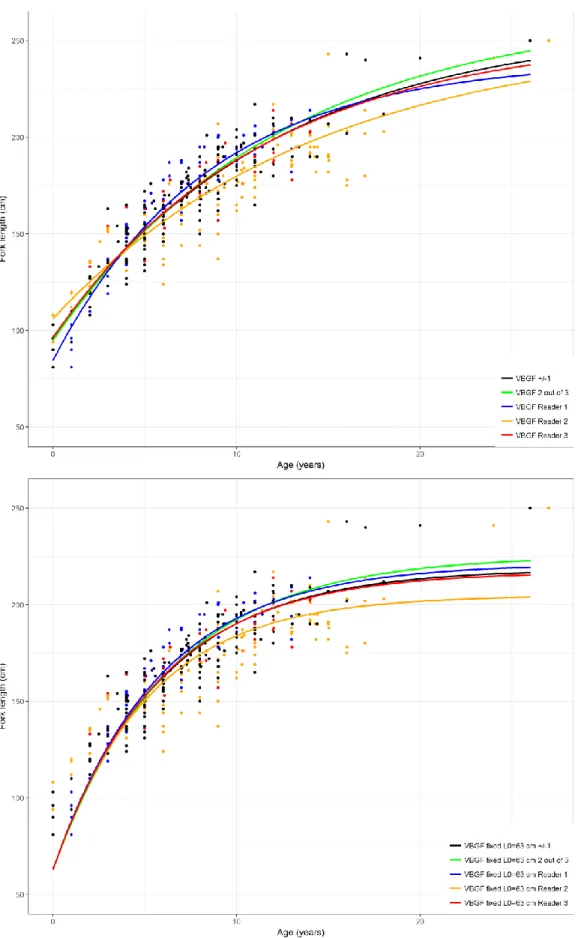
Females exhibited lower growth coefficients (k) and higher asymptotic size (Linf) than males. For the 3-parameter VBGF, Linf 3-parameter estimates varied between 240 cm to 228 cm FL for males and 336 to 461 cm FL for females; k varied between 0.07 to 0.12 year−1 for males and 0.03 to 0.05 year−1 for females. L0 estimates
varied between 85 and 106 cm FL for males and between 99 to 112 cm FL for females (Table 1, Figure 6 and 7). For the 2-parameter VBGF, Linf estimates were lower than the estimates from the 3-parameter
model, with estimates varying between 205 to 226 and 225 to 276 cm FL for males and females, respectively. Inversely, k estimates were higher, varying between 0.16 and 0.17 year−1 and 0.10 to 0.16 year−1 for males and females, respectively. The models with fixed L0 presented higher AIC and BIC than the models with 3-parameters (Table 1).
4. Discussion
A representative sample of shortfin makos caught in the pelagic longline fishery was used in this study, considering both the wide sampling region and the sample length range that seems to cover the size range of the species. The smallest individual in the South sample is 81cm FL. The maximum sizes for both males and females is also similar to the reported in other studies (Natanson et al., 2006; Barreto et al., 2016), the largest male was 250 cm FL and the largest female was 330 cm FL. However, despite the wide sample length range length classes on the edges of the length range were poorly represented, with only a few individuals bellow 100 cm FL and a few larger than 210 cm for both males and females. The lack of large individuals, especially females, has been noted before and several hypotheses have been put forward. Rare occurrences of large individuals might be from preferences for deeper and/or further offshore waters, gear selectivity, low survival rate to maturity or the result of overfishing or any combinations between them (Ribot-Carballal et al., 2005, Doño et al., 2015).
The fact that age precision is highly influenced by species and the nature of the structure being read makes it difficult to establish target levels of precision indexes such as the CV or APE. Campana (2001) mentioned that most studies reporting shark ages based on vertebrae did so with CV values exceeding 10%. For the shortfin mako, CVs between 4 and 11% and APEs between 3% and 14% have been previously reported (Bishop et al., 2006; Natanson et al., 2006; Ribot-Carballal et al., 2005; Semba et al., 2009; Doño et al., 2015; Barreto et al., 2016). Intra-reader reported values for this study fall on the lower range of the reported values for shortfin mako, while inter-reader values fall on the higher range.
Bomb radiocarbon and mark-recapture of chemically tagged individuals (OTC) are among the most robust validation methods for band pair deposition periodicity (Campana, 2001). In the Atlantic, Campana et al. (2002) and Ardizzone et al. (2006) using bomb radiocarbon and Natanson et al. (2006) using OTC marking validated an annual band pair deposition rate, as well as Kinney et al. (2016) for adult individuals using OTC in the Pacific Ocean. Additionally, several studies validated the deposition of one band per year using edge analysis (Ribot-Carballal et al., 2005; Semba et al., 2009; Cerna & Licandeo 2009). By the contrary, Wells et al. (2013) found that individuals smaller than 200 cm deposited two band per year using OTC marking. In the present study an annual band pair deposition rate was assumed. However, we considered that in the smaller individuals there were “shadow” bands that do not reflect a year of growth, but were false growth marks that cannot be seen in larger (older) individuals as probably they coalesce with the yearly growth marks. It is possible that these shadow bands might explain the double-banding pattern that was observed in some studies such as Wells et al. (2013). Maximum observed ages (26 and 27 for males and females, respectively) are in accordance with the reported maximums reported worldwide (Natanson et al., 2006). It is also in close agreement with the bomb radiocarbon analysis by Ardizzone et al. (2006) and with other studies using vertebral band counts (e.g. Cerna & Licandeo, 2009; Doño et al., 2015). Despite longevity estimates being close for males and females, sexual dimorphism is observed as females attain a larger size than males. For the South Atlantic, our largest female was 330 cm FL, while the largest male was 250 cm FL, therefore growth model estimates are sex-specific and the estimated growth parameters are significantly different.
In spite of Linf, the estimate of the expected mean maximum asymptotic length (at theoretical infinite age) and Lmax, the maximum observed size, not being equivalent, a comparison of estimated growth parameters with known size information can be useful as a method of verification (Bishop et al, 2004; Cerna & Licandeo, 2009). Fitting a 3-parameter von Bertalanffy growth models to female vertebral length-at-age data proved unsuccessful, with the Linf estimates much higher than the maximum observed sizes of females and the L0 overestimated. Additionally, the very wide standard errors of the parameters also indicated likely model convergence problems to reach adequate solutions. For males, the 3-parameter model fitted the data well, even thought L0 was also overestimated.
Several studies have reported that female data does not appear to reach an asymptote as male data does (Bishop
et al., 2004; Natanson et al., 2006; Doño et al., 2015). The likely reason for this is the lack of large individuals in
the sample, a limitation that makes it difficult to determine female asymptotic size as females tend to reach much larger sizes (Doño et al., 2015). Regarding the overestimation of L0, it might be due to the rapid initial growth that is observed in the first few years of shortfin makos this might be particularly important in this case as smallest length classes are poorly represented. Natanson et al. (2006) reported growth values of 40 cm/year in the first year from modal analysis; however it was also noted that growth rates estimated from vertebral analysis are much slower. Bishop et al. (2004) related the poor fit of the von Bertalanffy model to the younger classes with sampling bias towards larger sharks from the younger classes and/or to ageing error that might have resulted in underestimation of some ages.
When fitting a 2-parameter VBGF the model fit Linf estimates are much lower than the maximum observed length in this study, for either males or females, showing biased estimates of this parameter that also influence
the estimates of the k paramaters which are much higher than found in the North Atlantic (Rosa et al., 2017). In
comparison with the other studies (Table 2), our estimates of Linf from M2 method are much lower than what has been reported for this species in the different oceans, and k estimates are higher.
Given the poorly estimated growth parameters and the high coefficient of variation and low percentage agreement between readers, we cannot, to this point, recommend the use of the South Atlantic growth curves for stock assessment purposes. Future steps for the improvement of these curves could focus on the collection of samples from the extremes of the length range. A better definition of the stock structure could also benefit the growth estimation, as for now, the 5ºNorth separation between stocks was used. Additionally, if the sex-specific ICCAT SMA conventional tagging database becomes publicly available an integrated model using tagging and direct ageing (Aires-da-Silva et al., 2015; Francis et al., 2016) could be attempted to model growth for the shortfin mako in the Atlantic.
5. Acknowledgments
This study was carried out as part of a cooperative work conducted by the ICCAT Shark species group integrated in the ICCAT Shark Research and Data Collection Program (SRDCP). The authors are grateful to all fishery observers and longline skippers from the Nations involved in this study. Sampling from the U.S. fishery was conducted by fishery observers integrated in the U.S. Pelagic Observer Program. Sampling and data collection from the U.S. was also conducted by biologists and fishermen on research cruises, commercial and recreational fishing vessels, and at sport fishing tournaments. Sampling and data collection from the Portuguese fishery were mainly obtained and funded by the Programa National de Amostragem Biologica (PNAB) within the scope of the EU Data Collection Framework (DCF). Additional vertebrae samples were obtained with several national projects, specifically: Project "LL-Sharks: Mitigação das capturas de tubarões na pescaria de palangre de
superfície (Ref: 31-03-05-FEP-44, funded by PROMAR)" and Project MAKO-WIDE - "A wide scale inter-hemispheric and inter-disciplinary study aiming the conservation of the shortfin mako shark in the Atlantic Ocean (Ref: FAPESP/19740/2014)", funded by FCT (Portuguese Foundation for Science and Technology) and
FAPESP (São Paulo Research Foundation, Brazil). R. Coelho is supported by an Investigador-FCT contract from the Portuguese Foundation for Science and Technology (FCT) supported by the EU European Social Fund and the Programa Operacional Potencial Humano (Ref: IF/00253/2014).
References
Anon. 2016. Workshop on shortfin mako age reading and growth. ICCAT SRDCP – Shark Research and Data Collection Program. 8p.
Ardizzone, D., Cailliet, G.M., Natanson, L.J., Andrews, A.H., Kerr, L.A., Brown, T.A. 2006. Application of bomb radiocarbon chronologies to shortfin mako (Isurus oxyrinchus) age validation. Environmental
Biology of Fishes, 77: 355–366.
Barreto, R.R., de Farias, W.K.T., Andrade, H., Santana, F.M., Lessa, R. 2016. Age, Growth and Spatial Distribution of the Life Stages of the Shortfin Mako, Isurus oxyrinchus (Rafinesque, 1810) Caught in the Western and Central Atlantic. PLoS ONE 11(4):e0153062. doi:10.1371/journal.pone.0153062.
Bishop, S.D.H., Francis, M. P., Duffy, C., Montgomery, J.C., 2006. Age, growth, maturity, longevity and natural mortality of the shortfin mako shark (Isurus oxyrinchus) in New Zealand waters. Marine and Freshwater
Research, 57: 143–54.
Cailliet, G.M., Martin, L.K., Harvey, J.T., Kusher, D., Welden, B.A. 1983. Preliminary studies on the age and growth of blue (Prionace glauca), common thresher (Alopias vulpinus), and shortfin mako (Isurus
oxyrinchus) sharks from California waters. In: Prince, E.D., Pulos, M. (eds) Proceedings of the
international workshop on age determination of oceanic pelagic fishes: tunas, billfishes and sharks.
NOAATechnical Report NMFS, 8:179–188.
Cailliet G.M., Smith W.D., Mollet H.F., Goldman K.J. 2006. Age and growth studies of chondrichthyan fishes: the need for consistency in terminology, verification, validation, and growth function fitting. Environmental
Biology of Fishes, 77: 211–228.
Campana, S.E. 2001. Accuracy, precision and quality control in age determination, including a review of the use and abuse of age validation methods. Journal of Fish Biology 59: 197-242.
Campana, S.E., Natanson, L.J., Myklevoll, S. 2002. Bomb dating and age determination of large pelagic sharks.
Canadian Journal of Fisheries and Aquatic Sciences, 59: 450-455.
Cerna F, Licandeo R. (2009). Age and growth of the shortfin mako (Isurus oxyrinchus) in the south-eastern Pacific off Chile. Marine Freshwater Research, 60: 394–403.
Compagno, L.J.V. 2001. Sharks of the world. An annotated and illustrated catalogue of shark species known to date. Volume 2. Bullhead, mackerel and carpet sharks (Heterodontiformes, Lamniformes and Orectolobiformes). FAO Species Catalogue for Fishery Purposes. No. 1, Vol. 2. FAO, Rome, 269pp
Cortés, E., Domingo, A., Miller, P., Forselledo, R., Mas, F., Arocha, F., Campana, S., Coelho, R., Da Silva, C., Holtzhausen, H., Keene, K., Lucena, F., Ramirez, K., Santos, M.N., Semba-Murakami, Y., Yokawa, K. 2015. Expanded ecological risk assessment of pelagic sharks caught in Atlantic pelagic longline fisheries.
Collective Volume of Scientific Papers ICCAT, 71: 2637-2688.
Doño, F., Montealegre-Quijano, S., Domingo, A., Kinas, P.G. 2015. Bayesian age and growth analysis of the shortfin mako shark Isurus Oxyrinchus in the western south Atlantic Ocean using a flexible model.
Environmental Biology of Fishes, 98: 517–33.
Groeneveld, J.C., Cliff, G., S.F.J. Dudley, S.F.J, Foulis, A.J., Santos, J., Wintner, S.P. 2014. Population structure and biology of shortfin mako, Isurus oxyrinchus, in the south-west Indian Ocean. Marine and Freshwater
Research, 65:1045–1058.
Kinney, M.J., Wells, R.J.D., Kohin, S. 2016. Oxytetracycline age validation of an adult shortfin mako shark
Isurus oxyrinchus after 6 years at liberty. Journal of Fish Biology, 89: 1828–1833.
Mas, F., Forselledo, R., Domingo, A. 2014. Length-length relationships for six pelagic shark species commonly caught in the southwestern Atlantic Ocean. Collective Volume of Scientific Papers ICCAT, 70:2441–50.
Mejuto J, García-Cortés B, Ramos-Cartelle A, de la Serna JM. 2008. Scientific estimations of bycatch landed by the Spanish surface longline fleet targeting swordfish (Xiphias gladius) in the Atlantic Ocean with special reference to the years of 2005 and 2006. ICCAT Standing Committee on Research and Statistics Document. SCRS/2008/045. 14 pages.
Mollet, H.F., Cliff, G., Pratt, H.L., Stevens, J.D. 2000. Reproductive biology of the female shortfin mako, Isurus
oxyrinchus (Rafinesque, 1810), with comments on the embryonic development of lamnoids. Fishery Bulletin, 98: 299–318.
Natanson, L.J., Kohler, N.E., Ardizzone, D., Cailliet, G.M., Wintner, S.P., Mollet, H.F. 2006. Validated age and growth estimates for the shortfin mako, Isurus oxyrinchus, in the North Atlantic Ocean. Environmental
Biology of Fishes, 77: 367–83.
Nelson, G. A. 2014. fishmethods: Fishery Science Methods and Models in R. R package version 1.7-0. http://CRAN.Rproject.org/package =fishmethods.
Ogle, D.H. 2015. FSA: Fisheries Stock Assessment Methods. R package version 0.6.13.
https://www.rforge.net/FSA/Installation.html.
Pratt, H.L. Jr., Casey, J.G. 1983. Age and growth of the shortfin mako, Isurus oxyrinchus, using four methods. Canadian Journal of Fisheries and Aquatic Sciences, 40:1944–1957
R Core Team 2018. R: A language and environment for statistical computing. R Foundation for Statistical Computing, Vienna, Austria. URL http://www.R-project.org/.
Rosa, D., Mas, F., Alyssa, M., Natanson, L.J., Domingo, A., Carlson, J., Coelho, R. (2017). Age and growth of shortfin mako in the North Atlantic, with revised parameters for consideration to use in the stock assessment. SCRS/2017/111:22 pp.
Ribot-Carballal, M.C., Galván-Magaña, F., Quiñónez-Velázquez, C. 2005. Age and growth of the shortfin mako shark, Isurus oxyrinchus (Rafinesque, 1810), from the western coast of Baja California Sur, México.
Fisheries Research, 76: 14–21.
Ricker, W.E. 1975. Computation and interpretation of biological statistics of fish populations. Bulletin of the Fisheries Research Board of Canada, 191:1–382
Semba, Y., Nakano, H., Aoki, I. 2009. Age and growth analysis of the shortfin mako, Isurus oxyrinchus, in the western and central North Pacific Ocean. Environmental Biology of Fishes, 84: 377–391.
Wells, R.J.D., Smith, S.E., Kohin, S., Freund, E., Spear, N., Ramon, D.A. 2013. Age validation of juvenile shortfin mako (Isurus oxyrinchus) tagged and marked with oxytetracycline off southern California. Fishery
Bulletin, 111: 147–60.
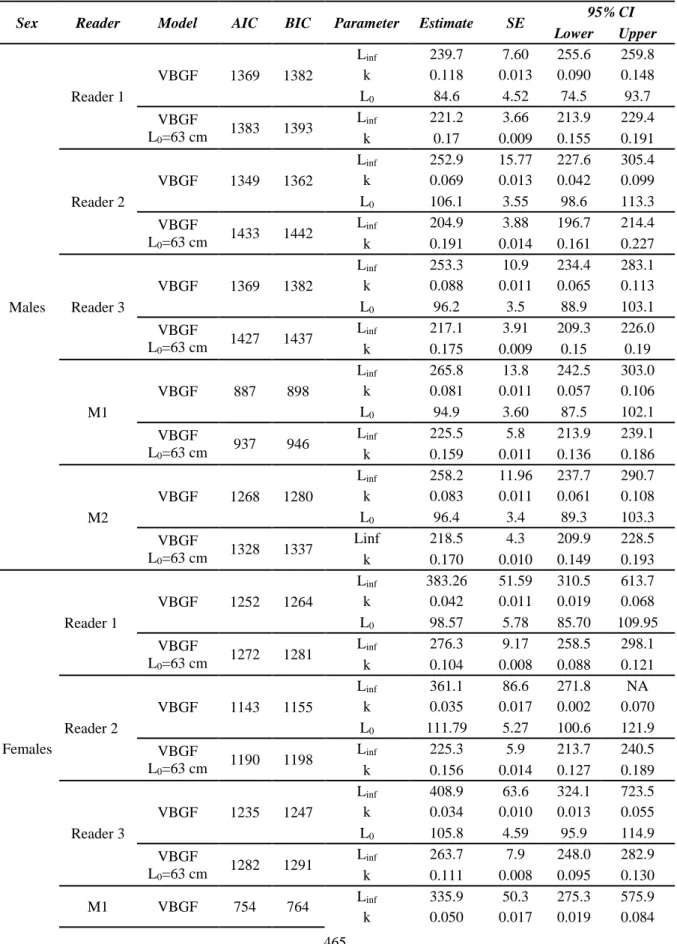
Table 1. Growth parameters for Isurus oxyrinchus (separate sexes) from the South Atlantic stock. The presented models are the 2 and 3 parameters von Bertalanffy growth function (VBGF) re-parameterised to estimate or include L0. Parameters are presented with the respective standard errors (SE) and 95% confidence intervals (CI).
Linf = asymptotic maximum length (fork length, cm), k = growth coefficient (year−1), L0 = size at birth (fork
length, cm). M1 and M2 refers to the methods for the criteria used for the inclusion of estimated ages (see methods section for a detailed description of the methods).
Sex Reader Model AIC BIC Parameter Estimate SE 95% CI Lower Upper Males Reader 1 VBGF 1369 1382 Linf 239.7 7.60 255.6 259.8 k 0.118 0.013 0.090 0.148 L0 84.6 4.52 74.5 93.7 VBGF L0=63 cm 1383 1393 Linf 221.2 3.66 213.9 229.4 k 0.17 0.009 0.155 0.191 Reader 2 VBGF 1349 1362 Linf 252.9 15.77 227.6 305.4 k 0.069 0.013 0.042 0.099 L0 106.1 3.55 98.6 113.3 VBGF L0=63 cm 1433 1442 Linf 204.9 3.88 196.7 214.4 k 0.191 0.014 0.161 0.227 Reader 3 VBGF 1369 1382 Linf 253.3 10.9 234.4 283.1 k 0.088 0.011 0.065 0.113 L0 96.2 3.5 88.9 103.1 VBGF L0=63 cm 1427 1437 Linf 217.1 3.91 209.3 226.0 k 0.175 0.009 0.15 0.19 M1 VBGF 887 898 Linf 265.8 13.8 242.5 303.0 k 0.081 0.011 0.057 0.106 L0 94.9 3.60 87.5 102.1 VBGF L0=63 cm 937 946 Linf 225.5 5.8 213.9 239.1 k 0.159 0.011 0.136 0.186 M2 VBGF 1268 1280 Linf 258.2 11.96 237.7 290.7 k 0.083 0.011 0.061 0.108 L0 96.4 3.4 89.3 103.3 VBGF L0=63 cm 1328 1337 Linf 218.5 4.3 209.9 228.5 k 0.170 0.010 0.149 0.193 Females Reader 1 VBGF 1252 1264 Linf 383.26 51.59 310.5 613.7 k 0.042 0.011 0.019 0.068 L0 98.57 5.78 85.70 109.95 VBGF L0=63 cm 1272 1281 Linf 276.3 9.17 258.5 298.1 k 0.104 0.008 0.088 0.121 Reader 2 VBGF 1143 1155 Linf 361.1 86.6 271.8 NA k 0.035 0.017 0.002 0.070 L0 111.79 5.27 100.6 121.9 VBGF L0=63 cm 1190 1198 Linf 225.3 5.9 213.7 240.5 k 0.156 0.014 0.127 0.189 Reader 3 VBGF 1235 1247 Linf 408.9 63.6 324.1 723.5 k 0.034 0.010 0.013 0.055 L0 105.8 4.59 95.9 114.9 VBGF L0=63 cm 1282 1291 Linf 263.7 7.9 248.0 282.9 k 0.111 0.008 0.095 0.130 M1 VBGF 754 764 Linf 335.9 50.3 275.3 575.9 k 0.050 0.017 0.019 0.084
L0 101.3 6.59 87.8 113.5 VBGF L0=63 cm 776 784 Linf 259.9 9.7 234.8 276.3 k 0.126 0.012 0.102 0.154 M2 VBGF 1172 1184 Linf 460.9 105.5 337.8 1456.1 k 0.028 0.011 0.006 0.051 L0 106.6 4.8 96.3 116.1 VBGF L0=63 cm 1215 1224 Linf 263.1 9.1 245.3 285.7 k 0.112 0.009 0.093 0.134
Table 2. Comparison of growth parameters for Isurus oxyrinchus from previosuly published studies. TL = total length (cm), PCL= Pre-caudal length (cm), FL = Fork length (cm), OTBFL = over the body fork length (cm), VBGF = von Bertallanfy growth model, GOM = Gompertz growth function, Linf = asymptotic maximum length (cm fork length), k = growth coefficient (year−1), L0 = size at birth (cm fork length), t0 = theoretical age at which the expected length is zero.
Ocean Area Periodicity Measurement Growth
model Parameters
Sex
Reference Male Female Combined
Atlantic
South Atlantic Annual
(excluding shadow bands small specimens) FL 2 parameter VBGF (fixed L0) Linf 218.5 263.1 Rosa et al. (2018) The present study
K 0.170 0.112 L0 63 63 North Atlantic Linf 241.8 350.3 Rosa et al. (2017) K 0.136 0.064 L0 63 63 Atlantic
Western North Atlantic Biannual FL VBGF
Linf 302 345
Pratt & Casey, 1983
K 0.266 0.203
t0 -1 -1
Western North Atlantic Annual OTBFL
VBGF (males) GOM (females) Linf 253 366 Natanson et al., 2006 K 0.125 0.087 L0 72 88
Western South Atlantic Annual FL VBGF*
Linf 580 416
Doño et al., 2015
K 0.021 0.035
t0 -7.52 -6.18
Western and Central Atlantic
Annual FL VBGF Linf 328.74 407.66 Barreto et al., 2016 K 0.08 0.04 t0 -4.47 -7 Biannual Linf 340.2 441.64 K 0.14 0.07 t0 -2.75 -3.98 Biannual/ Annual** Linf 291.57 309.79 K 0.2 0.13 t0 -2.38 -3.27 Pacific California Annual TL VBGF Linf 321.0 Cailliet et al., 1983 K 0.072 t0 -3.75
New Zealand Annual FL VBGF*
Linf 302.16 820.1
Bishop et al., 2006 K 0.0524 0.013
t0 -9.04 -11.3
Sur, Mexico K 0.05
t0 -4.7
Western and Central North
Pacific Ocean Annual PCL VBGF
Linf 231.0 308.3
Semba et al., 2009
K 0.16 0.09
L0 60 60
South-Eastern Pacific off Chile Annual FL VBGF
Linf 296.60 325.29
Cerna & Licandeo, 2009
K 0.087 0.076
t0 -3.58 -3.18
Indian South-west Indian Ocean Annual FL VBGF
Linf 285
Groeneveld et al., 2014
K 0.113
L0 90
Note: *A Schnute model was considered to best fit the data; VBGF is presented for comparison purposes.
Figure 1. Map with the location of the shortfin mako shark (SMA) vertebrae collected and currently available for the age and growth study.
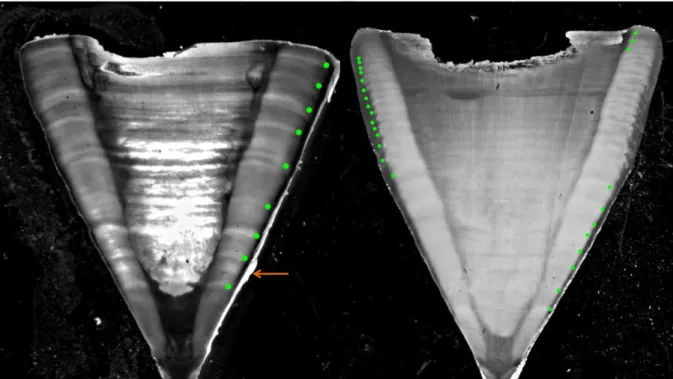
Figure 2. Example of edited microphotographs of vertebral sections of shortfin mako (Isurus oxyrinchus). On the left a male specimen with 205 cm fork length (FL) with an agreed band count of 8 years. On the right a male specimen with 235 cm FL with an agreed band count of 25 years. The first green point represents the birth mark.The orange arrow signals a “shadow band”.
Figure 3. Size (fork length, FL in cm) frequency distribution of male (n = 334) and female (n = 332) shortfin mako (SMA) samples collected and currently available for the age and growth study, for the north and south Atlantic stocks (separated at the 5ºN).
Figure 5. Age–bias plots of pairwise age comparisons between readers based on examination of Isusus
oxyrinchus vertebrae. Numbers represent number of samples. and dots with error bars represent the mean counts
of reading (± 95% confidence intervals) relative to the accepted age. The diagonal line indicates a one-to-one relationship.
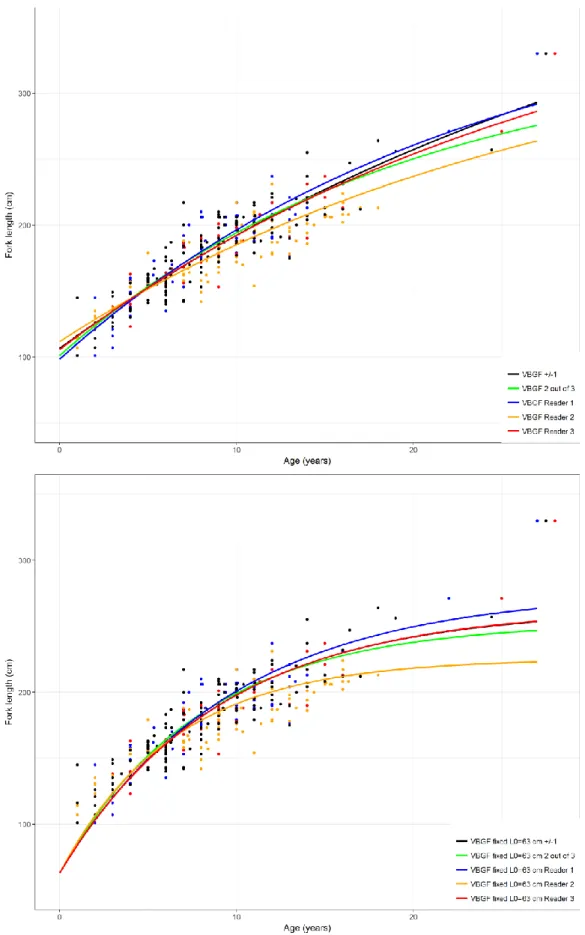
Figure 7. The von Bertalanffy growth function (VBGF) for female Isurus oxyrinchus based on age estimations
by vertebrae growth marks. Circles represent observed data and line represents in the upper panel the 3-parameter VBGF and in the lower panel the VBGF with fixed L0= 63 cm FL.