www.earth-syst-dynam.net/7/549/2016/ doi:10.5194/esd-7-549-2016
© Author(s) 2016. CC Attribution 3.0 License.
A Lagrangian analysis of the present-day sources of
moisture for major ice-core sites
Anita Drumond1, Erica Taboada2, Raquel Nieto1,3, Luis Gimeno1, Sergio M. Vicente-Serrano4, and Juan Ignacio López-Moreno4
1EPhysLab, Facultade de Ciencias, Universidade de Vigo, Ourense, 32004, Spain 2Facultad de Ciencias, Universidad de La Laguna, La Laguna, 38200, Spain
3Department of Atmospheric Sciences, Institute of Astronomy, Geophysics and Atmospheric Sciences, University of São Paulo, São Paulo, 05508-090, Brazil
4Instituto Pirenaico de Ecología, Consejo Superior de Investigaciones Científicas (IPE-CSIC), Zaragoza, 38200, Spain
Correspondence to:Anita Drumond ([email protected])
Received: 23 December 2015 – Published in Earth Syst. Dynam. Discuss.: 25 January 2016 Revised: 15 April 2016 – Accepted: 23 May 2016 – Published: 8 July 2016
Abstract. A Lagrangian approach was used to identify the moisture sources for 14 ice-core sites located world-wide for the period of 1980–2012. The sites were classified into three domains: Arctic, Central (Andes, Alps, and Kilimanjaro), and Antarctic. The approach was used to compute budgets of evaporation minus precipitation by calculating changes in the specific humidity along 10-day backward trajectories. The results indicate that the oceanic regions around the subtropical high-pressure centres provide most of moisture, and their contribution varies throughout the year following the annual cycles of the centres. For the Arctic Domain, the sources lie in the subtropical North Atlantic and Pacific. The subtropical South Atlantic, Indian, and Pacific oceans provide moisture for the Antarctic Domain. The sources for South America are the Atlantic and South Pacific, for Europe the sources are in the Mediterranean and the North Atlantic, and for Asia the sources are the Indian Ocean and the Arabian Sea.
1 Introduction
The most successful reconstruction of past climate has been due to the fact that stable water isotopes are conserved in ice cores (e.g. Jouzel et al., 1982; Dansgaard et al., 1993). The isotopic composition of precipitation, in deuterium, oxygen-18, and oxygen-17, depends on the climatic conditions pre-vailing in the oceanic regions where it originates (i.e. the sources), mainly the sea surface temperature and the relative humidity of air (Jouzel et al., 2013). The deuterium excess may be seen as a control parameter of air moisture trajec-tory histrajec-tory because it will change when the trajectrajec-tory moves over regions, presenting different moisture conditions (e.g. sea/land, dry/wet land). Deuterium excess variations have been traditionally associated with changes in the temperature of the oceanic sources, but nowadays it is thought to be also related to changes in the relative humidity of the air in the
source region (Pfahl and Sodemann, 2014). In any case, deu-terium excess variations in ice cores may reflect past changes in the climate conditions of the oceanic sources (e.g. Masson-Delmotte et al., 2005; Steffensen et al., 2008). This infor-mation can be very useful to understand changes linked to modifications in the atmospheric circulation because the po-sition and conditions of the moisture sources for precipitation could be altered (e.g. Masson-Delmotte et al., 2005). That is why the knowledge on the transport of moisture is crucial for the interpretation of stable isotopes in precipitation and in palaeo-archives through the understanding of the physical climatic processes involved (Sodemann and Zubler, 2009).
550 A. Drumond et al.: Moisture Sources for major ice-core sites
According to Sodemann et al. (2008), changes in the mass balance of these regions can affect the salinity of the sur-rounding oceans. Outside the polar latitudes, ice cores must be extracted from glaciers located at high topographic eleva-tions. In general these regions are the headwaters of rivers, and the winter precipitation stored in these glaciers is re-leased during the year, contributing to river runoff and water resources (Sodemann and Zubler, 2009).
The investigation of sources of moisture may be conducted using different techniques such as via the assessment of the atmospheric water balance (Peixoto and Oort, 1992), gen-eral circulation models (Delmotte et al., 2000), or trajectories (e.g. Stohl and James, 2004). Gimeno et al. (2012) summa-rize and compare the general techniques to identify moisture sources. During recent years, the use of Lagrangian trajec-tories methods has become popular for diagnosing the trans-port of moisture and for determining the origin of moisture that precipitates in particular regions because these meth-ods allow a detailed budget of moisture along the trajecto-ries (Gimeno et al., 2012). Sodemann and Stohl (2009) and Nieto et al. (2010) applied Lagrangian diagnostic schemes to identify the major sources of moisture for the principal Antarctic ice-core sites by backtracking the air masses that ultimately reached these regions over a 5-year period (2000– 2004). Other studies have created longer back-trajectory data sets for specific ice-core sites using different Lagrangian ap-proaches. For example, Scarchilli et al. (2011) investigated the precipitation events over the East Antarctic Ice Sheet using the HYSPLIT Lagrangian model integrated with the ERA40 data from 1980 to 2001. Markle et al. (2012) also used HYSPLIT, but integrated with NCEP/NCAR data from 1979 to 2010, to investigate the synoptic variability in the Ross Sea region, Antarctica. In this study we apply the so-phisticated Lagrangian diagnostic scheme previously used by Nieto et al. (2010) over short periods to present an annual and seasonal climatology of the moisture sources for 14 of the major ice-core sites investigated worldwide for the present-day climate (1980–2012).
2 Data and method
Our Lagrangian approach follows the method developed by Stohl and James (2004, 2005) that accounts for the loss and gain of moisture along air masses trajectories. For this study we use the FLEXPART V9.0 particle dispersion model fed with ERA-Interim Reanalysis data (Dee et al., 2011), the state-of-the-art reanalysis in terms of hydrological cycle. Ac-cording to the analyses of Trenberth et al. (2011) and Lorenz and Kunstmann (2012), the performance of ERA-Interim in reproducing the hydrological cycle and the water balance closure is better than ERA-40 and the newest reanalysis products Modern Era Retrospective-Analysis for Research and Applications and Climate Forecast System Reanalysis (MERRA) (Rienecker et al., 2011).
In the Lagrangian frame of reference the observer fol-lows an individual fluid parcel as it moves through space and time. In the model the atmosphere is divided homogeneously into three-dimensional finite elements (hereafter “particles”), each representing a fraction of the total atmospheric mass (Stohl and James, 2004). These particles may be advected backward or forward in time using three-dimensional wind taken from the meteorological data (e.g. reanalysis project) every time step, with superimposed stochastic turbulent and convective motions. The rates of increase (e) and decrease (p) of moisture (e−p) along the trajectory of each particle were calculated via changes in the specific moisture (q) with time (e−p=mdq/dt), withmbeing the mass of the particle. Similar to the wind field,qis also taken from the meteorolog-ical data. By summing (e−p) for all the particles residing in the atmospheric column over a given area A, we obtained the surface freshwater flux (E−P), where (E) denotes the evap-oration rate and (P) denotes the precipitation rate per unit area. If we considered all the particles present in the atmo-spheric column, the results would be similar to the freshwa-ter flux calculated via the Eulerian frame of reference (Stohl and James, 2004). Nevertheless, the Lagrangian methodol-ogy allows us to identify the particles affecting a particular region and to calculate the surface freshwater flux (E−P) using information on the trajectories of these selected parti-cles. In this way, a comparison between the (E−P) fields generated by the Eulerian and the Lagrangian (considering only the particles affecting a particular region) approaches may indicate how similar is the moisture budget associated with the tracked particles to the freshwater flux observed at surface. A detailed description of this methodology is pre-sented by Stohl and James (2004).
The FLEXPART data set used in this study was provided by a global experiment in which the entire global atmosphere was divided into approximately 2.0 million “particles”. The tracks were computed using ERA-Interim reanalysis data at 6 h intervals, at a 1◦horizontal resolution and at a vertical
res-olution of 60 levels from 0.1 to 1000 hPa. The analysis cov-ered the period from January 1980 to December 2012, and the number of particles in the globe per time step was kept constant. As stressed by Gimeno et al. (2013), the FLEX-PART model requires consistent high-quality data for wind and humidity, precluding its application to older reanalysis data (pre-1979), i.e. prior to the significant decrease in the errors in these variables following the inclusion of satellite data (Bengtsson et al., 2004).
The 14 ice-core sites (hereafter target regions) investigated in the present study (Fig. 1 and Table 1) may be classified into three domains: the Arctic Domain (90–60◦N), which
in-cludes Greenland (GISP2, NGRIP and NEEM), Alaska (Lo-gan, Bona–Churchill), and the Franz Josef Land archipelago (Windy Dome); the Central Domain (60◦N–60◦S), which
Do-Figure 1.Topographic height (colour bar, in metres) and the location of the ice-core sites. The red crosses refer to sites in the Arctic Domain, the black stars in the Central Domain, and the blue triangles in the Antarctic Domain. The numbers are defined in Table 1.
Table 1.Characteristics of the ice-core sites analysed.
Domain No. Site Lat. Long. Height Max. Temporal Number∼ Reference
(m) depth coverage of particles (m) (year) identified per
time step
Arctic
1 GISP2 72.60◦N 38.50◦W 3200 ∼2790 ∼110 000 220 Meese et al. (1997)
2 NEEM 77.45◦N 51.07◦W 2479
∼2540 ∼108 000 185 Rasmussen et al. (2013)
3 NGRIP 75.10◦N 42.30◦W 2917
∼3084 ∼123 000 185 Andersen et al. (2004)
4 Monte Logan 60.58◦N 140.58◦W 5340
∼186 ∼8000 230 Fisher et al. (2004)
5 Bona–Churchill 61.40◦N 141.70◦W 4420
∼460 ∼2500 215 Mashiotta et al. (2004)
6 Windy Dome 80.78◦N 63.53◦E 580 ∼315 ∼10 000 780 Henderson (2002)
Central
7 Huascarán 9.18◦S 78.02◦W 6048
∼166 ∼20 000 75 Thompson et al. (1995)
8 Sajama 18.10◦S 68.97◦W 6542 ∼133 ∼20 000 66 Thompson et al. (1998) 9 Grenzgletscher 45.92◦N 7.87◦E 4200
∼125 ∼77–20 150 Eichler et al. (2000)
10 Everest 28.02◦N 86.97◦E 6518
∼117 ∼4000 70 Hou et al. (2013)
11 Kilimanjaro 3.13◦S 37.58◦E 5893
∼51 ∼11 700 80 Thompson et al. (2002)
Antarctic
12 Byrd 80◦S 119◦W 1530 ∼2164 ∼100 000 450 Thompson et al. (1975)
13 EPICA DML 75◦S 0◦E 2892
∼2774 ∼150 000 1215 Ruth et al. (2007)
14 Vostok 78◦S 106◦E 3488
∼3623 ∼440 000 790 Petit et al. (1999)
main (60–90◦S), including the Byrd, EPICA DML
(Dron-ning Maud Land), and Vostok sites. Amongst the whole set of records available, the choice of the ice cores was a first attempt to cover the geographical distribution of the major sites available worldwide and to illustrate how our method-ology can be useful for ice-core studies. Target regions were defined in the geographical locality (Table 1) of each ice-core site. Except for EPICA DML (whose area was defined by a rectangle), the target regions consisted of octagons with an equivalent radius of 100 km centred on each ice-core site.
Ta-552 A. Drumond et al.: Moisture Sources for major ice-core sites
ble 1. Stohl and James (2004) state that the estimate of the moisture budget is valid when the number of particles per grid column of the input meteorological data exceeds the number of the layers. With this methodology, the evaporative sources and sink regions for the particles reaching the target region can be identified. All areas where the particles gained (lost) humidity (E−P >0) (E−P <0) along their trajec-tories towards the target region can be considered “sources of moisture” (sinks). Only source regions were considered here. For each target region, a percentile criterion was ap-plied to the climatological annual positive (E−P) field to de-fine a threshold delimiting the spatial extent of the respective sources of moisture. The 95th percentile of the climatologi-cal annual positive (E−P) values obtained for each ice-core site delimits those regions where the air masses were likely to have picked up a large amount of moisture on their transit towards the target regions. In other words, the 95th percentile criteria would show the 5 % grid points with the highest posi-tive (E−P) values in the annual mean map obtained for each ice-core site. The same annual 95th percentile value was then applied to identify the spatial extent of the sources at seasonal scales.
The method is mostly limited by the use of a time deriva-tive of the humidity (numerical errors associated with the temporal variations in the moisture present in a particle can be taken as moisture fluxes) (Stohl and James, 2004). In con-sequence, if the meteorological data used to drive the method do not properly close the water budget, then the method may suffer from considerable inaccuracies (Gimeno et al., 2012). Other reasons for uncertainties in the calculated trajecto-ries are the limited resolution and uncertainties in the in-put reanalysis data, particularly the vertical wind component, and in the interpolation of the data (Schlosser et al., 2008; Scarchilli et al., 2011). Numerical truncation errors seem to be of minor importance (Stohl et al., 2001). Average errors of approximately 20 % of the travel distance may be considered typical (Stohl et al., 2001). However, especially in areas with low meteorological data coverage, as Antarctica, trajectory errors can be larger. On one hand, Scarchilli et al. (2011) suggest that spatial uncertainties in 5-day trajectories over Antarctic are 15–30 % of the total path distance, a high value probably due to the coarse grid of the meteorological model data used (2.5◦horizontal resolution and at a vertical
resolu-tion of 24 levels). On the other hand, Schlosser et al. (2008) suggest that mean errors of 20 % may be typical of 5-day back trajectories over Antarctic. In spite of the uncertain-ties described, such random errors may cancel each other out given the large number of trajectories considered, as well as of particles found in a 1◦horizontal resolution atmospheric
column (Stohl and James, 2004).
The methodology applied here follows the pioneers works of Stohl and James (2004, 2005), considering the regions of (E−P)>0 along the trajectories selected as moisture sources and tracking all the air masses reaching the target re-gion independently of the occurrence of precipitation events
there. Other moisture sources diagnostic schemes are avail-able (Gimeno et al., 2012), such as the Lagrangian method proposed by Sodemann et al. (2008) to identify the origin of precipitation. In their approach, the cumulative moisture changes along the trajectory are also considered besides the net gain or loss at each grid point, which is necessary for quantifying the contribution of the air parcel for the precip-itation in the target region. In any case, since the purpose of the present work is to estimate the climatological moisture sources of all air masses reaching the target regions, inde-pendently of the occurrence of precipitation in the ice-core sites, the use of this simple Lagrangian approach seems rea-sonable.
3 Results
Only the results for the annual and JJA and DJF periods are discussed here. The results for the transition seasons MAM and SON can be found in the Supplement. Figure 2 and Fig. S1 in the Supplement shows the vertically integrated moisture flux (VIMF) calculated directly from ERA-Interim. Figures 3 and S2 are based on (E−P) of the tracked par-ticles averaged over the 10-day trajectory period and redis-tributed on a regular 1◦grid, and they provide a summary of
the sources of moisture for the ice-core sites.
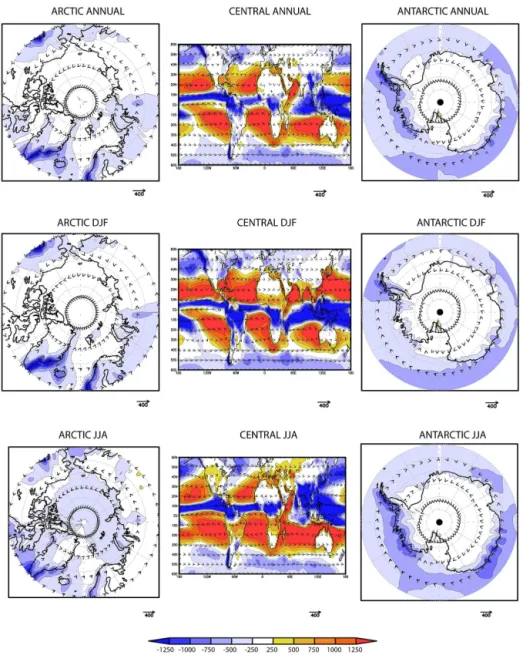
Figure 2 shows the VIMF and the respective divergence at an annual scale, as well as for the DJF and JJA seasons. The warm (cold) colours indicate regions of maximum di-vergence (condi-vergence) of the moisture flux, which may be considered to be the evaporative (precipitating) areas. The major evaporative sources around the globe coincide with the subtropical high-pressure centres observed in both hemi-spheres, which intensify during the respective winter seasons (DJF for the Northern Hemisphere and JJA for the South-ern Hemisphere). Other regions are characterized by a strong seasonality of the VIMF divergence, such as for the mon-soon domains in Asia, America, and Africa. Intense precip-itation characterizes these areas during their respective sum-mers, while divergent VIMF and evaporative conditions pre-vail during their respective winters.
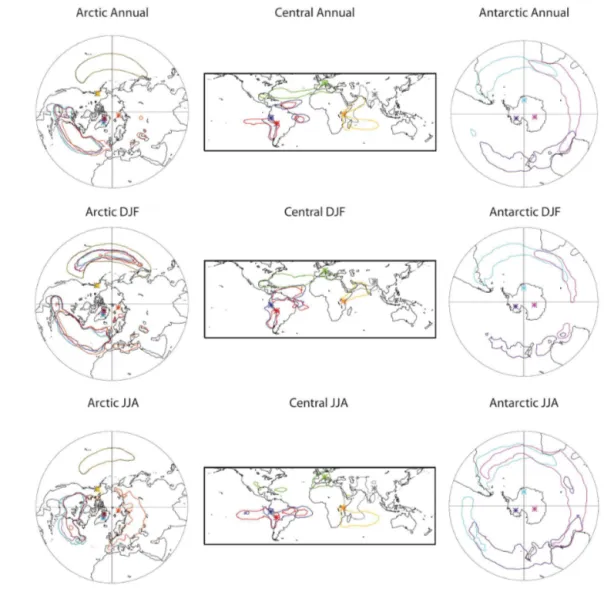
Figure 3 summarizes the major sources of moisture for all the ice-core sites analysed at the annual scale, and for DJF and JJA. For the Arctic Domain, most of the moisture comes from latitudes 30–40◦N, coinciding with the location
of the subtropical high-pressure centres, and the contribution from these sources increases during the boreal winter (DJF). The North Pacific Ocean is the major source for the sites in western North America, namely Logan (grey contour), and Bona–Churchill (yellow contour). The reader may see that the large-scale moisture transport patterns remain similar for the Logan and Bona–Churchill sites because they may be within the same or neighbouring grid points of the 1◦
Figure 2.Vertically integrated moisture flux (vector, kg m−1s−1) and its respective divergence (shaded, mm yr−1) in the Arctic (left-hand
column), the Central (central column), and the Antarctic (right-hand column) domains for the annual (top row), DJF (central row), and JJA (bottom row) temporal means for the period 1980–2012. Data: Era-Interim.
the North Pacific Ocean was previously reported by Moore et al. (2002). The North Atlantic Ocean provides moisture for the Windy Dome (orange) and for the three sites in Green-land: GISP2 (blue), NEEM (brown), and NGRIP (violet). We note that the results obtained for Greenland agree with the findings of Sodemann et al. (2008). During JJA (boreal sum-mer), probably associated with the predominance of dry con-ditions in the northern extratropical continental regions, and with the weakening of the boreal subtropical high-pressure centres and respective moisture transport, the North Ameri-can continent and the Atlantic Ocean appear to be the major sources of moisture for the Greenland sites, while the mois-ture for the Windy Dome mainly comes from Eurasia. Using water isotopologues as tracers, Kurita (2011) suggested that
the humidity source of Arctic air masses switches in early winter from locally driven to moisture transport from lower latitudes, consistently with our results.
554 A. Drumond et al.: Moisture Sources for major ice-core sites
Figure 3.Moisture sources for the ice-core sites located in the Arctic (left-hand column), Central (central column), and Antarctic (right-hand column) domains for the annual (top line), DJF (central line), and JJA (bottom line) temporal means. The contour lines represent the 95th percentile of the positiveE−P values in the annual mean for each ice-core Lagrangian analysis. The asterisks indicate the location of the ice-core sites investigated, represented by different colours. The colours for the Arctic Domain are Logan (grey), Bona–Churchill (yellow), Windy Dome (orange), GISP2 (blue), NEEM (brown), and NGRIP (violet); for the Central Domain they are Huascarán (dark blue), Sajama (red), Grenzgletscher (green), Kilimanjaro (yellow), and Everest (grey); for the Antarctic Domain they are Byrd (purple), DML (clear blue), and Vostok (pink).
the references therein, the tropical Atlantic is the major re-mote moisture source for the Amazon because of the trade winds transport. Our results agree with the previous isotope analysis discussed by Thompson et al. (2000), who show that the dominant moisture source for Huascarán and Sajama is the tropical Atlantic, and water vapour is advected from the east and northeast over the Amazon. In the Pacific the source expands along the coast in DJF, and it is displaced north-wards in JJA. These changes may be interpreted as a result of the migration of the SPSH northwards in JJA, which prob-ably reduces its influence over the areas of interest (Fig. 2). In the Atlantic ocean, the contribution from the Northern Hemisphere in DJF may be related to the intensification of the Azores high and the associated moisture transport by the
northerly trade winds (Fig. 2), an important mechanism of moisture transport for the South American Monsoon System (Drumond et al., 2014, 2008). During the inactive phase of the monsoon in JJA, the Azores high weakens and the South Atlantic Subtropical High (SASH) intensifies and migrates northwards, favouring moisture transport from the South At-lantic Ocean to the Andes ice-core sites.
characterized by dry conditions, and then the land surface becomes the major moisture source for the Alps. Our re-sults corroborate those of Sodemann and Zubler (2009), who identified the moisture sources for precipitation in the Alps using a different Lagrangian approach. They found that the Southern Alps, where the ice-core site is located, receive a large proportion of their precipitation from the Mediter-ranean, with considerable month-to-month variability; there is a clear change from an oceanic mode during winter to a European continental mode during summer. Agreeing with our results, Mariani et al. (2014) analysed water stable iso-tope ratios and net snow accumulation in the Fiescherhorn (Northern Alps) and the Grenzgletscher ice-core sites and also found that the two glaciers are influenced by different precipitation regimes, with the Grenzgletscher reflecting the characteristic precipitation regime south of the Alps and the Fiescherhorn, north of the Alps.
The Arabian Sea and the Indian Ocean are the major mois-ture sources for both Kilimanjaro in eastern Africa (Fig. 3, yellow) and Everest in southern Asia (Fig. 3, grey), in agree-ment with the major moisture sources previously identified for these regions (Gimeno et al., 2010, 2013). It is known that the characterization of the eastern African rainfall is primarily associated with the annual migration of the In-tertropical Convergence Zone (ITCZ) (Camberlin and Philip-pon, 2002). During the inactive phase of the Indian monsoon and the migration of the ITCZ towards the Southern Hemi-sphere in DJF, high-pressure and VIMF divergence condi-tions are observed around India (Fig. 2), and the Arabian Sea acts as the major moisture source for Kilimanjaro and Everest. However, the migration of the ITCZ into the North-ern Hemisphere, the intensification of the Indian subtropi-cal high, and the active phase of the Indian monsoon in JJA favour the transport of moisture from the Southern Indian Ocean northwards (Fig. 2). In consequence, the Indian Ocean becomes the main source for Kilimanjaro and also provides moisture for Everest. The importance of the Indian Ocean in providing moisture to snowfall events in the Kilimanjaro was previously pointed out by Chan et al. (2008) through a moisture flux analysis. Making use of proxy indicators of relative moisture balance for the past millennium paired with long control simulations from coupled climate models, Tierney et al. (2013) also suggest that the Indian Ocean is the primary influence on East African rainfall over multi-decadal and longer timescales. The isotope analysis of Aizen et al. (1996) reported the importance of the Indian Ocean, besides the Pacific and Atlantic Oceans, in providing mois-ture for the northern slope of the Himalaya and southeast-ern Tibet. Yao et al. (2013) also reported a strong variability intra-annual in the moisture origin of the precipitation over southern Tibetan Plateau because of the influence of the In-dian monsoon system over the region.
Most of the moisture for the ice-core sites in the Antarctic Domain comes from the region around the austral subtrop-ical high-pressure centres (Fig. 3), in good agreement with
the previous findings of Nieto et al. (2010) at annual scale for a 5-year period of 2000–2004. Southern Africa and the South Atlantic are the major sources for EPICA DML (Fig. 3, clear blue). Vostok (Fig. 3, pink) receives moisture from the Indian Ocean, southern Africa, and southern Oceania. Byrd (Fig. 3, purple) also receives moisture from southern Ocea-nia, as well as from the Pacific Ocean. In JJA the contribution from these sources is enhanced in association with the inten-sification of the austral high-pressure centres and the associ-ated moisture transport. The moisture source regions appear a bit narrow in latitude compared to the results of Sodemann and Stohl (2009). These discrepancies may occur due to the differences in the methodologies. While the method applied here diagnoses the joint quantityE−P of evaporation and precipitation per grid point for all air parcels reaching the target region (associate or not with precipitation), Sodemann and Stohl (2009) take the temporal sequence of moisture in-creases and dein-creases of an air parcel into account for quan-titatively estimating the moisture source’s contribution to the air parcel’s total moisture content and hence to the precipita-tion generated from it over the target.
4 Summary
The Lagrangian approach proposed by Stohl and James (2004) was applied together with the Era-Interim data set in order to identify the major moisture sources for the present climate (1980–2012) for 14 of the more commonly investi-gated ice-core sites worldwide. The sites were classified into three domains (Arctic, Central, and Antarctic), and the fields of the vertically integrated moisture flux were also obtained in order to complement the analysis with an Eulerian per-spective on the moisture transport.
The results shown in Fig. 3 indicate that the oceanic re-gions of the subtropical high-pressure centres act as the ma-jor sources of moisture, and their contribution varies through-out the year following the annual cycles of the centres. For the Arctic Domain, the main moisture sources are the sub-tropical North Atlantic and North Pacific. The subsub-tropical South Atlantic, Indian, and South Pacific oceans provide moisture for the Antarctic Domain. For the Central Domain, the major sources of moisture for South America are the Atlantic and South Pacific, the North Atlantic and Mediter-ranean for Europe, and the Indian Ocean and the Arabian Sea for Asia and Africa.
556 A. Drumond et al.: Moisture Sources for major ice-core sites
therefore the expected deuterium excess signal, if this were the only driver. The Lagrangian approach is interesting not only for ice-core data but also for the interpretation of water stable isotope records recently obtained from continuous, in situ monitoring of surface water vapour (e.g. Steen-Larsen et al., 2013, 2015). This combination allows both to test the validity of the back-trajectory calculation using the isotopic signals and to provide a framework to accurately investigate the meteorological drivers of isotopic fractionation.
5 Data availability
The ERA-Interim data set was obtained from http: //www.ecmwf.int. Please contact Anita Drumond ([email protected]) to request the outputs of the Lagrangian ex-periments.
The Supplement related to this article is available online at doi:10.5194/esd-7-549-2016-supplement.
Acknowledgements. This work was supported by the EPhysLab (UVIGO-CSIC Associated Unit). We acknowledge the support of the Spanish Government and FEDER through the “Transporte de Humedad en la Atmosfera TRAMO” (CGL-2012-35485) and the “Red de Variabilidad y Cambio Climático RECLIM” (CGL2014-517221-REDT) projects.
Edited by: M. Crucifix
References
Aizen, V., Aizen, E., Melack, J., and Martma, T.: Isotopic measure-ments of precipitation on central Asia glaciers (southeastern Ti-betan, northern Himalayas, central Tien Shan), J. Geophys. Res., 101, 9185–9196, 1996.
Andersen, K. K., Azuma, N., Barnola, J.-M., et al.: High-resolution record of Northern Hemisphere climate extend-ing into the last interglacial period, Nature, 431, 147–151, doi:10.1038/nature02805, 2004
Bengtsson, L., Hagemann, S., and Hodges, K. I.: Can climate trends be calculated from reanalysis data?, J. Geophys. Res., 109, D11111, doi:10.1029/2004JD004536, 2004.
Camberlin, P. and Philippon, N.: The east African March–May rainy season: associated atmospheric dynamics and predictability over the 1968–97 period, J. Climate, 15, 1002–1019, 2002.
Chan, R. Y., Vuille, M., Hardy, D. R., and Bradley, R. S.: In-traseasonal precipitation variability on Kilimanjaro and the East African region and its relationship to the large-scale circulation, Theor. Appl. Climatol., 93, 149–165, 2008.
Dansgaard, W., Johnsen, S. J., Clausen, H. B., Dahl-Jensen, D., Gundestrup, N. S., Hammer, C. U., Hvidberg, C. S., Steffensen, J. P., Sveinbjörnsdottir, A. E., Jouzel, J., and Bond, G.: Evidence for general instability of past climate from a 250-kyr ice-core record, Nature, 364, 218–220, 1993.
Dee, D. P., Uppala, S. M., Simmons, A. J., et al.: The ERA-Interim reanalysis: Configuration and performance of the data assimilation system, Q. J. Roy. Meteor. Soc., 137, 553–597, doi:10.1002/qj.828, 2011.
Delmotte, M., Masson, V., Jouzel, J., and Morgan, V.: A seasonal deuterium excess signal at Law Dome, coastal Eastern Antarc-tica: A southern ocean signature, J. Geophys. Res., 105, 7187– 7197, 2000.
Drumond, A., Nieto, R., Gimeno, L., and Ambrizzi, T.: A la-grangian identification of major sources of moisture over Cen-tral Brazil and La Plata Basin, J. Geophys. Res., 113, D14128, doi:10.1029/2007JD009547, 2008.
Drumond, A., Marengo, J., Ambrizzi, T., Nieto, R., Moreira, L., and Gimeno, L.: The role of the Amazon Basin moisture in the atmo-spheric branch of the hydrological cycle: a Lagrangian analysis, Hydrol. Earth Syst. Sci., 18, 2577–2598, doi:10.5194/hess-18-2577-2014, 2014.
ECMWF: ERA-Interim data set, available at: http://www.ecmwf. int, last access: 1 July 2016.
Eichler, A., Schwikowski, M., Gäggeler, H. W., Furrer, V., Synal, H.-A., Beer, J., Saurer, M., and Funk, M.: Glaciochemical dat-ing of an ice core from upper Grenzgletscher (4200 m a.s.l.), J. Glaciol., 46, 507–515, doi:10.3189/172756500781833098, 2000.
Fisher, D. A., Wake, C., Kreutz, K., Yalcin, K., Steig, E., Mayewski, P., Anderson, L., Zheng, J., Rupper, S., Zdanowicz, C., Demuth, M., Waszkiewicz, M., Dahl-Jensen, D., Goto-Azuma, K., Bour-geois, J. B., Koerner, R. M., Sekerka, J., Osterberg, E., Abbott, M. B., Finney, B. P., and Burns, S. J.: Stable isotope records from Mount Logan, Eclipse Ice Cores and Nearby Jellybean Lake. Wa-ter cycle of the North Pacific over 2000 years and over five ver-tical kilometres: sudden shift and tropical connections, Geogr. Phys. Quatern., 58, 337–352, 2004.
Gimeno, L., Drumond, A., Nieto, R., Trigo, R. M., and Stohl, A.: On the origin of continental precipitation, Geophys. Res. Lett., 37, L13804, doi:10.1029/2010GL043712, 2010.
Gimeno, L., Stohl, A., Trigo, R. M., Dominguez, F., Yoshimura, K., Yu, L., Drumond, A., Durán-Quesada, A. M., and Nieto, R.: Oceanic and Terrestrial Sources of Continental Precipitation, Rev. Geophys., 50, RG4003, doi:10.1029/2012RG000389, 2012. Gimeno, L., Nieto, R., Drumond, A., Castillo, R., and Trigo, R. M.: Influence of the intensification of the major oceanic moisture sources on continental precipitation, Geophys. Res. Lett., 40, 1443–1450, doi:10.1002/grl.50338, 2013.
Henderson, K. A.: An ice core paleoclimate study of Windy Dome, Franz Josef Land (Russia): development of a recent climate his-tory for the Barents Sea, Dissertation, The Ohio State University, Ohio, 2002.
Hou, S., Chappellaz, J., Raynaud, D., Masson-Delmotte, V., Jouzel, J., Bousquet, P., and Hauglustaine, D.: A new Himalayan ice core CH4 record: possible hints at the preindustrial latitudinal gra-dient, Clim. Past, 9, 2549–2554, doi:10.5194/cp-9-2549-2013, 2013.
Jouzel, J., Merlivat, L., and Lorius, C.: Deuterium excess in an East Antarctic ice core suggests higher relative humidity at the oceanic surface during the last glacial maximum, Nature, 299, 688–691, 1982.
sources of precipitation, Water Resour. Res., 49, 7469–7486, doi:10.1002/2013WR013508, 2013.
Kurita, N.: Origin of Arctic water vapor during the ice-growth season, Geophys. Res. Lett., 38, L02709, doi:10.1029/2010GL046064, 2011.
Lorenz, C. and Kunstmann, H.: The hydrological cycle in three state-of-the-art reanalyses: Intercomparison and performance analysis, J. Hydrometeorol., 13, 1397–1420, doi:10.1175/jhm-d-11–088.1, 2012.
Mariani, I., Eichler, A., Jenk, T. M., Brönnimann, S., Auchmann, R., Leuenberger, M. C., and Schwikowski, M.: Temperature and precipitation signal in two Alpine ice cores over the period 1961– 2001, Clim. Past, 10, 1093–1108, doi:10.5194/cp-10-1093-2014, 2014.
Markle, B. R., Bertler, N. A. N., Sinclair, K. E., and Sneed, S. B.: Synoptic variability in the Ross Sea region, Antarctica, as seen from back-trajectory modeling and ice core analysis, J. Geophys. Res., 117, D02113, doi:10.1029/2011JD016437, 2012.
Mashiotta, T. A., Thompson, L. G., and Davis, M. E.: The Whi-teRiver Ash: New evidence from the Bona-Churchill ice corere-cord, AGU Fall Meet. Suppl., 2004.
Masson-Delmotte, V., Jouzel, J., Landais, A., Stievenard, M., Johnsen, S. J., White, J. W. C., Werner, M., Sveinbjörnsdottir, A., and Fuhrer, K.: GRIP deuterium excess reveals rapid and or-bital scale changes in Greenland moisture origin, Science, 309, 118–121, 2005.
Meese, D. A., Gow, A. J., Alley, R. B., Zielinski, G. A., Grootes, P. M., Ram, M., Taylor, K. C., Mayewski, P. A., and Bolzan, J. F.: The Greenland Ice Sheet Project 2 depth-age scale: Methods and results, J. Geophys. Res., 102, 26411–26423, doi:10.1029/97JC00269, 1997.
Moore, G. W. K., Holdsworth, G., and Alverson, K.: Variability in the climate of the Pacific Ocean and North America as expressed in the Mount Logan ice core, Ann. Glaciol., 35, 423–429, 2002. Nieto, R., Durán-Quesada, A. M., and Gimeno, L.: Major sources
of moisture for Antarctic ice-core sites identified through a La-grangian approach, Clim. Res., 40, 45-49, doi:10.3354/cr00842, 2010.
Numaguti, A.: Origin and recycling processes of precipitating water over the Eurasian continent: Experiments using an atmospheric general circulation model, J. Geophys. Res., 104, 1957–1972, 1999.
Peixoto, J. P. and Oort, A. H.: Physics of climate, American Institute of Physics, New York, 1992.
Petit, J. R., Jouzel, J., Raynaud, D., Barkov, N. I., Barnola, J.-M., Basile, I., Bender, M., Chappellaz, J., Davis, M., Delaygue, G., Delmotte, M., Kotlyakov, V. M., Legrand, M., Lipenkov, V. Y., Lorius, C., PÉpin, L., Ritz, C., Saltzman, E., and Stievenard, M.: Climate and atmospheric history of the past 420,000 years from the Vostok ice core, Antarctica, Nature, 399, 429–436, 1999. Pfahl, S. and Sodemann, H.: What controls deuterium excess in
global precipitation?, Clim. Past, 10, 771–781, doi:10.5194/cp-10-771-2014, 2014.
Rasmussen, S. O., Abbott, P. M., Blunier, T., Bourne, A. J., Brook, E., Buchardt, S. L., Buizert, C., Chappellaz, J., Clausen, H. B., Cook, E., Dahl-Jensen, D., Davies, S. M., Guillevic, M., Kipf-stuhl, S., Laepple, T., Seierstad, I. K., Severinghaus, J. P., Stef-fensen, J. P., Stowasser, C., Svensson, A., Vallelonga, P., Vinther, B. M., Wilhelms, F., and Winstrup, M.: A first chronology for the
North Greenland Eemian Ice Drilling (NEEM) ice core, Clim. Past, 9, 2713–2730, doi:10.5194/cp-9-2713-2013, 2013. Rienecker, M. M., Suarez, M. J, Gelaro, R., Todling, R.,
Bacmeis-ter, J., Liu, E., Bosilovich, M. G., Schubert, S. D. Takacs, L., Kim, G.-K., Bloom, S., Chen, J., Collins, D., Conaty, A., da Silva, A., Gu, W., Joiner, J., Koster, R. D., Lucchesi, R., Molod, A., Owens, T., Pawson, S., Pegion, P., Redder, C. R., Re-ichle, R., Robertson, F. R., Ruddick, A. G., Sienkiewicz, M., and Woollen, J.: MERRA: NASA’s Modern-Era Retrospective Anal-ysis for Research and Applications, J. Climate, 24, 3624–3648, doi:10.1175/JCLI-D-11-00015.1, 2011.
Ruth, U., Barnola, J.-M., Beer, J., Bigler, M., Blunier, T., Castel-lano, E., Fischer, H., Fundel, F., Huybrechts, P., Kaufmann, P., Kipfstuhl, S., Lambrecht, A., Morganti, A., Oerter, H., Parrenin, F., Rybak, O., Severi, M., Udisti, R., Wilhelms, F., and Wolff, E.: “EDML1”: a chronology for the EPICA deep ice core from Dronning Maud Land, Antarctica, over the last 150 000 years, Clim. Past, 3, 475–484, doi:10.5194/cp-3-475-2007, 2007. Scarchilli, C., Frezzotti, M., and Ruti, P. M.: Snow
precipita-tion at four ice core sites in East Antarctica: provenance, sea-sonality and blocking factors, Clim. Dynam., 37, 2107–2125, doi:10.1007/s00382-010-0946-4, 2011.
Schlosser, E., Oerter,H., Masson-Delmotte, V., and Reijmer C.: At-mospheric influence on the deuterium excess signal in polar firn: Implications for ice-core interpretation, J. Glaciol., 54, 117–124, doi:10.3189/002214308784408991, 2008.
Sodemann, H. and Stohl, A.: Asymmetries in the moisture ori-gin of Antarctic precipitation, Geophys. Res. Lett., 36, L22803, doi:10.1029/2009GL040242, 2009.
Sodemann, H. and Zubler, E.: Seasonal and inter-annual variability of moisture sources for Alpine precipitation during 1995–2002, Int. J. Climatol., 30, 947–961, doi:10.1002/joc.1932, 2009. Sodemann, H., Schwierz, C., and Wernli, H.: Interannual variability
of Greenland winter precipitation sources: Lagrangian moisture diagnostic and North Atlantic Oscillation influence, J. Geophys. Res., 113, D12111, doi:10.1029/2007JD009416, 2008.
Steen-Larsen, H. C., Johnsen, S. J., Masson-Delmotte, V., Stenni, B., Risi, C., Sodemann, H., Balslev-Clausen, D., Blunier, T., Dahl-Jensen, D., Ellehøj, M. D., Falourd, S., Grindsted, A., Gkinis, V., Jouzel, J., Popp, T., Sheldon, S., Simonsen, S. B., Sjolte, J., Steffensen, J. P., Sperlich, P., Sveinbjörnsdóttir, A. E., Vinther, B. M., and White, J. W. C.: Continuous monitoring of summer surface water vapor isotopic composition above the Greenland Ice Sheet, Atmos. Chem. Phys., 13, 4815–4828, doi:10.5194/acp-13-4815-2013, 2013.
Steen-Larsen, H. C., Sveinbjörnsdottir, A. E., Jonsson, Th., Ritter, F., Bonne, J.-L., Masson-Delmotte, V., Sodemann, H., Blunier, T., Dahl-Jensen, D., Vinther, B. M.: Moisture sources and syn-optic to seasonal variability of North Atlantic water vapor iso-topic composition, J. Geophys. Res.-Atmos., 120, 5757–5774, doi:10.1002/2015JD023234, 2015.
558 A. Drumond et al.: Moisture Sources for major ice-core sites
Stohl, A. and James, P.: A Lagrangian Analysis of the Atmospheric Branch of the Global Water Water Cycle. Part I: Method Descrip-tion, Validation and Demonstration for the August 2002 Flooding in Central Europe, J. Hydrometeorol., 5, 656–678, 2004. Stohl, A. and James, P.: A Lagrangian analysis of the atmospheric
branch of the global water cycle. II. Moisture transports between Earth’s ocean basins and river catchments, J. Hydrometeorol., 6, 961–984, 2005.
Stohl, A., Heimberger, L., Scheele, M. P., and Wernli, H.: An in-tercomparison of results from three trajectory models, Meteorol. Appl., 8, 127–135, 2001.
Tierney, J. E., Smerdon, J. E., Anchukaitis, K. J., and Seager, R.: Multidecadal variability in East African hydroclimate controlled by the Indian Ocean, Nature, 493, 389–392, 2013.
Thompson, L. G., Hamilton, W. L., and Bull, C.: Climatological implications of microparticle concentrations in the ice core from Byrd Station, Western Antarctica, J. Glaciol., 14, 433–444, 1975. Thompson, L. G., Mosley-Thompson, E., Davis, M. E., Lin, P.-N., Henderson, K. A., Cole-Dai, J., Bolzan, J. F., and Liu, K-b.: Late Glacial Stage and Holocene tropical ice core records from Huas-caran, Peru, Science, 269, 46–50, 1995.
Thompson, L. G., Davis, M. E., Thompson, E. M., Sowers, T. A., Henderson, K. A., Zagorodnov, V. S., Lin, P. N., Mikhalenko, V. N., Campen, R. K., Bolzan, J. F., Cole-Dai, J., and Francou, B.: A 25,000 year tropical climate history from Bolivian ice cores, Science, 282, 1858–1864, 1998.
Thompson, L. G., Mosley-Thompson, E., and Henderson K. A.: Ice core paleoclimate records in tropical South America since the Last Glacial Maximum, Journal of Quaternary Science, 15, 377– 394, 2000.
Thompson, L. G., Mosley-Thompson, E., Davis, M. E., Hen-derson, K. A., Brecher, H. H., Zagorodnov, V. S., Mash-iotta, T. A., Lin, P.-N., Mikhalenko, V. N., Hardy, D. R., and Beer, J.: Kilimanjaro Ice core Records: Evidence of Holocene climate change in Tropical Africa, Science, 298, 589–593, doi:10.1126/science.1073198, 2002.
Trenberth, K. E., Fasullo, J. T., and Mackaro, J.: Atmo-spheric moisture transports from ocean to land and global energy flows in reanalyses, J. Climate, 24, 4907–4924, doi:10.1175/2011jcli4171.1, 2011.