Photoacclimation strategies in
northeastern Atlantic seagrasses:
Integrating responses across plant
organizational levels
Nadine Schubert
1, Cátia Freitas
2, André Silva
2, Monya M. Costa
2, Isabel Barrote
2,
Paulo A. Horta
3, Ana Claudia Rodrigues
3, Rui Santos
2& João Silva
2Seagrasses live in highly variable light environments and adjust to these variations by expressing acclimatory responses at different plant organizational levels (meadow, shoot, leaf and chloroplast level). Yet, comparative studies, to identify species’ strategies, and integration of the relative importance of photoacclimatory adjustments at different levels are still missing. The variation in photoacclimatory responses at the chloroplast and leaf level were studied along individual leaves of
Cymodocea nodosa, Zostera marina and Z. noltei, including measurements of variable chlorophyll
fluorescence, photosynthesis, photoprotective capacities, non-photochemical quenching and D1-protein repair, and assessments of variation in leaf anatomy and chloroplast distribution. Our results show that the slower-growing C. nodosa expressed rather limited physiological and biochemical adjustments in response to light availability, while both species of faster-growing Zostera showed high variability along the leaves. In contrast, the inverse pattern was found for leaf anatomical adjustments in response to light availability, which were more pronounced in C. nodosa. This integrative plant organizational level approach shows that seagrasses differ in their photoacclimatory strategies and that these are linked to the species’ life history strategies, information that will be critical for predicting the responses of seagrasses to disturbances and to accordingly develop adequate management strategies.
Seagrasses live in highly dynamic environments, characterized by significant fluctuations in the amount of avail-able light. As such, they have evolved a number of acclimatory responses that occur at different organizational levels and over periods of time ranging from seconds to seasons. There is a substantive body of literature report-ing different seagrass photoacclimatory responses that indicate species-specific capacities and strategies. Yet, the vast majority of studies have focused on a single species or single plant organizational level. Hence, comparative studies on acclimatory responses of different seagrass species, as well as studies integrating the relative impor-tance of adjustments at different organizational levels, are needed. The latter represents a concept widely applied in terrestrial plant science to define the ‘acclimation potential’ and strategy of species1,2. Applying it to seagrasses
will allow recognizing how diverse they are with respect to their photoacclimatory responses/strategies and in their tolerance to rapidly changing light environments, as depending on the strategy adopted, the timing of the species’ response will differ.
Numerous studies in seagrasses have addressed the adjustments at single organizational scales, including
chlo-roplast, leaf and shoot/meadow level responses3–7. Chloroplast-level (or physiological and biochemical) responses
to variation in the light environment are related to changes in the photosynthetic and photoprotective capacity
and pigment concentrations8,9. Leaf-level responses include changes in morphology (length, width, thickness),
in area per unit of leaf biomass (SLA- specific leaf area) and number of chloroplasts per unit leaf area, which are
associated with changes in chlorophyll content and photosynthetic capacity per unit leaf area10–13. At the shoot/
meadow-level, seagrasses adjust to varying light regimes through changes in leaf biomass and shoot height and
1Programa de Pós-graduação em Oceanografia, Centro de Ciências Físicas e Matemáticas, Universidade Federal de Santa Catarina, Campus Trindade, Florianópolis, Brazil. 2CCMAR - Centre of Marine Sciences, University of Algarve, Campus Gambelas, 8005-139, Faro, Portugal. 3Departamento de Botânica, Centro de Ciências Biológicas, Universidade Federal de Santa Catarina, Campus Trindade, Florianópolis, Brazil. Correspondence and requests for materials should be addressed to N.S. (email: nadine_schubert@hotmail.com)
Received: 5 July 2018 Accepted: 18 September 2018 Published: xx xx xxxx
density, which usually increase with light intensity, thereby reducing the light reaching individual plants10,13–15.
Such light gradients within seagrass meadows result in light reaching individual seagrass leaves and leaf sections
that may vary several orders of magnitude15–17, causing significant differences in the photosynthetic performance
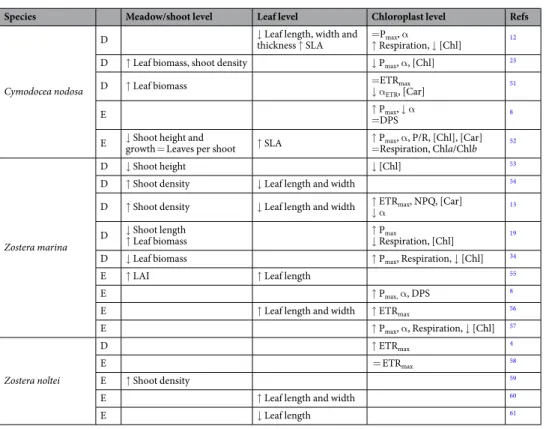
of plants from meadows with different shoot densities and/or leaf biomass, as well as along individual leaves. Many observations of photoacclimatory responses of northeastern Atlantic seagrasses have been reported, ranging from changes in leaf biomass and/or shoot density, variations in leaf morphology, to physiological and
biochemical adjustments (Table 1). Under high light intensities, both Cymodocea nodosa and Zostera marina
generally increased their leaf biomass, while decreasing shoot height, resulting in shorter, narrower and thin-ner leaves, even though a few studies reported the opposite response in Z. marina. On the other hand, the chloroplast-level responses of photosynthetic parameters and pigment concentration of C. nodosa are highly variable, whereas in Z. marina an increase in photosynthesis and a decrease in chlorophyll content has been
described (Table 1). In contrast with Z. marina, only a few studies are available on the subject for its congeneric
Z. noltei, a mostly intertidal species18. Similar to its sister species, this species responds with increasing shoot
den-sity in response to higher light conditions, while there are contrasting reports on the changes in leaf morphology
and photosynthetic capacity (Table 1).
These photoacclimatory responses of seagrasses derive mostly from single-species or single–organizational level studies, making it difficult to integrate responses within a species or to compare photoacclimatory strategies among species. The goal of this study was to determine and compare the photoacclimatory responses of the three North Atlantic seagrass species, C. nodosa, Z. marina and Z. noltei, specifically focusing on the adjustments at the chloroplast and leaf level. We examined physiological, biochemical and anatomical adjustments in response to canopy light gradients along individual leaves. Integrating the adjustments at the different levels, the capacity and strategies of the species to cope with light changes were evaluated and discussed in relation to the species’ life history strategies.
Results
Shoot density and Leaf Area Index (LAI).
Cymodocea nodosa and Z. marina meadows showed similarshoot densities (288 ± 41 and 236 ± 29 shoots m−2, respectively), while Z. noltei meadow was significantly denser
(p < 0.0001), with twice as many shoots per square meter (588 ± 91 shoots m−2). The species also differed in the
number of leaves per shoot (three leaves in C. nodosa and Z. noltei, four leaves in Z. marina) and leaf size, with longer and wider leaves of C. nodosa and Z. marina (30–33 cm long, 0.5–0.6 cm wide), compared to Z. noltei
(24 cm long, 0.2 cm wide). This resulted in differences in LAI, which was lowest in Z. noltei (LAI = 0.50 m2 m−2),
followed by C. nodosa (LAI = 0.7 m2 m−2) with the highest value found for Z. marina (LAI = 1.04 m2 m−2).
Zostera marina D
↓ Shoot length
↑ Leaf biomass ↑ P↓ Respiration, [Chl]max 19 D ↓ Leaf biomass ↑ Pmax, Respiration, ↓ [Chl] 34
E ↑ LAI ↑ Leaf length 55
E ↑ Pmax, α, DPS 8
E ↑ Leaf length and width ↑ ETRmax 56
E ↑ Pmax, α, Respiration, ↓ [Chl] 57
Zostera noltei
D ↑ ETRmax 4
E = ETRmax 58
E ↑ Shoot density 59
E ↑ Leaf length and width 60
E ↓ Leaf length 61
Table 1. Summary of reported photoacclimatory responses (high-light adjustments compared to low light)
at different plant organizational levels of northeastern Atlantic seagrass species. (D- different depths, E-
experimental changes in light levels; LAI- leaf area index; SLA- specific leaf area; Pmax, ETRmax- maximum
photosynthetic and electron-transport rate; α- photosynthetic efficiency; [Chl], [Car]- chlorophyll and carotenoid concentration; DPS- de-epoxidation state).
Seagrass light absorption and photosynthesis.
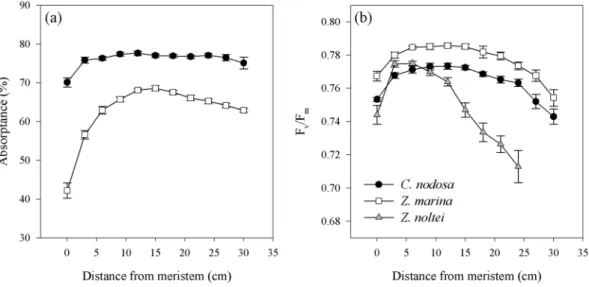
Cymodocea nodosa exhibited higher light absorptancevalues (up to 77%) than Z. marina (Fig. 1a). In both species, absorption was lower near the meristem than in the
rest of the leaf. Whereas the spatial variation in absorptance along C. nodosa leaves was minimal, in Z. marina there was a strong increase in light absorption from the basal to the middle section (from 42 to 69%), with a sub-sequent slight decline towards the leaf tip (Fig. 1a).
Zostera marina showed higher values of Fv/Fm along the leaves than C. nodosa, but with a similar variation
pattern. Fv/Fm increased from the base of the leaf to its middle, with the highest values between 6 and 15 cm,
and decreased towards the tip, (Fig. 1b). In Z. noltei, the initial increase of Fv/Fm was higher, the highest values
were observed in a shorter section (3–6 cm) and the subsequent drop towards the leaf tip was more pronounced (Fig. 1b).
Different patterns of the photosynthetic characteristics along the leaves were found in the three studied spe-cies. As expected, the middle leaf section, which also had the highest Fv/Fm values (Fig. 1), exhibited the highest
maximum photosynthetic rates (Pmax) in all species, when normalized by surface area, while different patterns
were found with respect to the basal section and the leaf tip (Fig. 2; Table 2). In C. nodosa, the leaf tip did not
exhibit significant differences to the basal section of the leaf, while in Z. marina the leaf tip showed intermediate Pmax values, with the lowest values in the basal section (Table 2). A different pattern was shown in Z. noltei, where
Pmax was lowest at the leaf tip, without significant differences between middle and basal section (Table 2). The
photosynthetic efficiency (α) did not vary along the leaves of the three species and in the case of the irradiance of
compensation (Ic) differences between leaf sections were found only in Z. marina, with significantly lower values
in the leaf tip, while there were no differences along the leaves of the species for dark respiration and saturation irradiance (Ik) (Table 2).
The pattern of variation in photosynthetic characteristics along the leaves changed, when the data were
nor-malized by dry weight, especially in the case of C. nodosa (Table 2). Here, Pmax and α increased from the base to
the leaf tip, with significant higher values in the leaf middle and tip, with the leaf tip also showing the highest
respiration rates (Table 2). In the case of Z. marina, normalization by dry weight did not change the along-the-leaf
patterns, while Z. noltei showed slight differences in the variation of Pmax. In the last, Pmax (when normalized by
dry weight) was highest in the leaf middle, but not significantly different from the values determined in the leaf base (Table 2).
Leaf chlorophyll content exhibited higher concentrations in the middle leaf section in both Z. marina and Z. noltei, when compared to the leaf tip and basal section, while it did not show variation along C. nodosa leaves (Table 2). The Chla/Chlb ratios did not vary along the leaf in any of the species (Table 2).
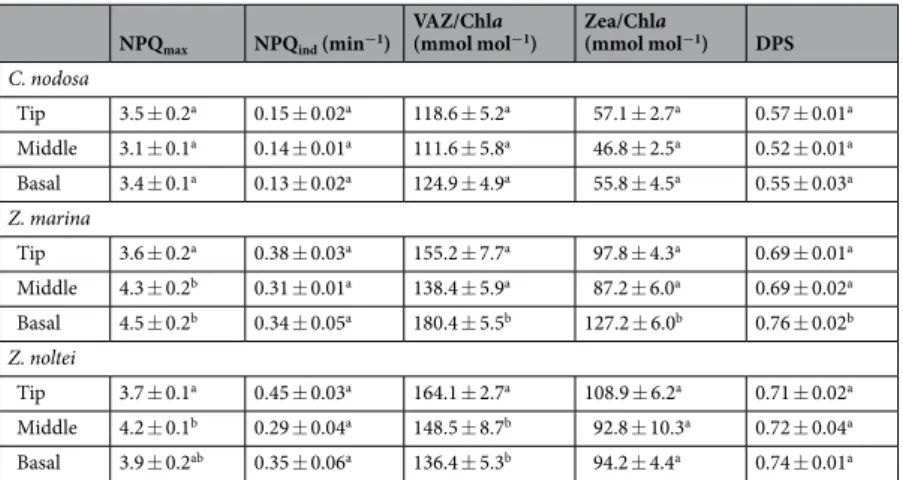
Photoprotective capacity and xanthophyll cycling.
The mean leaf photoprotective capacity, measured here as Non-Photochemical Quenching (NPQ), differed significantly among species (P < 0.0001), with C. nodosashowing the lowest NPQmax values and the slowest NPQ induction rate among species, without any differences
along the leaf (Table 3). This agrees with its significantly smaller mean leaf VAZ-pool size and lower DPS values
(P < 0.0001), compared to both Zostera species (Table 3). On the other hand, in the two Zostera species, NPQmax
and its induction rates were similar but in both the leaf tip achieved significantly lower NPQmax values compared
to the basal and middle leaf section (Table 3). Within species, no clear pattern was found between NPQmax in
different leaf sections and their respective photoprotective xanthophyll pigment concentrations (VAZ)-pool size
and/or de-epoxidation state (DPS) values. This inconsistency between NPQmax and xanthophyll cycle (XC)-pool
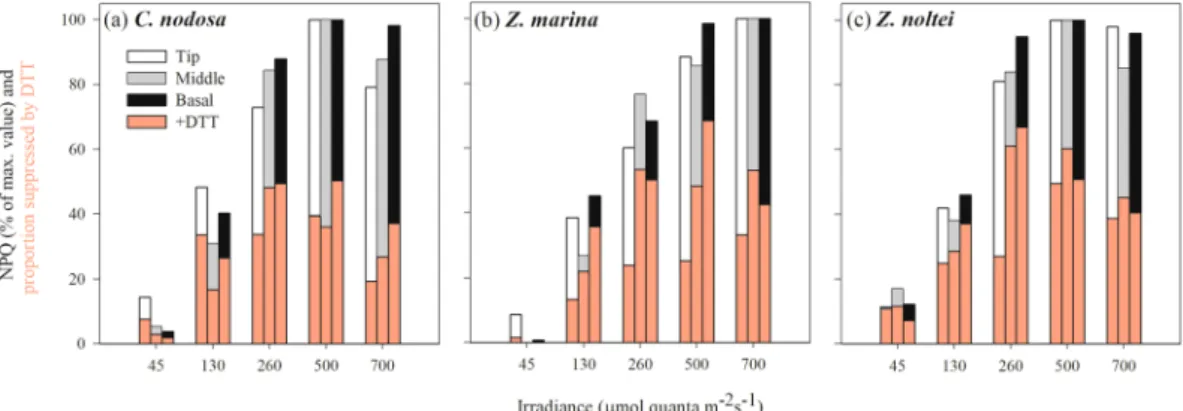
size and DPS might be related to differences in the dependence of NPQ on the XC among species and leaf sec-tions, here determined by using dithiothreitol (DTT) to inhibit the conversion of violaxanthin into zeaxanthin (Fig. 3).
Figure 1. Variation of absorptance (a) and Fv/Fm (b) along the 2nd youngest leaf of C. nodosa, Z. marina and
Z. noltei. Absorptance along Z. noltei leaves could not be measured (see Material and Methods). Data represent mean ± SE, n = 20).
NPQ in C. nodosa was suppressed by ~50–70% in the presence of DTT in all leaf sections upon exposure of up
to 260 μmol m−2 s−1, while the dependence of NPQ on XC decreased at higher light intensities (25–50%; Fig. 3a).
In Z. marina, NPQ in the leaf tip depended much less on XC, compared to the other leaf sections, as here only
18–40% of NPQ were suppressed by DTT, but was induced already at an irradiance < Ik (Fig. 3b). A similar pattern
was also found in Z. noltei (NPQ suppression in leaf tip = 34–50%, in the middle and basal sections = 42–81%). However, in contrast to Z. marina, NPQ in Z. noltei was induced in all leaf sections at sub-saturating light inten-sity (<Ik), where it depended greatly on XC (60–94%, depending on leaf section) (Fig. 3c).
Photodamage repair.
When exposed to a series of increasing light intensities, the responses of the threespecies, as well as their leaf sections, showed relatively similar patterns. In all species, ΔF/Fm′ decreased
expo-nentially with increasing light intensity after 1 h of light exposure, while it showed a negative linear relationship with the light intensity of exposure after 1 h of recovery. The exception was the leaf tip of Z. noltei that showed
an exponential recovery relationship with the irradiance of exposure (Fig. 4). When the repair was inhibited by
lincomycin, no differences between control- and lincomycin-treated samples were found in C. nodosa in any leaf
section (Fig. 4a–c). In Z. marina, an effect of lincomycin was found only during recovery after exposure to the
highest irradiance levels in the middle and basal section (Fig. 4d–f). In contrast, in Z. noltei, the basal leaf section
did not show any inhibitor effect (Fig. 4g), while the middle leaf section showed D1 protein repair activity only
during recovery after exposure to irradiances above 45 μmol m−2 s−1 (Fig. 4h). The leaf tip of Z. noltei showed a
significantly higher decrease in ΔF/Fm′ after 1 h of light exposure in the presence of lincomycin, as well as a
sig-nificantly lower recovery of ΔF/Fm′ after exposure to all irradiance levels (Fig. 4i).
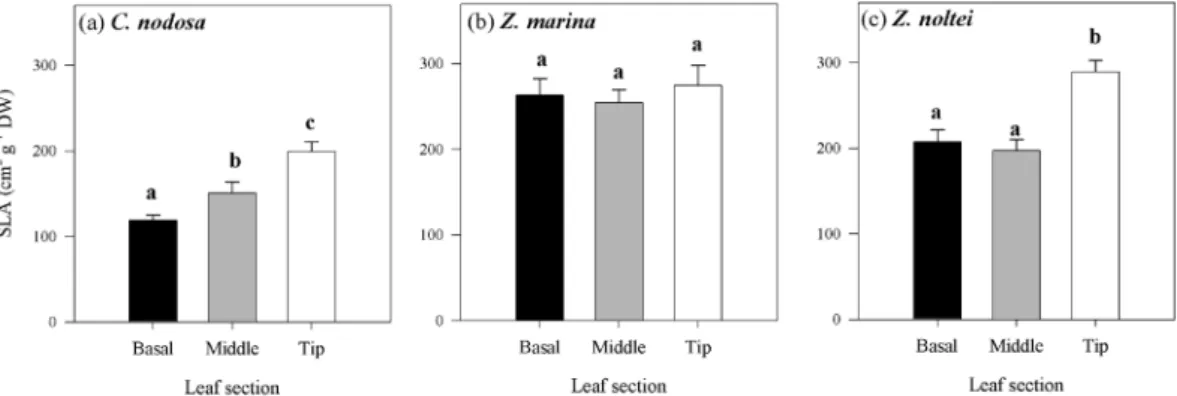
Seagrass leaf anatomy and chloroplast distribution.
Differences in leaf anatomy and chloroplast dis-tribution were found among species and along individual seagrass leaves. The mean specific leaf area (SLA) was significantly lower in C. nodosa, compared to Zostera spp. (P < 0.0001) and differed along the leaves of the species,Figure 2. Photosynthesis-Irradiance curves performed on different leaf sections from 2nd youngest leaves of
with exception of Z. marina (Fig. 5). In C. nodosa, SLA significantly increased from the leaf base towards the tip
(Fig. 5a, P = 0.00024), while in Z. noltei SLA was similar in the basal and middle leaf section but significantly
higher at the leaf tip (Fig. 5c, P = 0.00082). These results agree with the observations on the cross sections of the
different leaf sections (see Fig. 6). The number and size of lacunae decreased towards the leaf tip in all species,
with a similar pattern observed in Zostera spp. (Fig. 6g–h,m–o). This decrease was more drastic in C. nodosa due
to its higher number and larger size of lacunae in the basal section, compared to the middle section and leaf tip
(Fig. 6a–c). These leaf anatomical changes were accompanied by differences in the chloroplast distribution within
the cells. While in all species and leaf sections the chloroplasts were concentrated in the epidermis, there were differences in the number of chloroplasts spread out in the underlying mesophyll cells. In general, a visibly higher proportion of chloroplasts seemed to be present in C. nodosa mesophyll cells throughout the leaf, in contrast to Zostera spp. Also, an increasing number of chloroplasts was concentrated in the mesophyll cells towards the leaf tip in Z. marina and C. nodosa, a trait more pronounced in the latter species (Fig. 6d–f,j–l). In contrast, in Z. noltei very few chloroplasts were found in the mesophyll cells, without any visible increase of their abundance toward the leaf tip (Fig. 6p–r).
Pmax α RD
Ic Ik Chla Total Chl Chla/Chlb
per area per DW per area per DW per area per DW
C. nodosa Tip 2.1 ± 0.3a 414 ± 49a 0.042 ± 0.006a 8.3 ± 0.9a 0.79 ± 0.15a 171 ± 18a 19 ± 5a 53 ± 6a 24.2 ± 4.1a 33.4 ± 5.5a 2.7 ± 0.1a Middle 2.8 ± 0.2b 384 ± 29a 0.045 ± 0.002a 6.7 ± 0.3a 0.86 ± 0.07a 117 ± 8.0b 16 ± 2a 64 ± 7a 26.4 ± 2.8a 35.7 ± 3.8a 2.9 ± 0.1a Basal 2.2 ± 0.2a 258 ± 30b 0.035 ± 0.003a 4.2 ± 0.6b 1.00 ± 0.14a 109 ± 13b 28 ± 6a 64 ± 6a 24.1 ± 5.6a 32.6 ± 3.5a 2.9 ± 0.1a Z. marina Tip 3.2 ± 0.3a 967 ± 83a 0.025 ± 0.004a 6.8 ± 0.8a 0.36 ± 0.08a 99 ± 23a 11 ± 1a 96 ± 9a 20.2 ± 1.2a 27.3 ± 1.7a 2.9 ± 0.1a Middle 4.1 ± 0.3b 1134 ± 43b 0.031 ± 0.006a 6.9 ± 0.9a 0.51 ± 0.34a 170 ± 73a 26 ± 6b 113 ± 26a 30.1 ± 1.9b 41.2 ± 2.9b 2.8 ± 0.1a Basal 2.1 ± 0.1c 546 ± 41c 0.017 ± 0.002a 4.2 ± 0.4b 0.43 ± 0.06a 94 ± 20a 25 ± 3b 108 ± 9a 15.7 ± 0.8c 21.4 ± 1.1c 2.8 ± 0.1a Z. noltei Tip 2.5 ± 0.5a 693 ± 118a 0.028 ± 0.004a 7.9 ± 0.9a 1.3 ± 0.4a 395 ± 122a 37 ± 13a 100 ± 13a 19.2 ± 2.1a 24.7 ± 2.8a 3.6 ± 0.1a Middle 4.9 ± 0.2b 963 ± 52b 0.048 ± 0.006a 9.2 ± 0.7a 1.4 ± 0.4a 272 ± 63a 29 ± 5a 106 ± 12a 31.7 ± 2.4b 40.7 ± 3.2b 3.6 ± 0.1a Basal 4.3 ± 0.4b 883 ± 11ab 0.045 ± 0.008a 9.2 ± 1.3a 1.7 ± 0.4a 334 ± 51a 37 ± 7a 100 ± 12a 22.6 ± 1.8a 29.4 ± 2.2a 3.4 ± 0.1a Table 2. Photosynthetic parameters (n = 5), normalized by surface area and dry weight, and chlorophyll
content (μg cm−2, n = 6) of C. nodosa, Z. marina and Z. noltei leaf sections. Data represent mean ± SE and
different superscript letters indicate statistical differences between leaf sections within the same species
(one-way ANOVA, P < 0.05, Newman-Keuls). (Maximum gross photosynthesis (Pmax) and dark respiration (RD)
in μmol O2 cm−2 h−1 or μmol O2 g DW−1 h−1, α-photosynthetic efficiency in μmol O2 cm−2 h−1 [μmol quanta
m−2 s−1]−1 or μmol O
2 g DW−1 h−1 [μmol quanta m−2 s−1]−1, Ic and Ik - compensatory and saturating light
intensity, respectively, in μmol quanta m−2 s−1).
NPQmax NPQind (min−1)
VAZ/Chla
(mmol mol−1) Zea/Chla (mmol mol−1) DPS C. nodosa Tip 3.5 ± 0.2a 0.15 ± 0.02a 118.6 ± 5.2a 57.1 ± 2.7a 0.57 ± 0.01a Middle 3.1 ± 0.1a 0.14 ± 0.01a 111.6 ± 5.8a 46.8 ± 2.5a 0.52 ± 0.01a Basal 3.4 ± 0.1a 0.13 ± 0.02a 124.9 ± 4.9a 55.8 ± 4.5a 0.55 ± 0.03a Z. marina Tip 3.6 ± 0.2a 0.38 ± 0.03a 155.2 ± 7.7a 97.8 ± 4.3a 0.69 ± 0.01a Middle 4.3 ± 0.2b 0.31 ± 0.01a 138.4 ± 5.9a 87.2 ± 6.0a 0.69 ± 0.02a Basal 4.5 ± 0.2b 0.34 ± 0.05a 180.4 ± 5.5b 127.2 ± 6.0b 0.76 ± 0.02b Z. noltei Tip 3.7 ± 0.1a 0.45 ± 0.03a 164.1 ± 2.7a 108.9 ± 6.2a 0.71 ± 0.02a Middle 4.2 ± 0.1b 0.29 ± 0.04a 148.5 ± 8.7b 92.8 ± 10.3a 0.72 ± 0.04a Basal 3.9 ± 0.2ab 0.35 ± 0.06a 136.4 ± 5.3b 94.2 ± 4.4a 0.74 ± 0.01a
Table 3. Photoprotective capacities of northeastern Atlantic seagrass species. Data represent mean ± SE (n = 6)
and different superscript letters indicate statistical differences between leaf sections within the same species
(one-way ANOVA, P < 0.05, Newman-Keuls). (Maximum Non-Photochemical Quenching (NPQmax), NPQ
fast induction rates (NPQind), photoprotective xanthophyll pigment concentrations (VAZ), zeaxanthin (Zea)
Figure 3. Induction of NPQ in response to increasing light intensities (expressed in % of maximum NPQ
induction) in different leaf sections of C. nodosa (a), Z. marina (b) and Z. noltei (c), and the importance of xanthophyll cycling in NPQ induction (shown as % of NPQ suppressed in presence of DTT, an inhibitor of the de-epoxidation of violaxanthin to antheraxanthin, see overlying pink bars).
Figure 4. Response of ΔF/Fm′ to high light exposure (indicated by white background) and after 1 h of recovery
under dim-light conditions (indicated by grey background) in the absence (squares) and presence of lincomycin (inhibitor of D1 protein repair; blue triangles) in different leaf sections (white leaf tip; grey squares-middle section; black squares-basal section) of C. nodosa (a–c), Z. marina (d–f) and Z. noltei (g–i). Data represent mean ± SE (n = 6) and significant differences between control and lincomycin-treatment (P ≤ 0.05) are indicated by asterisks.
Relationship between photoacclimation and species’ life history strategies.
An inverse linearrelationship (R2 = 0.90, P = 0.0324) was observed between mean leaf P
max and leaf life span (using the plastochron
interval as descriptor) (Fig. 7a).
The differences in the strength of the chloroplast-level adjustments of the species could be illustrated by relat-ing the age of the leaf sections of each species with the variations found in their Pmax (Fig. 7b). The fast-growing
seagrass species, Zostera spp., invested more in these fast-response adjustments, shown by a higher variability of
Pmax along the leaf in response to light availability. In contrast, the slower-growing C. nodosa showed less
variabil-ity along the leaf, regarding adjustments at the chloroplast level, seemingly relying more on structural adjustments at the leaf level (Fig. 6a–c).
Discussion
Two types of photoacclimatory adjustments were observed in response to changing light levels along the leaves of the three seagrass species. While C. nodosa expressed rather limited physiological and biochemical adjustments in response to light availability compared to Zostera spp., the opposite was found with respect to leaf anatomical adjustments.
In general, the chloroplast-level acclimation to increased irradiance in seagrasses is governed by two cesses: firstly, an increase in photosynthetic capacity to utilize the extra excitation energy for assimilatory pro-cesses8,19,20 and secondly, an increase in the capacity of photoprotective mechanisms, mainly related to xanthophyll
cycling9,21,22. In this study, C. nodosa showed very limited variation in both photosynthesis (per area) and
pho-toprotective capacity along the leaves, findings also supported by other studies8,12,23. On the other hand, both
Zostera species showed differences in photosynthetic and photoprotective capacity along the leaves, even though
Figure 5. Specific leaf area (SLA) of different leaf sections of C. nodosa (a), Z. marina (b) and Z. noltei (c).
Data represent mean ± SE (n = 5) and significant differences (P ≤ 0.05) between leaf sections are indicated by different letters.
Figure 6. Tip, middle and basal leaf cross sections of C. nodosa (a–f), Z. marina (g–l) and Z. noltei (m–s).
Overview on clear field stained with toluidine blue (a–c,g–i,m–o). Detail showing chloroplasts in red, emitted from 650 to 750 nm on Laser Scanning Confocal Microscope (d–f,j–l,p–r). Aerenchymas are indicated by asterisks. Scale bar: 100 µm (a–c,g–i,m–o); 25 µm (d–f,j–l,p–r).
there were lower differences between the leaf base and middle leaf section in Z. noltei, while in Z. marina
signif-icant differences among all leaf sections were found (Tables 2 and 3). This may be explained by the higher LAI of
Z. marina and by their vertical distribution, as Z. marina mainly inhabits the subtidal, while Z. noltei is found in the intertidal zone. The upright habit of the former creates a more gradual increase in light availability along the leaf within the canopy, while the intertidal Z. noltei is exposed to tidal movement, causing a more horizontal position of the leaves. Hence, light availability along the leaf is less gradual, as the upper section of the leaf is exposed to high light levels, especially during low tide, while the basal leaf section is protected from stressful light conditions by the overlying canopy. This different light exposure is also reflected in the spatial variation of Fv/Fm along the leaf (Fig. 1b)
and might explain the fact that in Z. noltei the most productive leaf section was located closer to the basal section and not at the leaf middle as in the other species. No clear gradients in chloroplast-level adjustments in response to increasing light levels along the leaves were found in Zostera spp., as both species exhibited lower photosynthetic and photoprotective capacities at the leaf tip. In Z. noltei, this was related to higher photodamage at the tip, as shown by
the high D1-protein turnover during and after light exposure (Fig. 4g–i), thus reducing the number of active
photo-systems II. This trait was only marginally present in Z. marina at the basal and middle leaf section, while no evidence of D1 protein repair in response to high-light stress was observed in C. nodosa.
There were species-specific differences in photoacclimation at the leaf level, related to changes in SLA and chloro-plast distribution within epidermis and mesophyll cells. Unlike chlorochloro-plast-level adjustments, C. nodosa showed the largest variation in leaf-level acclimatory responses along the leaf. The leaf anatomy of this species adjusted to increasing light levels by gradually redistributing the chloroplasts in different cell layers. The SLA increase in C. nodosa seemed to be due to a decrease in leaf thickness, caused by reduction of number of cell layers from the leaf base towards the tip (Figs 5a and 6a–c). Similarly, in Z. noltei the significantly higher SLA of the leaf tip was associated with a strong decrease in leaf thickness, but without a gradual reduction in cell layers (Figs 5c and 6m–o). Such changes in SLA, directly related to a decrease in leaf thickness, agree with previous studies in C. nodosa and Thalassia testudinum12,24. In addition to
changes in leaf anatomy, the proportion of chloroplasts in the mesophyll cells increased towards the leaf tip where the light level is higher, a feature so far only reported in Z. capricorni, where higher mesophyll chloroplast densities were
found under high- compared to low-light acclimated leaves10. This study also showed that the higher chloroplast
den-sity in the mesophyll cells was accompanied by a decrease of chlorophyll per chloroplast.
The occurrence of a small proportion of chloroplasts in seagrass mesophyll cells can be found throughout the literature25–29, but so far, no attention has been paid to its implications. Considering the changes in leaf
anat-omy and the occurrence of chloroplasts in the mesophyll cells in C. nodosa, this trait may give the species an advantage with respect to light limitation. The lower density of chloroplasts in the mesophyll of the basal section
might minimize the strong package effect caused by the concentration of chloroplasts in the epidermis30. This
is supported by the higher optical absorption (at similar chlorophyll contents) with low spatial variation along
C. nodosa leaves, compared to Z. marina (Fig. 1a), which did not show changes in SLA and had a lower
propor-tion of its chloroplasts located in the mesophyll cells (Fig. 6). On the other hand, as light levels increase towards
the leaf tip, the distribution of a higher number of chloroplasts deeper into the tissue may protect them from high-light stress, thus ensuring maintenance of leaf photosynthetic rates. In the case of C. nodosa, the lower SLA of the leaves compared to the other studied species, and its gradual increase towards the leaf tips, allows some
Figure 7. Illustration of the relationship between life history strategies and response of leaf metabolic
rates to light availability in the three seagrasses studied. (a) Inverse linear relationship between maximum photosynthetic rate (leaf average, mean ± SE) and plastochron interval (as descriptor for leaf life span) and (b) comparison of chloroplast-level adjustments in relation to the specie’s leaf growth rate, here illustrated as the variation of maximum photosynthetic rates along seagrass leaves in relation to the age of the respective leaf section (see Materials and Methods).
regulation of the internal light field efficiently by changing the optical light path24. It hereby protects a fraction
of the chloroplasts from excessive light levels by their wide dispersion in the epidermal layer and the mesophyll away from the leaf surface, which explains the similar high-light responses along the C. nodosa leaf compared to Zostera spp., while expressing less NPQ and xanthophyll cycling. This anatomical feature creates a heterogeneous population of chloroplasts and thus, the physiological measurements reflect an integrated response from
chloro-plasts at different depths within the mesophyll31. In contrast, the Zostera spp. chloroplasts occur more exclusively
in the epidermal layer and little-to-no changes in SLA have been found in these species. This may explain the need for increasing photoprotective capacity and photosynthetic plasticity along the leaf in Zostera spp.
The assessment of distinct types of photoacclimatory adjustments along the leaves revealed clear differences in light acclimation strategies among species. Cymodocea nodosa seems to pursue a strategy involving a combination of leaf anatomical and, to a lesser degree, physiological and biochemical adjustments in response to different light environments. On the other hand, adjustments in Zostera spp. leaf anatomy are of minor importance compared to chloroplast-level responses. Differences were also found between the congeneric species, as Z. marina seems to adjust to increasing light levels with the distribution of a higher proportion of chloroplast into the underlying mesophyll cells (Fig. 6), thus decreasing the light the chloroplasts are exposed to, while Z. noltei relies mainly on physiological/bio-chemical adjustments. In this context, differences in the adjustments at different organizational levels have to be taken into account in interpretation of variation of leaf photoacclimatory descriptors at the chloroplast level, based on weight. In species such as C. nodosa, which also express leaf-anatomical changes that result in changes in biomass descriptors, it
may lead to erroneous conclusions in understanding the photoacclimatory responses of seagrasses (see Table 2).
Here we revealed that the terrestrial plants well-known relationship between life history strategy and leaf metabolic rates32,33 also holds for seagrasses, specifically between leaf life span and P
max (Fig. 7a) and between the
species life history traits and chloroplast-level adjustments (Fig. 7b). Considering their fast leaf elongation and
turnover rates, and short leaf life spans, it is not surprising that Z. marina and Z. noltei rely more on biochemical adjustments than on leaf anatomical changes to acclimate to changing light levels. This seems to be combined with meadow/shoot-level adjustment (shoot density and height, and leaf biomass), a strategy also favored by the faster growth of these species. Zostera marina in particular may compensate for the lack of leaf anatomical
adjust-ments34 with a higher role of acclimation responses at the canopy and shoot-level, as it has the highest reported
LAI among the three species (1.7–6.7 m2 leaf area m−2 area35). This agrees with previous reports36 and is also
supported by our findings of a higher LAI compared to C. nodosa (0.7 vs. 1.04), despite similar shoot densities. On the other hand, the importance of anatomical adjustments that act at a longer time scale in the photoacclima-tion of C. nodosa seems to be governed by its slower leaf elongaphotoacclima-tion rate, lower leaf turnover and longer life span
(Table 4). This kind of adjustments represents a structural investment, more justifiable than in short-lived species
with a high leaf turnover, such as Zostera spp.
In summary, seagrasses with different life histories show different photoacclimation strategies, which are related to differences in the relative weight of photoacclimatory processes at the chloroplast level versus adjust-ments at the leaf-anatomical level. In this context, shoot- and meadow-level acclimatory responses should also be considered. This knowledge will bring us one step forward towards the understanding of how these species adjust to changing environmental conditions such as light availability, which will be critical for predicting the effects of local and global changes and accordingly develop adequate management strategies.
Methods
Sampling site, collection and maintenance.
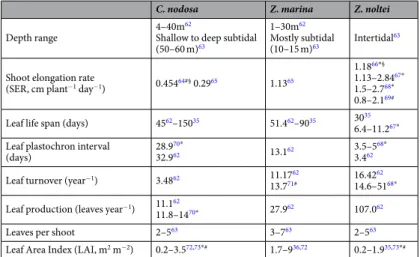
The Ria Formosa coastal lagoon (South Portugal) is a complex system of channels protected by a set of barrier islands, with the shallow to deep subtidal zones mainly dominated by co-occurring perennial beds of Cymodocea nodosa and Zostera marina, while Z. noltei forms dense beds in the muddy areas of the intertidal flats37.C. nodosa Z. marina Z. noltei
Depth range 4–40m
62
Shallow to deep subtidal (50–60 m)63
1–30m62 Mostly subtidal
(10–15 m)63 Intertidal 63
Shoot elongation rate
(SER, cm plant−1 day−1) 0.45464#§ 0.2965 1.1365
1.1866*§
1.13–2.8467*
1.5–2.768*
0.8–2.169#
Leaf life span (days) 4562–15035 51.462–9035 3035 6.4–11.267*
Leaf plastochron interval
(days) 28.9
70*
32.962 13.162 3.5–5
68*
3.462 Leaf turnover (year−1) 3.4862 11.1762
13.771# 16.42
62 14.6–5168*
Leaf production (leaves year−1) 11.162
11.8–1470* 27.962 107.062
Leaves per shoot 2–563 3–763 2–563
Leaf Area Index (LAI, m2 m−2) 0.2–3.572,73*# 1.7–936,72 0.2–1.935,73*#
Table 4. Summary of reported depth ranges and leaf structural and growth parameters of the seagrass species
studied (same sampling site as present study or close by: *Ria Formosa, southern Portugal and #Cádiz Bay,
youngest leaves of similar length were chosen for measurements (30 cm long leaves for C. nodosa and Z. marina, 24 cm long leaves for Z. noltei). Before measurements, leaf epiphytes were carefully removed by scraping with a razor blade.
The leaf response was characterized in three segments per leaf (2.5 cm length): basal sections (0–2.5 cm from meristem), middle sections (12.5–15 cm distance from meristem in C. nodosa and Z. marina, and 4.5–7 cm
dis-tance from meristem in Z. noltei), which were the sections of highest Fv/Fm values along the leaf, and apical
sections (tip).
Shoot density and LAI determination.
To gather information about eventual in situ differences in self-shading within the seagrass canopy of the studied species, the shoot density was determined at each col-lection site by counting the number of shoots within 25 × 25 cm squares (n = 10). The total leaf area (based on one-side) per area of seagrass bed (leaf area index, LAI, m2 m−2), a descriptor of the degree of leaf packing withinthe canopy39, was determined.
Absorptance measurements along leaves.
The spatial variation in light absorption was measured every 3 cm along the leaf of the shoots (n = 20 per species), using the methodology described by Vásquez-Elizondo et al.40. Briefly, leaf absorption was measured under a LED lamp using the Diving PAM’s light sensor calibratedagainst a LiCor LI-190 cosine quantum sensor (LI-COR, Lincoln, NE, USA), maintaining a constant distance between light source and leaf, as well as between light sensor and leaf. The amount of light passing through the leaves was determined and later corrected for non-photosynthetic absorption, measured by using de-pigmented leaves (i.e. leaves soaked in diluted bleach for 1 h to remove photosynthetic pigments). Unfortunately, this tech-nique could not be applied in Z. noltei, as its leaves were narrower than the diameter of the light sensor, and for accurate measurements, the samples must completely cover the light sensor.
Photosynthetic performance.
Photosynthesis was evaluated through Photosynthesis-Irradiance curves (P-I curves), measured with an oxygen electrode system (DW3/CB1, Hansatech, Norfolk, UK), as described in Silva etal.8. For each P-I curve, the leaf section (n = 5 per leaf section and species) of either Z. marina or C. nodosa were
clipped and mounted vertically inside the measuring chamber for an even exposure to the incident light. Due to the small leaf area of Z. noltei, leaf sections from four independent leaves were used, mounted side by side in the
incu-bation chamber, to ensure a good signal to noise ratio. GF/F filtered seawater (35‰), supplemented with NaHCO3
(final conc. 4 mM) to avoid CO2 limitation, was used for the incubations. During the measurements, the water in
the incubation chamber was continuously stirred and the temperature was kept constant at 18 °C. For each replicate
curve, ten light levels were applied sequentially, increasing from 0 to 1248 μmol quanta m−2 s−1. Each light level
was imposed for approximately 10–15 min, enough time to obtain a straight line in the oxygen recording system, assumed as steady-state photosynthesis. At the beginning and the end of each light response curve, the samples were incubated in darkness, to determine the dark (RD) and post-illuminatory (or light) respiration rate (RL), respectively.
Gross photosynthetic rates of the seagrass leaf sections, calculated by adding respiration rates (average of RD and
RL) to the net photosynthetic rates, were plotted against the different light intensities using an exponential fit. The
maximum photosynthetic rates (Pmax) were obtained from the average maximum values above saturating irradiance.
The photosynthetic quantum efficiency (α) was estimated from the initial slope of the light response curve by linear
least-squares regression analysis. Irradiance of compensation (Ic) was estimated from the ratio RD/α and the
satura-tion irradiance (Ik) was estimated as the ratio of Pmax/α. After each light response curve, the area of the leaf sections
was measured and afterwards, they were dried at 60 °C for 48 h.
Chlorophyll a fluorescence measurements.
Photosystem II Chla emission was measured with a pulse amplitude modulated fluorometer (Diving-PAM; Walz, Effeltrich, Germany). Nomenclature and parametercal-culation was performed as in van Kooten and Snel41. Maximum PSII quantum efficiency was determined as F
v/Fm
in dark-acclimated leaves and the effective quantum yield ΔF/Fm′ was determined during light exposure. The
variable fluorescence (Fv) is the difference between the maximum (Fm) and the minimum (Fo) emission. Fo is the
fluorescence in darkness excited only by the pulse modulated measuring beam and Fm represents the maximum
fluorescence measured in darkness when all the photochemical quenching is suppressed (first electron acceptor
fully reduced) by a short saturating light pulse (0.8 s). Fm′ represents the maximum fluorescence under ambient
The variation in Fv/Fm along 2nd youngest leaves of the three species was determined at the same day of
sam-ple collection, by taking measurements every 3 cm along the leaf (n = 20 per species). Before measurements, the leaves were cleaned from epiphytes and dark-acclimated for 2 h. Based on these measurements, the “middle
section” of the 2nd youngest leaf was chosen as the most active section (highest F
v/Fm before decrease toward the
tip) for further experiments.
Non-photochemical quenching (NPQ) of Chla fluorescence was measured upon exposure to saturating light, provided by an LED lamp, in the three different leaf sections, which were previously dark-acclimated for 2 h before light exposure. The basal, middle and tip leaf sections (n = 6 per section and species) were exposed for 1 h
to 360 μmol quanta m−2 s−1, corresponding to ~3I
k to ensure maximal NPQ induction. The sections were
main-tained in a temperature-controlled chamber at 18 °C and NPQ was monitored by placing the PAM optic fibre at an angle of 60° in relation to the light exposed side of the sample, maintaining this optical geometry during all measurements. A saturating pulse was applied every minute and NPQ was calculated as:
= − ′ ′
NPQ (Fm F )/Fm m
At the end of the light exposure, the leaf sections were immediately flash-frozen in liquid nitrogen and kept at −80 °C until HPLC pigment analyses.
High-light response and recovery of ΔF/Fm′ of the different leaf sections to 1-h exposure to five different light
levels (45, 130, 260, 500, 700 μmol quanta m−2 s−1) and their subsequent recovery was measured. The light
expo-sure was provided by LED lamps at a constant temperature of 18 °C and Fv/Fm and ΔF/Fm′ were measured after
1 h dark acclimation before light exposure and 1 h after light exposure, respectively. Subsequently, the recovery of
ΔF/Fm′ was measured after 1 h in dim-light (10–15 μmol quanta m−2 s−1).
The dependence of NPQ on xanthophyll cycling was evaluated by using dithiothreitol (DTT, Sigma Aldrich),
which inhibits the de-epoxidation of violaxanthin to zeaxanthin42. The dependence of PSII photochemical
activity on D1 protein synthesis was evaluated using lincomycin (Sigma Aldrich) that inhibits the synthesis of
chloroplast-encoded proteins43.
The leaf sections were dark acclimated for 2 h and then incubated with either DTT (1 mM final concentration)
or lincomycin (3 mM final concentration) through gentle vacuum pumping17 and afterwards maintained in
dark-ness for another 30 min before the beginning of the experiment. To account for any effects of vacuum infiltration on leaf performance, control leaf sections were treated the same way, without the addition of an inhibitor.
HPLC pigment analyses.
Photosynthetic pigments were extracted as described in Abadía and Abadía44with some modifications. Frozen leaf tissue was powdered in liquid nitrogen and sodium ascorbate, and extracted
under low light with acetone 100% neutralized with CaCO3. Extracts were filtrated with 0.2 µm hydrophobic
PTFE. Pigments were analyzed by isocratic high performance liquid chromatography (HPLC)45,46 in an Alliance
Waters 2695 separation module (Milford MA, USA), with a Waters 2996 photodiode array detector and a Synergi Hydro-RP 80 Å Phenomenex 4.6 × 150 mm column (4 μm particle size) with security guard cartridges AQ C18 4 × 3.0 mm ID. Detection wavelength was set at 450 nm and pigment concentrations were calculated after calibra-tion with commercial pigment standards (CaroteNature, Lupsingen, Switzerland, Sigma-Aldrich).
The de-epoxidation state (DPS), which represents the proportion of the xanthophyll-cycle pigment pool (XC-pool) associated with the relative increment in antheraxanthin (Ant) and zeaxanthin (Zea) relative to
violax-anthin (Vio) was calculated as Zea + 0.5Ant/VAZ47. VAZ is the notation for the total XC-pool, which is the sum
of Vio, Ant, and Zea.
Leaf anatomy and microscopic assessment of chloroplast distribution in seagrass tissues.
Theleaf area displayed per unit dry mass invested (Specific Leaf Area- SLA, cm2 g−1 DW) was determined for each
leaf section and species from the samples used for P-I curves as variation in SLA may indicate differences in leaf anatomy, such as the quantity of sclerenchyma. It is a common descriptor in terrestrial plant ecology, but not com-monly used by seagrass ecologists, even though variations in SLA have been suggested to be of great importance to explain differences within and among species in the photoacclimatory leaf response24,48,49.
For the microscopic assessment of leaf anatomy, basal, middle and tip leaf segments of each species were fixed with “Kew” solution (40% seawater, 40% ethanol at 70%, 10% glycerin, 10% formalin (formol at 4%)). For determination of chloroplast distribution, histological cross sections were obtained, using a razor blade, and sub-sequently, the samples were photographed, using a laser scanning confocal microscope (Leica TCS SP-5, Wetzlar, Germany). Other samples, following dehydration by a series of aqueous ethanolic solutions, were infiltrated with
historesin (Leica Historesin, Heidelberg, Germany) and afterwards treated with Toluidine Blue O (TB-O)50 for
analysis of the general leaf anatomy.
A posteriori tests.
The three species differ greatly in their leaf growth rate and life span, with C. nodosa exhibiting the slowest growth rate and the longest life span, while Z. noltei leaves grow faster but have a muchshorter life span (Table 4). Leaf Area Index (LAI) has been reported to be highest for Z. marina (1.7–6.7 m2 leaf
area m−2 area), while LAI ranges for C. nodosa and Z. noltei are usually lower (0.2–3.5 and 0.2–1.9 m2 leaf area
m−2 area) (Table 4).
In order to assess the relationship between photoacclimation and life history strategies of the three seagrass
species, the mean leaf maximum photosynthetic capacity (Pmax) of each species was related to (1) the mean value
of leaf plastochron intervals (Table 4), i.e. the number of days it takes to produce a new leaf, and (2) the age of the different leaf sections of leaf 2 (L2), considered in this study (see above). The leaf age of each section was estimated by dividing the distance of each section from the meristem by the leaf elongation rate (LER). As there are no local field data of leaf elongation rates for all three species studied, LER was calculated, using the leaf length of leaf 2
differential expression of the responses to altered irradiance and spectral quality. Plant, Cell Environ. 21, 139–148 (1998). 3. Longstaff, B. J. & Dennison, W. C. Seagrass survival during pulsed turbidity events: the effects of light deprivation on the seagrasses
Halodule pinifolia and Halophila ovalis. Aquat. Bot. 65, 105–121 (1999).
4. Silva, J. & Santos, R. Daily variation patterns in seagrass photosynthesis along a vertical gradient. Mar. Ecol. Prog. Ser. 257, 37–44 (2003).
5. Larkum, A. W. D, Drew, E. A. & Ralph P. J. Photosynthesis and metabolism in seagrasses at the cellular level in Seagrasses: Biology,
ecology and conservation. (eds Larkum, A.W.D., Orth, R.J., Duarte, C.M.), 323–345 (Springer, 2006).
6. Campbell, S. J., McKenzie, L. J., Kerville, S. P. & Bité, J. S. Patterns in tropical seagrass photosynthesis in relation to light, depth and habitat. Est., Coast. Shelf Sci. 73, 551–562 (2007).
7. Ralph, P. J., Durako, M. J., Enríquez, S., Collier, C. J. & Doblin, M. A. Impact of light limitation in seagrasses. J. Exp. Mar. Biol. Ecol.
350, 176–193 (2007).
8. Silva, J., Barrote, I., Costa, M. M., Albano, S. & Santos, R. Physiological responses of Zostera marina and Cymodocea nodosa to light-limitation stress. PLoS ONE 8, e81058, https://doi.org/10.1371/journal.pone.0081058 (2013).
9. Procaccini, G. et al. Depth-specific fluctuations of gene expression and protein abundance modulate the photophysiology in the seagrass Posidonia oceanica. Sci. Rep. 7, 42890, https://doi.org/10.1038/srep42890 (2017).
10. Abal, E. G. et al. Physiological and morphological responses of the seagrass Zostera capricorni Aschers, to light intensity. J. Exp. Mar.
Biol. Ecol. 178, 113–129 (1994).
11. Cayabyab, N. M. & Enríquez, S. Leaf acclimatory responses of the tropical seagrass Thalassia testudinum under mesocosm conditions: a mechanistic scaling-up study. New Phytol. 176, 108–123 (2007).
12. Olivé, I., Vergara, J. J. & Pérez-Lloréns, J. L. Photosynthetic and morphological photoacclimation of the seagrass Cymodocea nodosa to season, depth and leaf position. Mar. Biol. 160, 285–297 (2013).
13. Park, S. R., Kim, S., Kim, Y. K., Kang, C.-K. & Lee, K.-S. Photoacclimatory responses of Zostera marina in the intertidal and subtidal zones. PLoS ONE 11, e0156214, https://doi.org/10.1371/journal.pone.0156214 (2016).
14. Dalla Via, J. et al. Light gradients and meadow structure in Posidonia oceanica: ecomorphological and functional correlates. Mar.
Ecol. Prog. Ser. 163, 267–278 (1998).
15. Enríquez, S. & Pantoja-Reyes, N. I. Form-function analysis of the effect of canopy morphology on leaf self-shading in the seagrass
Thalassia testudinum. Oecologia 145, 235–243 (2005).
16. Mazzella, L. & Alberte, R. S. Light adaptation and the role of autotrophic epiphytes in primary production of the temperate seagrass.
Zostera marina. J. Exp. Mar. Biol. Ecol. 100, 165–180 (1986).
17. Enríquez, S., Merino, M. & Iglesias-Prieto, R. Variations in the photosynthetic performance along the leaves of the tropical seagrass
Thalassia testudinum. Mar. Biol. 140, 891–900 (2002).
18. Short, F., Carruthers, T., Dennison, W. & Waycott, M. Global seagrass distribution and diversity: A bioregional model. J. Exp. Mar.
Biol. Ecol. 350, 3–20 (2007).
19. Dennison, W. C. & Alberte, R. S. Photoadaptation and growth of Zostera marina L. (eelgrass) transplants along a depth gradient. J.
Exp. Mar. Biol. Ecol. 98, 265–282 (1986).
20. Ruiz, J. M. & Romero, J. Effect of in situ experimental shading on the Mediterranean seagrass Posidonia oceanica. Mar. Ecol. Prog. Ser.
215, 107–120 (2001).
21. Dattolo, E. et al. Response of the seagrass Posidonia oceanica to different light environments: Insights from a combined molecular and photo-physiological study. Mar. Environ. Res. 101, 225–236 (2014).
22. Schubert, N., Colombo-Pallotta, M. F. & Enríquez, S. Leaf and canopy scale characterization of the photoprotective response to high-light stress of the seagrass Thalassia testudinum. Limnol. Oceanogr. 60, 286–302 (2015).
23. Olesen, B., Enríquez, S., Duarte, C. M. & Sand-Jensen, K. Depth-acclimation of photosynthesis, morphology and demography of
Posidonia oceanica and Cymodocea nodosa in the Spanish Mediterranean Sea. Mar. Ecol. Prog. Ser. 236, 89–97 (2002).
24. Enríquez, S. Light absorption efficiency and the package effect in the leaves of the seagrass Thalassia testudinum. Mar. Ecol. Prog. Ser.
289, 141–150 (2005).
25. Mazzella, L., Mauzerall, D., Lyman, H. & Alberte, R. S. Protoplast isolation and photosynthetic characteristics of Zostera marina L. (Eel Grass). Bot. Mar. 24, 285–289 (1981).
26. Kuo, J., Ridge, R. W. & Lewis, S. V. The leaf internal morphology and ultrastructure of Zostera muelleri Irmisch ex Aschers. (Zosteraceae): a comparative study of the intertidal and subtidal forms. Aquat. Bot. 36, 217–236 (1990).
27. Dawson, S. P. & Dennison, W. C. Effects of ultraviolet and photosynthetically active radiation on five seagrass species. Mar. Biol. 125, 629–638 (1996).
28. Haznedaroğlu, M. Z. & Akarsu, F. Anatomical features of Posidonia oceanica (L.) Delile growing in Turkey. Hacettepe Univ. J. Fac.
Pharm. 29, 37–43 (2009).
29. Macic, V. Anatomical features of Cymodocea nodosa growing in Montenegro (Adriatic Sea). J. Black Sea/Medit. Environ. 20, 253–263 (2014).
30. Cummings, M. E. & Zimmerman, R. C. Light harvesting and the package effect in the seagrasses Thalassia testudinum Banks ex König and Zostera marina L.: optical constraints on photoacclimation. Aquat. Bot. 75, 261–274 (2003).
31. Lichtenberg, M. & Kühl, M. Pronounced gradients of light, photosynthesis and O2 consumption in the tissue of the brown alga Fucus serratus. New Phytol. 207, 559–569 (2015).
32. Reich, P. B., Walters, M. B. & Ellsworth, D. S. Leaf-life span in relation to leaf, plant, and stand characteristics among diverse ecosystems. Ecol. Monogr. 62, 365–392 (1992).
33. Matsuki, S. & Koike, T. Comparison of leaf life span, photosynthesis and defensive traits across seven species of deciduous broad-leaf tree seedlings. Ann. Bot. 97, 813–817 (2006).
34. Dennison, W. C. & Alberte, R. S. Photosynthetic responses of Zostera marina L. (eegrass) to in situ manipulations of light intensity.
Oecologia 55, 137–144 (1982).
35. Buia, M.-C., Gambi, M. C. & Zupo, V. Structure and functioning of Mediterranean seagrass ecosystems: An overview. Biol. Mar.
Medit. 7, 167–190 (2000).
36. Dennison, W. Light adaptations of plants: A model based on the seagrass Zostera marina L. Master, University of Alaska (1979). 37. Silva, J., Santos, R., Calleja, M. L. I. & Duarte, C. M. Submerged versus air-exposed intertidal macrophyte productivity: from
physiological to community-level assessments. J. Exp. Mar. Biol. Ecol. 317, 87–95 (2005).
38. Durako, M. J. & Kunzelman, J. I. Photosynthetic characteristics of Thalassia testudinum measured in situ by pulse-amplitude modulated (PAM) fluorometry: methodological and scale-based considerations. Aquat. Bot. 73(2), 173–185 (2002).
39. Watson, D. J. Comparative physiological studies on the growth of field crops: I. Variation in net assimilation rate and leaf area between species and varieties, and within and between years. Ann. Bot. 11, 41–76 (1947).
40. Vásquez-Elizondo, R. M. et al. Absorptance determinations on multicellular tissues. Photosynth. Res. 132(3), 311–324 (2017). 41. van Kooten, O. & Snel, J. F. H. The use of chlorophyll fluorescence nomenclature in plant stress physiology. Photosynth. Res. 25,
147–150 (1990).
42. Yamamoto, H. Y. & Kamite, L. The effects of dithiothreitol on violaxanthin de-epoxidation and absorbance changes in the 500-nm region. Biochim. Biophys. Acta 267, 538–543 (1972).
43. Mulo, P., Pursiheimo, S., Hou, C. X., Tyystjärvi, T. & Aro, E. M. Multiple effects of antibiotics on chloroplast and nuclear gene expression. Funct. Plant Biol. 30(11), 1097–1103 (2003).
44. Abadía, J. & Abadía, A. Iron and plant pigments in Iron chelation in plants and soil microorganisms (eds Barton, L. L. & Hemming, B.), 327–343 (Academic Press Inc, 1993).
45. De las Rivas, J., Abadía, A. & Abadía, J. A new reversed phase-HPLC method resolving all major higher plant photosynthetic pigments. Plant Physiol. 91, 190–192 (1989).
46. Larbi, A., Abadía, A., Morales, F. & Abadía, J. Fe resupply to Fe-deficient sugar beet plants leads to rapid changes in the violaxanthin cycle and other photosynthetic characteristics without significant de novo chlorophyll synthesis. Photosynth. Res. 79, 59–69 (2004). 47. Casper-Lindley, C. & Björkman, O. Fluorescence quenching in four unicellular algae with different light-harvesting and
xanthophyll-cycle pigments. Photosynth. Res. 56, 277–289 (1998).
48. Enríquez, S., Agusti, S. & Duarte, C. M. Light absorption by marine macrophytes. Oecologia 98, 121–129 (1994).
49. Enríquez, S. & Sand-Jensen, K. Variation in light absorption properties of Mentha aquatica L. as a function of leaf form: implications for plant growth. Int. J. Plant Sci. 164, 125–136 (2003).
50. O’Brien, T. P., Feder, N. & McCully, M. Polychromatic staining of plant cell walls by Toluidine Blue O. Protoplasma 2, 367–373 (1964).
51. Tuya, F., Betancor, S., Fabbri, F., Espino, F. & Haroun, R. Photo-physiological performance and short-term acclimation of two coexisting macrophytes (Cymodocea nodosa and Caulerpa prolifera) with depth. Sci. Mar. 80, 247–259 (2016).
52. Sandoval-Gil, J. M., Ruiz, J. M., Marín-Guirao, L., Bernardeau-Esteller, J. & Sánchez-Lizaso, J. L. Ecophysiological plasticity of shallow and deep populations of the Mediterranean seagrass Posidonia oceanica and Cymodocea nodosa in response to hypersaline stress. Mar. Environ. Res. 95, 39–61 (2014).
53. Li, W.-T., Kim, S. H., Kim, J. W., Kim, J.-H. & Lee, K.-S. An examination of photoacclimatory responses of Zostera marina transplants along a depth gradient for transplant-site selection in a disturbed estuary. Est., Coast. Shelf Sci. 118, 72–79 (2013).
54. Backman, T. W. H. Genotypic and phenotypic variability of Zostera marina on the west coast of North America. Can. J. Bot. 69, 1361–1371 (1991).
55. Biber, P. D., Paerl, H. W., Gallegos, C. L. & Kenworthy, W. J. Evaluating indicators of seagrass stress to light in Estuarine indicators (ed. Bortone, S. A.), 193–209 (CRC Press, (2005).
56. Ochieng, C. A., Short, F. T. & Walker, D. L. Photosynthetic and morphological responses of eelgrass (Zostera marina L.) to a gradient of light conditions. J. Exp. Mar. Biol. Ecol. 382, 117–124 (2010).
57. Shafer, D. J. & Kaldy, J. E. Comparison of photosynthetic characteristics of the seagrass congeners Zostera marina L. and Zostera
japonica Aschers. and Graeb. Aquat. Bot. 112, 91–97 (2014).
58. Olivé, I., Brun, F. G., Vergara, J. J. & Pérez-Lloréns, J. L. Effects of light and biomass partitioning on growth, photosynthesis and carbohydrate content of the seagrass Zostera noltei Hornem. J. Exp. Mar. Biol. Ecol. 345, 90–100 (2007).
59. Villazán, B. et al. Flow velocity and light level drive non-linear response of seagrass Zostera noltei to ammonium enrichment. Mar.
Ecol. Prog. Ser. 545, 109–121 (2016).
60. Cabaço, S., Machás, R. & Santos, R. Individual and population plasticity of the seagrass Zostera noltei along a vertical intertidal gradient. Est., Coast. Shelf Sci. 82, 301–308 (2009).
61. De los Santos, C. B., Brun, F. G., Bouma, T. J., Vergara, J. J. & Pérez-Lloréns, J. L. Acclimation of seagrass Zostera noltei to co-occurring hydrodynamic and light stresses. Mar. Ecol. Prog. Ser. 398, 127–135 (2010).
62. Duarte, C. M. Allometric scaling of seagrass form and productivity. Mar. Ecol. Prog. Ser. 77, 289–300 (1991).
63. Borum, J. & Greve, T. M. The four European seagrass species in European seagrasses: an introduction to monitoring and management,
EU Project Monitoring and managing of European seagrasses (eds Borum, J., Duarte, C. M., Krause-Jensen, D. & Greve, T. M.), 1–7
(M&MS, 2004).
64. Silva, A.T. Effects of high CO2 and light quality on the growth of the seagrass Cymodocea nodosa (Ucria) Ascherson. Master thesis, University of Algarve, Faro, Portugal (2015).
65. Marbá, N., Cebrián, J., Enriquez, S. & Duarte, C. M. Growth patterns of Western Mediterranean seagrasses: species-specific responses to seasonal forcing. Mar. Ecol. Prog. Ser. 133, 203–215 (1996).
66. Alexandre, A., Silva, J., Buapet, P. & Santos, R. Effects of CO2 enrichment on photosynthesis, growth, and nitrogen metabolism of the seagrass Zostera noltei. Ecol. Evol. 2, 2620–2630 (2012).
67. Peralta, G., Brun, F. G., Hernández, I., Vergara, J. J. & Pérez-Lloréns, J. L. Morphometric variations as acclimation mechanisms in
Zostera noltei beds. Est., Coast. Shelf Sci. 64, 347–356 (2005).
68. Peralta, G. et al. Morphological and physiological differences between two morphotypes of Zostera noltei Hornem. from the south-western Iberian Peninsula. Helgol. Mar. Res. 54, 80–86 (2000).
69. Brun, F. G., Hernández, I., Vergara, J. J., Peralta, G. & Pérez-Lloréns, J. L. Assessing the toxicity of ammonium pulses to the survival and growth of Zostera noltei. Mar. Ecol. Prog. Ser. 225, 177–187 (2002).
70. Cunha, A. H. & Duarte, C. M. Population age structure and rhizome growth of Cymodocea nodosa in the Ria Formosa (southern Portugal). Mar. Biol. 146, 841–847 (2005).
71. Peralta, G., Bouma, T. J., van Soelen, J., Pérez-Lloréns, J. L. & Hernández, I. On the use of sediment fertilization for seagrass restoration: a mesocosm study on Zostera marina L. Aquat. Bot. 75, 95–110 (2003).
72. Curiel, D., Rismondo, A., Scarton, F. & Marzocchi, M. Growth and primary production of Cymodocea nodosa (Ucria) Ascherson and
Zostera marina L. in the Venice Lagoon (North Adriatic Sea). Plant Biosystem 130(1), 353–353 (1996).
73. Brun, F. G., Pérez-Pastor, A., Hernández, I., Vergara, J. J. & Pérez-Lloréns, J. L. Shoot organization in the seagrass Zostera noltei: implications for space occupation and plant architecture. Helgol. Mar. Res. 60, 59–69 (2006).
Open Access This article is licensed under a Creative Commons Attribution 4.0 International
License, which permits use, sharing, adaptation, distribution and reproduction in any medium or format, as long as you give appropriate credit to the original author(s) and the source, provide a link to the Cre-ative Commons license, and indicate if changes were made. The images or other third party material in this article are included in the article’s Creative Commons license, unless indicated otherwise in a credit line to the material. If material is not included in the article’s Creative Commons license and your intended use is not per-mitted by statutory regulation or exceeds the perper-mitted use, you will need to obtain permission directly from the
copyright holder. To view a copy of this license, visit http://creativecommons.org/licenses/by/4.0/.