Estimating gypsum equirement under no-till based on machine
learning technique
1Estimativa da necessidade de gesso em plantio direto baseada em técnica de
aprendizado de máquina
Alaine Margarete Guimarães2, Eduardo Fávero Caires3*, Karine Sato da Silva4 e José Carlos Ferreira da Rocha2
ABSTRACT -Chemical stratification occurs under no-till systems, including pH, considering that higher levels are formed from the soil surface towards the deeper layers. The subsoil acidity is a limiting factor of the yield. Gypsum has been suggested when subsoil acidity limits the crops root growth, i.e., when the calcium (Ca) level is low and/or the aluminum (Al) level is toxic in the subsoil layers. However, there are doubts about the more efficient methods to estimate the gypsum requirement. This study was carried out to develop numerical models to estimate the gypsum requirement in soils under no-till system by the use of Machine Learning techniques. Computational analyses of the dataset were made applying the M5’Rules algorithm, based on regression models. The dataset comprised of soil chemical properties collected from experiments under no-till that received gypsum rates on the soil surface, throughout eight years after the application, in Southern Brazil. The results showed that the numerical models generated by rule induction M5’Rules algorithm were positively useful contributing for estimate the gypsum requirements under no-till. The models showed that Ca saturation in the effective cation exchange capacity (ECEC) was a more important attribute than Al saturation to estimate gypsum requirement in no-till soils.
Key words:Rule induction. Calcium. Aluminum. Subsoil acidity. Phosphogypsum.
RESUMO -No sistema plantio direto ocorre estratificação química no perfil do solo, incluindo o pH, sendo que níveis mais altos são formados a partir da superfície do solo em direção às camadas mais profundas. A acidez do subsolo é um importante fator limitante da produção agrícola. O uso de gesso tem sido indicado quando a acidez do subsolo apresenta limitação para o crescimento radicular, ou seja, quando o teor de cálcio (Ca) é baixo e/ou o nível de alumínio (Al) é tóxico em camadas do subsolo. Entretanto, existem muitas dúvidas sobre os métodos mais apropriados para estimar a necessidade de gesso. Esse estudo foi realizado com o objetivo de desenvolver modelos numéricos, por meio de técnicas de aprendizado de máquina, para a estimativa da necessidade de gesso em solos sob plantio direto. Análises computacionais foram realizadas em um conjunto de dados, aplicando-se o algoritmo M5’Rules, baseado em modelos de regressão. Esses dados corresponderam aos atributos químicos de solos coletados de experimentos sob plantio direto que receberam doses de gesso na superfície, ao longo de até oito anos após a aplicação, na região Sul do Brasil. Os resultados mostraram que os modelos numéricos gerados pelo algoritmo M5’Rules foram de grande utilidade para estimar as doses de gesso a serem empregadas em plantio direto. Os modelos mostraram que a saturação por Ca na capacidade de troca de cations efetiva (CTCe) foi um atributo mais importante do que a saturação por Al para estimar a necessidade de gesso em solos sob plantio direto.
Palavras-chave:Indução de regras. Cálcio. Alumínio. Acidez do subsolo. Fosfogesso.
DOI: 10.5935/1806-6690.20150004 *Autor para correspondência
1Recebido para publicação em 02/12/2013; aprovado em 29/12/2014
Pesquisa financiada pelo CNPq
2Departamento de Informática, Área de Inteligência Computacional, Universidade Estadual de Ponta Grossa, Av. General Carlos Cavalcanti 4748,
Campus Uvaranas, Ponta Grossa-PR, Brasil, 84.030-900, alainemg@hotmail.com, jrocha@uepg.br
3Departamento de Ciência do Solo e Engenharia Agricola, Universidade Estadual de Ponta Grossa, Ponta Grossa-PR, Brasil, Bolsista de
Produtividade em Pesquisa do CNPq, efcaires@hotmail.com
4Programa de Pós-Graduação em Computação Aplicada, Universidade Estadual de Ponta Grossa, Ponta Grossa-PR, Brasil, 84.030-900, karine.sato.
INTRODUCTION
No-till (NT) systems with diversified crop rotations have stood out as one of the most effective strategies to improve the sustainability of agriculture in tropical and subtropical regions (HOBBS; SAYRE; GUPTA, 2008). Long-term NT systems are known to cause chemical stratification, including pH, where high pH levels are formed in the upper few inches of the soil profile. Subsoil acidity is an important yield-limiting factor (CAIRESet al., 2008; DALLA NORA; AMADO, 2013; TANGet al., 2003).
Gypsum, a by-product of the phosphoric acid industry, mainly contains calcium sulfate and small amounts of P and F and is largely available in many parts of the world. In Brazil, approximately 4.8 Tg are produced each year (RAIJ, 2008). When applied to the soil surface, gypsum moves down the profile during drainage, resulting in increases in the Ca supply and a reduction in toxic levels of Al. As a result, better root growth, increased uptake of water and nutrients by plants roots and higher crop yields have been observed (BLUM; CAIRES; ALLEONI, 2013; DALLA NORA; AMADO, 2013; SORATTO; CRUSCIOL, 2008).
Gypsum application in Brazilian soils has been recommended when exchangeable Ca content is lower than 4 mmolc dm-3 (RAIJet al., 1996; RIBEIRO; GUIMARÃES; ALVAREZ, 1999) or 5 mmolc dm-3 (SOUSA; LOBATO, 2002), exchangeable Al content is higher than 5 mmolc dm-3 (RIBEIRO; GUIMARÃES; ALVAREZ, 1999), and/or Al saturation is higher than 20% (SOUSA; LOBATO, 2002), 30% (RIBEIRO; GUIMARÃES; ALVAREZ, 1999), or 40% (RAIJet al., 1996) in subsurface layers (20-40 or 30-50 cm). Although reasonable, these Ca and Al levels considered critical to the root growth were based on few studies, and little is known about the benefits of using gypsum in NT soils that have no such limitations in deep layers. In a recent study (CAIRESet al., 2011a), the use of gypsum showed economic viability to maximize crop grain production in a long-term NT soil with a sufficient level of exchangeable Ca ( 8 mmolc dm-3) and low levels of exchangeable Al ( 4 mmolc dm-3) and Al saturation ( 15%) in the subsoil layers (20–60 cm).
A consequence of gypsum application to soils is the displacement of other cation on the exchange complex. Consequently, exchangeable Mg and K leaching have often been observed in the studies with gypsum application (CAIRESet al., 2011a,b). The leaching of Mg after gypsum application can be beneficial for Ca and K plant nutrition and crop yield, when the soil has elevated Mg levels and a low Ca/Mg ratio in the most superficial layers (CAIRES; FELDHAUS; BLUM, 2001; CAIRESet al., 2004).
Considering the doubts still exist about the most appropriate methods for estimating the gypsum requirement (GR) (RAIJ, 2008), it is possible that such
estimate can be made by techniques of Machine Learning (ML), that are able to learn about facts and data, and handle new situations using reasoning and generalization.
ML can be used for pattern recognition with different purposes, including for predicting continuous numeric values. Considering the positive results obtained from the use of ML techniques in agronomy (GUIMARÃES; CATANEO; ZAZUETA, 2007; MEIRA; ROGRIGUES; MORAES, 2008), we hypothesize that is possible to develop numerical models to estimate GR in NT soils by the use of the M5’Rules algorithm (HOLMES; HALL; FRANK, 1999), which is based on the ML concepts.
MATERIAL AND METHODS
Sites Description
The study was performed in three field sites located in the Center-South region of Parana State, Brazil. The first site, here named site A, is located in Ponta Grossa (25°8´ S, 50°15´ W, and average altitude of 853 m), on a loamy Typic Hapludox (295 g kg-1 of clay) with high acidity. Prior to the establishment of the experiment, the field site had been used under NT cultivation during 15 years. Table 1 shows results of soil chemical analyses for different depths before the establishment of the experiment. Gypsum at the rates of 0, 4, 8, and 12 t ha-1were broadcast on the soil surface in 1993 and a randomized complete block design was used, with three replications. Plot size was 50.4 m2 (8.0 × 6.3 m). Samples of soil were taken at 0–10, 10–20, 20–40, and 40–60 cm depths at 8, 20, 32, 44, and 56 months after gypsum application.
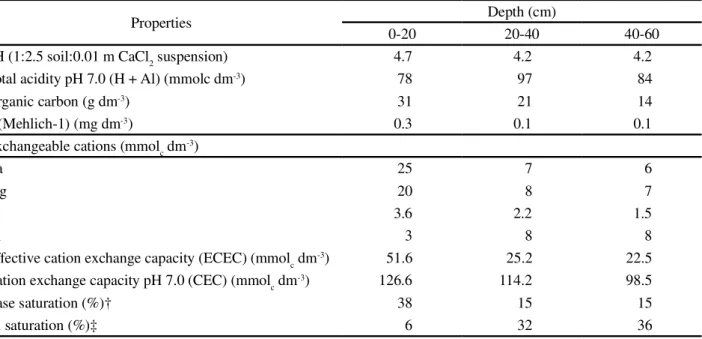
The second site, named site B, also is located in Ponta Grossa (25°10´ S, 50°05´ W, and average altitude of 970 m), on a clayey Rhodic Hapludox (580 g kg-1 of clay) with medium acidity, previously used for pasture. Table 2 shows results of soil chemical analyses for different depths before the establishment of the experiment. Gypsum at the rates of 0, 3, 6, and 9 t ha-1were broadcast on the soil surface in 1998 and a randomized complete block design was used, with three replications. Plot size was 56.0 m2 (8.0 × 7.0 m). Samples of soil were taken at 0-10, 10-20, 20-40, and 40-60 cm depths at 8, 20, 32, 44, 56, 68, 80, and 92 months after gypsum application.
Table 1 -Results of soil chemical analyses for different depths before the establishment of the experiment at site A
† Base saturation = 100 (Ca + Mg + K/CEC pH 7.0).‡ Al saturation = 100 (Al/ECEC)
Properties Depth (cm)
0-20 20-40 40-60
pH (1:2.5 soil:0.01 m CaCl2suspension) 4.5 4.4 4.4
Total acidity pH 7.0 (H + Al) (mmolc dm-3) 58 58 50
Organic carbon (g dm-3) 19 18 16
P (Mehlich-1) (mg dm-3) 9.0 4.0 2.0
Exchangeable cations (mmol(+) dm-3)
Ca 16 16 16
Mg 10 10 9
K 1.4 1.5 1.5
Al 6 6 6
Effective cation exchange capacity (ECEC) (mmolc dm-3) 33.4 33.5 32.5
Cation exchange capacity pH 7.0 (CEC) (mmolc dm-3) 85.4 85.5 76.5
Base saturation (%)† 32 32 35
Al saturation (%)‡ 18 18 18
Table 2 -Results of soil chemical analyses for different depths before the establishment of the experiment at site B
† Base saturation = 100 (Ca + Mg + K/CEC pH 7.0).‡ Al saturation = 100 (Al/ECEC)
Properties Depth (cm)
0-20 20-40 40-60
pH (1:2.5 soil:0.01 m CaCl2 suspension) 4.7 4.2 4.2
Total acidity pH 7.0 (H + Al) (mmolc dm-3) 78 97 84
Organic carbon (g dm-3) 31 21 14
P (Mehlich-1) (mg dm-3) 0.3 0.1 0.1
Exchangeable cations (mmolc dm-3)
Ca 25 7 6
Mg 20 8 7
K 3.6 2.2 1.5
Al 3 8 8
Effective cation exchange capacity (ECEC) (mmolc dm-3) 51.6 25.2 22.5
Cation exchange capacity pH 7.0 (CEC) (mmolc dm-3) 126.6 114.2 98.5
Base saturation (%)† 38 15 15
Al saturation (%)‡ 6 32 36
on the soil surface in 2005 and a randomized complete block design was used, with four replications. Plot size was 49.0 m2 (7.0 × 7.0 m). Samples of soil were taken at 0-10, 10-20, 20-40, and 40-60 cm depths, at 8, 20 and 32 months after gypsum application.
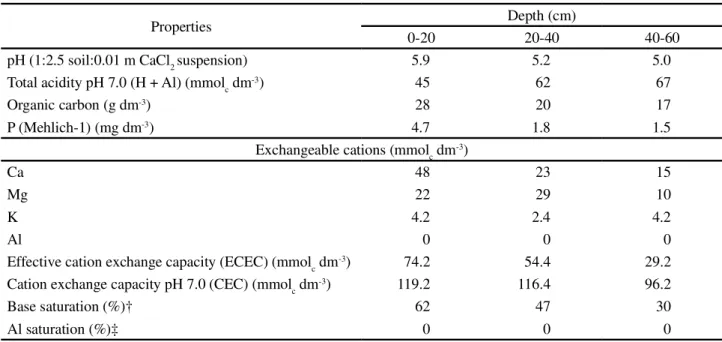
Table 3 -Results of soil chemical analyses for different depths before the establishment of the experiment at site C
Properties Depth (cm)
0-20 20-40 40-60
pH (1:2.5 soil:0.01 m CaCl2suspension) 5.9 5.2 5.0
Total acidity pH 7.0 (H + Al) (mmolc dm-3) 45 62 67
Organic carbon (g dm-3) 28 20 17
P (Mehlich-1) (mg dm-3) 4.7 1.8 1.5
Exchangeable cations (mmolc dm-3)
Ca 48 23 15
Mg 22 29 10
K 4.2 2.4 4.2
Al 0 0 0
Effective cation exchange capacity (ECEC) (mmolc dm-3) 74.2 54.4 29.2
Cation exchange capacity pH 7.0 (CEC) (mmolc dm-3) 119.2 116.4 96.2
Base saturation (%)† 62 47 30
Al saturation (%)‡ 0 0 0
† Base saturation = 100 (Ca + Mg + K/CEC pH 7.0).‡ Al saturation = 100 (Al/ECEC)
of the hottest month is not higher than 22 °C. The average annual rainfall is 1600 mm, with rainfall concentrated between the September to April months.
The three field sites were cultivated under NT with crop rotation. Maize (Zea mays L.) or soybean (Glycine max L. Merril) were sown during the spring-summer seasons, and black oat (Avena strigosaSchreb.) or wheat (Triticum aestivum L.) or barley (Hordeum vulgareL.) in autumn-winter season. According to the crops requirements and nutrients levels in the soil fertilizers were applied, as recommended for the Paraná State. More details about the experimental sites and the effects of gypsum application on crop grain yields are reported in Caireset al. (1999); Caires; Feldhaus; Blum, (2001); Caires et al. (2002, 2004, 2011b).
For the soil samples taken in the three experimental sites, the exchangeable Al, Ca, Mg and K contents were determined according to the standard methods adopted by the Agronomic Institute of Parana (PAVANet al., 1992). The effective cation exchange capacity (ECEC) was calculated by summing the exchangeable cations (Al + Ca + Mg + K) and the Al, Ca, Mg and K saturation in ECEC was calculated according to the equations: Al saturation (%) [m = 100 (Al/ECEC)], Ca saturation (%) [CaSat = 100 (Ca/ ECEC)], Mg saturation (%) [MgSat = 100 (Mg/ECEC)], and K saturation (%) [KSat = 100 (K/ECEC)].
The number of observations of Al, Ca, Mg, and K contents and saturation at the different soil depths throughout the period of the experiments were 240, 384, and 192, respectively at A, B, and C sites.
Data Analysis Method
The data analysis was made using ML techniques, and the M5’Rules algorithm implemented in the software Weka (WITTEN; FRANK; HALL, 2011) was adopted. This model tree induction algorithm for predicting numeric values presents a better performance when compared to others (DUGGAL; SINGH, 2012) and is based on regression models. Therefore, each leaf node of the tree structure has a regression model called rule. In this study, each regression model (rule) estimated the GR considering the Al, Ca, Mg and K saturation. The selection of the best rules of GR estimative, in t ha-1, was established considering the correlation coefficient, relative absolute error, root relative squared error and total of instances covered by the rule, that represent the confidence level of the rule. In this way, the use of M5’Rules algorithm is considered an effective alternative to data analysis as soon as it uses strong statistics concepts and well known ML techniques.
RESULTS AND DISCUSSION
Site A
observed that the GR estimative was affected by the sampling time and the Ca saturation (r = 0.55) at 20-40 and 40-60 cm depths (Table 4, R1). GR estimative was not better when the Al saturation (m) was considered at 20-40 cm (r = 0.46) (Table 4, R2) and 40-60 cm (r = 0.36) (Table 4, R3) depths, and the same occurred when the CaSat and the m in all of the studied depths were considered (r = 0.43) (Table 4, R4). Even with the time interference after gypsum addition to estimate GR, these results showed that the Ca saturation in the subsoil (20-40 and 40-60 cm) was a more adequate attribute to estimate GR than Al saturation, alone or in combination with the Ca saturation.
With increasing gypsum rates leaching of Mg and K exchangeable in the soil can occur (CAIRESet al., 2011a,b). So, it would be expected a negative correlation between GR andMgSat andKSat values, mainly in the soil surface layers. In fact, the analysis performed during the period from 2004 to 2008 revealed thatMgSat at 0-10 and 10-20 cm depths was negatively correlated (r = 0.42) with GR (Table 4, R5). ForKSat the correlation obtained was much lower (r = 0.30) (Table 4, R6), showing greater influence of the gypsum addition in leaching of exchangeable Mg than exchangeable K, which is in agreement with the results obtained in other studies with gypsum (CAIRESet al., 2011a,b; ZAMBROSI; ALLEONI; CAIRES, 2007).
Because the sampling time affects the estimated results due to the long-term evaluation, the instances analysis was performed only for instances of the first three sampling time (8, 20, and 32 months), in all soil profiles (0-60 cm). For theCaSat, a rule generated for estimating GR (Table 4, R7) presented a little better correlation (r = 0.57) related to all the evaluation period. For the Al saturation values, it was observed that the rule generated for estimating GR showed a better correlation (r = 0.59) having proved influence of the m values at 40-60 cm depth (Table 4, R8). The correlations to the rules generated as a function of
Table 4 -Rules generated to estimate gypsum rate based on site A dataset
Rule Number Rule generated to estimate gypsum rate (GR) r
R1 GR = 0.0679 × time + 0.1485 × CaSat20–40 + 0.1406 × CaSat40–60 – 10.2964 0.55
R2 GR = – 0.0605 × time – 0.3843 × m20-40 0.46
R3 GR = – 0.3735 × m40-60 + 11.961 0.36
R4 IF CaSat10-20> 38.4 THEN GR = 0.0439 × time + 0.0923 × CaSat0-10 + 0.3605 × m0-10 - 0.2731 × m20-40 + 0.7826 0.43 R5 GR = 0.0638 × time – 0.2176 × MgSat0–10 – 0.169 × MgSat10–20 + 13.5279 0.42 R6 GR = 0.0657 × time – 1.7082 × KSat0–10+ 1.999 × KSat10–20 – 1.5917 × KSat20–40 + 10.1414 0.30
R7 GR = 0.1447 × CaSat20–40 + 0.1547 × CaSat40–60 – 9.6337 0.57
R8 GR = –0.4525 × m40–60 + 12.4407 0.59
R9 GR = – 0.2113 × MgSat0–10 – 0.1817 × MgSat10–20+ 14.9369 0.38
R10 GR = – 2.4496 × KSat20-40 + 11.3565 0.26
MgSat (r = 0.38) (Table 4, R9) and KSat (r = 0.26) (Table 4, R10) were not better than those observed throughout the evaluation period.
The higher maize grain yield in this soil was obtained after gypsum application at 9.5 t ha-1 (CAIRES et al., 1999), in the second evaluation time (20 months). Considering the best rules generated, the GR of 9.5 t ha-1 it would be obtained for Ca saturation in the ECEC of 64% at 20-40 and 40-60 cm depths (Table 4, R1 and R7) and for Al saturation of 6.5% at the 40-60 cm depth (Table 4, R8). Thus, the maximum maize grain yield should have been achieved for Ca saturation of 64% or Al saturation of 6.5% in the subsoil. It is noteworthy that the use of gypsum showed economic viability to maximize crop grain yield in a NT soil presenting low levels of Al saturation ( 15%) in the subsurface layers (20-60 cm) (CAIRES et al., 2011a), in agreement with the results obtained in this study. Since the generated rules admit other possibilities of Ca saturation at 20-40 and 40-60 cm layers for obtaining GR resulting in the maximum maize yield (9.5 t ha-1), they could serve as alternatives to estimate GR.
Site B
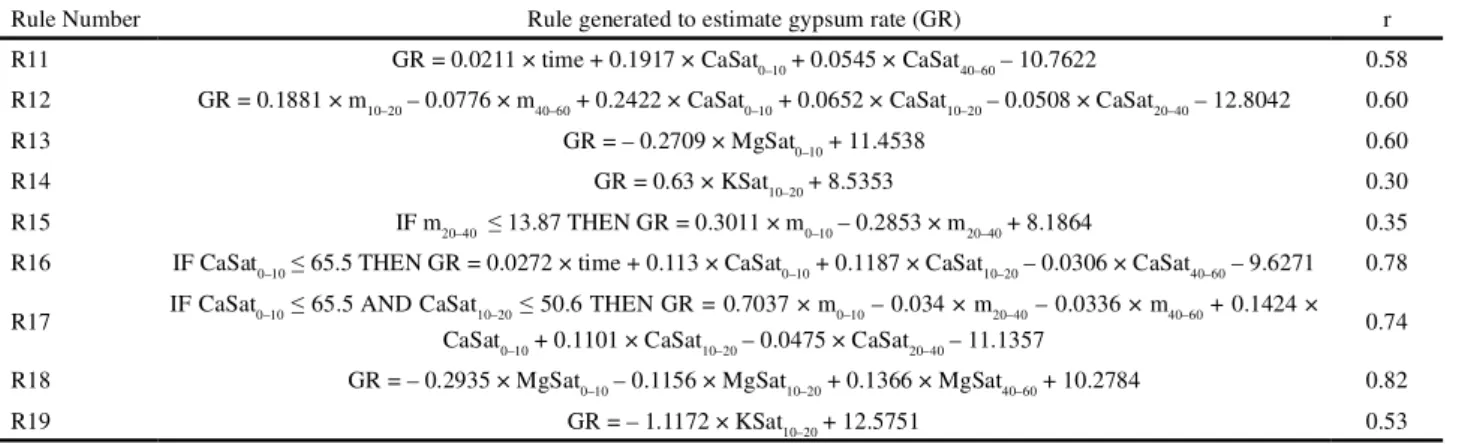
The analysis of all instances in the eight sampling time (8, 20, 32, 44, 56, 68, 80, and 92 months after gypsum application), during the period from 1999 to 2006 did not generate efficient rules, similar to that happened in the site A. Becoming alone the Ca saturation (CaSat) and considering all the soil profiles (0-60 cm), during the same evaluation period, it was found that GR was influenced by the sampling time and the Ca saturation (r = 0.58) at 0-10 and 40-60 cm depths (Table 5, R11).
(Table 5, R12). These results suggest the Ca saturation in the ECEC in both topsoil (0-10 cm) and subsoil (40-60 cm) affects the GR estimative and the combination ofCaSat with mcauses little amelioration in the correlation.
Because the gypsum application can cause leaching of exchangeable cations in the soil (CAIRESet al., 2011a,b), it was observed a negative correlation (r = 0.60) between the GR and theMgSat at 0-10 cm depth (Table 5, R13), considering all the evaluated period (1999 to 2006). According to it was observed also to the site A, the correlation obtained to theKSat was low (r = 0.30) (Table 5, R14), showing the less influence of the gypsum addition in the leaching of K exchangeable than Mg exchangeable in the soil (CAIRESet al., 2011a,b; ZAMBROSI; ALLEONI; CAIRES, 2007).
When the analysis of the instances was performed only for the three first sampling time (8, 20, and 32 months), in all soil profiles (0-60 cm), the generated rule for estimating the GR by the Al saturation (m) continued to have low correlation (r = 0.35) (Table 5, R15) and could be applied only when m20–40was 13.87%, but it was observed an improvement of the correlations obtained with theCaSat and by combining of CaSat andm. For theCaSat, the generated rule for estimating GR (Table 5, R16) presented a higher correlation coefficient (r = 0.78), but proved to be valid only forCaSat 65.5% at the 0-10 cm depth. The combined analysis of theCaSat and m data for estimating GR also indicated high correlation (r = 0.74) and smallest error, but for a specific condition of CaSat 65.5% at the 0-10 cm depth andCaSat 50.6% at the 10-20 cm depth (Table 5, R17). Despite the increase in correlation coefficients and decrease in error, the specificity of the conditions generated for the application of such rules imposes serious constraints for the GR estimation.
The GR estimated based on the MgSat (Table 5, R18) had high correlation (r = 0.82), showing that, in that evaluation period (8, 20, and 32 months), increasing the gypsum rates resulted in lower values ofMgSat at the 0-10 and 10-20 cm depths, and higher at the 40-60 cm depth.
Table 5 -Rules generated to estimate gypsum rate based on site B dataset
Rule Number Rule generated to estimate gypsum rate (GR) r
R11 GR = 0.0211 × time + 0.1917 × CaSat0–10 + 0.0545 × CaSat40–60 – 10.7622 0.58 R12 GR = 0.1881 × m10–20 – 0.0776 × m40–60 + 0.2422 × CaSat0–10 + 0.0652 × CaSat10–20 – 0.0508 × CaSat20–40 – 12.8042 0.60
R13 GR = – 0.2709 × MgSat0–10 + 11.4538 0.60
R14 GR = 0.63 × KSat10–20 + 8.5353 0.30
R15 IF m20–40 13.87 THEN GR = 0.3011 × m0–10 – 0.2853 × m20–40 + 8.1864 0.35
R16 IF CaSat0–10 65.5 THEN GR = 0.0272 × time + 0.113 × CaSat0–10 + 0.1187 × CaSat10–20 – 0.0306 × CaSat40–60 – 9.6271 0.78 R17 IF CaSat0–10 65.5 AND CaSat10–20 50.6 THEN GR = 0.7037 × m0–10 – 0.034 × m20–40 – 0.0336 × m40–60 + 0.1424 ×
CaSat0–10 + 0.1101 × CaSat10–20 – 0.0475 × CaSat20–40 – 11.1357 0.74 R18 GR = – 0.2935 × MgSat0–10 – 0.1156 × MgSat10–20 + 0.1366 × MgSat40–60 + 10.2784 0.82
R19 GR = – 1.1172 × KSat10–20 + 12.5751 0.53
Related to theKSat, the correlation coefficient of the rule (Table 5, R19) was slightly higher (r = 0.53), but even lower than that observed to theMgSat.
The higher grain yields of barley (CAIRES; FELDHAUS; BLUM, 2001), wheat (CAIRESet al., 2002), and maize (CAIRESet al., 2004) in this soil was obtained after gypsum application at 9.0, 8.2, and 9.0 t ha-1, respectively, in the first, second and third evaluation time. Considering the generated rule for CaSat during all the evaluation period, which has no a specific condition for its application (Table 5, R11), it is observed the GR from 8.2 to 9.0 t ha-1 in this period would be obtained for Ca saturation in the ECEC of about 85% at the 0-10 cm depth and about 64% at the 40–60 cm depth.
Whereas the inclusion of Al saturation has not resulted in a closest correlation, these results suggest that the values of Ca saturation in the ECEC of the surface (0–10 cm) and subsurface (40-60 cm) layers could be good indicators of the estimate GR. Since the generated rules admit to other possibilities for obtaining GR resulting in the higher crop grain yields (8.2 to 9.0 t ha-1), they could serve as alternatives to assist in defining the GR.
Site C
layers, there was no change of the rule generated for the Ca saturation when Al saturation was included in the analysis.
The GR estimative was correlated (r = 0.69) with the sampling time and the Mg saturation at 0-10 and 10-20 cm depths (Table 6, R22), during the period from 2006 to 2008. According to the rule, higher GR would correspond to lower Mg saturation values at 0-10 and 10-20 cm depths. This effect results of leaching of exchangeable Mg that occurs in soil after gypsum addition (CAIRES et al., 2011a,b). The influence of the sampling time, in this case, shows the leaching of exchangeable Mg after gypsum application continued occurring during the evaluated period, further reducing the Mg saturation at 0-10 and 10-20 cm depths.
Related to the K saturation, the generated rule for the GR estimative (Table 6, R23) showed to be valid (r = 0.60) only for the case of the K saturation 4.15% at the 20-40 cm depth. In any case, the rule indicates that higher GR correspond to smaller values of K saturation, particularly in the soil surface layer (0-10 cm), which would be related to the leaching of exchangeable K in the soil due to the application of gypsum (CAIRESet al., 2011b).
The higher maize grain yield in this soil was obtained after gypsum application at 7.8 t ha-1(CAIRES et al., 2011b), in the first evaluation time. Considering the generated rule based on the Ca saturation during the period from 2006 to 2008 (Table 6, R21), it is noted the GR of 7.8 t ha-1 would be obtained for Ca saturation in the ECEC about 80% at the 0-10 cm depth, and 70% at the 10-20 cm depth. The rule admits to other possibilities of Ca saturation at 0-10 and 10-20 cm depths to obtain the
Table 6 -Rules generated to estimate gypsum rate based on site C dataset
Rule Number Rule generated to estimate gypsum rate (GR) r
R20 GR = 0.2645 × CaSat0–10 + 0.1104 × CaSat10–20 – 1.1456 × KSat0–10– 17.5001 0.76
R21 GR = 0.3108 × CaSat0–10 + 0.1181 × CaSat10–20 – 25.4056 0.74
R22 GR = – 0.0748 × time – 0.2782 × MgSat0–10 – 0.191 × MgSat10–20 + 18.8598 0.69
R23 IF KSat20–40 4.15 THEN GR = – 2.5294 × KSat0–10– 0.6626 × KSat20–40 + 17.6311 0.60
GR that resulted in the higher maize grain yield (7.8 t ha-1), but it is clear the Ca saturation in the surface layers is an important component for GR estimative in soil that does not present problems related to Al toxicity in the profile. In other study performed under a NT it was verified the economic viability of using gypsum to maximize production of grain crops in a soil with Ca saturation in the ECEC values ranging from 59 to 67%, at the 0-10 cm depth, and from 47 to 57%, at the 10-20 cm depth (CAIRES et al., 2011a), which agrees with the results obtained in this study.
Sites A, B, and C
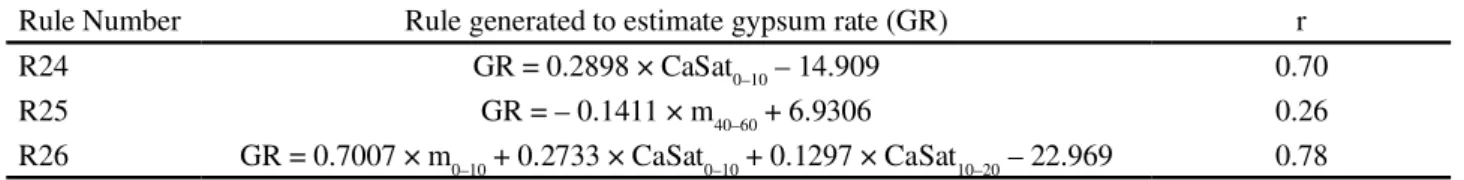
The joint analysis of all instances in the three sites (A, B, and C), considering the first three times (8, 20, and 32 months after gypsum application) and the four sampling depths (0-10, 10-20, 20-40, and 40-60 cm), showed the generated rules based on the Ca saturation in the ECEC and the Al saturation (m) were the ones that showed the closest correlation with the GR estimative (Table 7). Even considering all depths of the soil profile (0-60 cm), the rule generated for the GR estimative showed a strong correlation (r = 0.70) with the Ca saturation only at the 0-10 cm depth (Table 7, R24).
The generated rule considering only Al saturation (m) was related to them value at the 40-60 cm depth (Table 7, R25), but the correlation was very weak (r = 0.26). When the possibility of combining the Ca saturation and Al saturation (m) was considered, the generated rule presented strong correlation (r = 0.78) with m at the 0-10 cm depth and Ca saturation at 0-10 and 10-20 cm depths (Table 7, R26). Certainly because the higher soil acidity of the sites A and B compared to the site C the rule presented relation withm in the soil surface layer (0-10 cm). Because the problems
Table 7 -Rules generated to estimate gypsum rate based on sites A, B, and C dataset
Rule Number Rule generated to estimate gypsum rate (GR) r
R24 GR = 0.2898 × CaSat0–10 – 14.909 0.70
R25 GR = – 0.1411 × m40–60 + 6.9306 0.26
related to the presence of Al in the soil surface layer are easily corrected by applying lime, it is evident the importance of the Ca saturation in the soil surface layers to estimate GR when the soil acidity is corrected by liming.
For the three studied sites the higher grain yields of maize, wheat or barley occurred with GR ranging from 7.8 to 9.5 t ha-1 (CAIRESet al., 1999; CAIRES; FELDHAUS; BLUM, 2001; CAIRES et al., 2002, 2004, 2011b). Since the GR was strongly correlated with the Ca saturation in the ECEC at the 0-10 cm layer (Table 7, R24), it is possible that the higher crop grain yields under NT systems would be obtained with Ca saturation in the ECEC values in the soil surface layer (0-10 cm) ranging from 78 to 84%.
CONCLUSIONS
1. The regression models generated by rule induction M5’Rules algorithm were positively useful contributing for determining gypsum requirement to be used in NT soils. 2. The models showed that Ca saturation in the ECEC was
a more important attribute than Al saturation to estimate gypsum requirement in NT soils.
REFERENCES
BLUM, S. C.; CAIRES, E. F.; ALLEONI, L. R. F. Lime and phosphogypsum application and sulfate retention in subtropical soils under no-till system.Journal of Soil Science and Plant Nutrition, v. 13, n. 2, p. 279-300, 2013.
CAIRES, E. F.et al. Produção de milho, trigo e soja em função das alterações das características químicas do solo pela aplicação de calcário e gesso na superfície, em sistema de plantio direto.Revista Brasileira de Ciência do Solo, v. 23, n. 2, p. 315-327, 1999. CAIRES, E. F.; FELDHAUS, I. C.; BLUM, J. Crescimento radicular e nutrição da cevada em função da calagem e aplicação de gesso.Bragantia, v. 60, n. 2, p. 213-223, 2001.
CAIRES, E. F.et al. Lime and gypsum application on the wheat crop.Scientia Agricola, v. 59, n. 2, p. 357-364, 2002.
CAIRES, E. F.et al. Alterações químicas do solo e resposta do milho à calagem e aplicação de gesso. Revista Brasileira de Ciência do Solo, v. 28, n. 1, p. 125-136, 2004.
CAIRES, E. F.et al. Effects of soil acidity amelioration by surface liming on no-till corn, soybean, and wheat root growth and yield.
European Journal of Agronomy, v. 28, n. 1, p. 57-64, 2008.
CAIRES, E. F.et al. Use of gypsum for crop grain production under a subtropical no-till cropping system. Agronomy Journal, v. 103, n. 6, p. 1804-1814, 2011a.
CAIRES, E. F. et al. Surface application of gypsum in low acidic Oxisol under no-till cropping system.Scientia Agricola, v. 68, n. 2, p. 209-216, 2011b.
DALLA NORA, D.; AMADO, T. J. C. Improvement in chemical attributes of Oxisol subsoil and crop yields under no-till.
Agronomy Journal, v. 105, n. 5, p. 1393-1403, 2013.
DUGGAL, H; SINGH, P. Comparative study of the performance of M5-Rules algorithm with different algorithms.Journal of Software Engineering and Applications, v. 5, n. 4, p. 270-276, 2012. GUIMARÃES, A. M.; CATANEO, A.; ZAZUETA, F. Aplicação de computação evolucionária na mineração de dados físico-químicos da água e do solo.Energia na Agricultura, v. 22, n. 1, p. 1-16, 2007. HOBBS, P. R.; SAYRE, K.; GUPTA, R. The role of conservation agriculture in sustainable agriculture.Philosophical Transactions of the Royal Society B, v. 363, n. 1491, p. 543-555, 2008. HOLMES, G.; HALL, M.; FRANK, E. Generating rule sets from model trees. In: FOO, N. (Ed.). Advanced Topics in Artificial Intelligence. Proceedings of the 12 th Australian Joint Conference on Artificial Intelligence. Sydney: Springer, 1999. p. 1-12.
MEIRA, C. A. A.; ROGRIGUES, L. H. A.; MORAES, S. A. Análise da epidemia da ferrugem do cafeeiro com árvore de decisão.Tropical Plant Pathology, v. 33, n. 2, p. 114-124, 2008.
PAVAN, M. A.et al. Manual de análise química do solo e controle de qualidade. Londrina: Instituto Agronômico do Paraná, 1992. 38 p. (IAPAR. Circular 76)
PEEL, M. C.; FINLAYSON, B. L.; MCMAHON, T. A. Update world map of the Köppen-Geiger climate classification.Hydrology and Earth System Sciences, v. 11, n. 5, p. 1633-1644, 2007. RAIJ, B. Van. Gesso na agricultura. Campinas: Instituto Agronômico, 2008. 233 p.
RAIJ, B. Van et al. Recomendações de adubação e calagem para o Estado de São Paulo. Campinas: Instituto Agronômico, 1996. 285 p.
RIBEIRO, A. C.; GUIMARÃES, P. T. G.; ALVAREZ, V. V. H. Recomendação para o uso de corretivos e fertilizantes em Minas Gerais:5ª aproximação. Viçosa, MG: Comissão de Fertilidade do Solo do Estado de Minas Gerais, 1999. 359 p. SORATTO, R.P.; CRUSCIOL, C. Dolomite and phosphogypsum surface application effects on annual crops nutrition and yield.
Agronomy Journal, v. 100, n. 2, p. 261-269, 2008.
SOUSA, D. M. G.; LOBATO, E. Correção da acidez do solo.In: SOUSA, D. M. G.; LOBATO, E. (Ed.).Cerrado:correção do solo e
adubação. Planaltina, DF: Embrapa Cerrados, 2002. p. 81-96. TANG, C.et al. Responses of wheat and barley to liming on a sandy soil with subsoil acidity.Field Crops Research, v. 80,
n. 3, p. 235-244, 2003.
WITTEN, I. H.; FRANK, E.; HALL, M. A. Data Mining:
practical machine learning tools and techniques. 3rd. ed. San Francisco: Morgan Kaufmann, 2011. 629 p.