ABSTRACT
RESUMO
Produção de minitubérculos de batata-semente básica em substrato
em razão de doses de nitrogênio
A dose ótima de nitrogênio (N) na cultura da batata depende do sistema de produção. O objetivo deste trabalho foi determinar a dose ótima de N para a produção de minitubérculos de batata-semente básica e avaliar o efeito de doses de N sobre índices nitrogenados e fisiológicos determinados na folha mais jovem completamente desenvolvida (quarta folha) e na folha mais velha da planta, aos 60 dias após o plantio. O experimento foi realizado em ambiente protegido, no Departamento de Fitotecnia da Universidade Federal de Viçosa. Os tratamentos foram constituídos por cinco doses de N (0, 45, 90, 180 e 360 mg dm-3), sendo 10% de cada dose aplicada em pré-plantio e o restante via água de irrigação, diariamente, por 30 dias. As doses de N influenciaram positivamente os índices fisiológicos (comprimento, largura, área foliar, número de folíolos, massas de matérias fresca e seca) e nitrogenados (teor e conteúdo de N e N-NO3 na matéria seca e índice SPAD) tanto na quarta folha quanto na folha velha. Da mesma forma, doses de N influenciaram
positiva-Received for publication on April 13th, 2012 and accepted on August 23th, 2012.
1 Supported by CNPq and FAPEMIG.
2 Agronomist engineer, Master in Science.Departamento de Fitotecnia, Universidade Federal de Viçosa, Campus Viçosa, Avenida Peter Henry Rolfs, s/n, 36570-000, Viçosa, Minas Gerais, Brasil. [email protected]
3 Agronomist engineer, Ph. D. Departamento de Fitotecnia, Universidade Federal de Viçosa, Campus Viçosa, Avenida Peter Henry Rolfs, s/n, 36570-000, Viçosa, Minas Gerais, Brasil. [email protected]
4 Agronomists, Doctors in Science. Departamento de Fitotecnia, Universidade Federal de Viçosa, Campus Viçosa, Avenida Peter Henry Rolfs, s/n, 36570-000, Viçosa, Minas Gerais, Brasil. [email protected] (corresponding author); [email protected], [email protected]
5 Agronomist, Doctor in Science. Empresa de Pesquisa Agropecuária de Minas Gerais, Vila Gianetti, Casa 46, Campus da UFV, 36570-000, Viçosa, Minas Gerais, Brasil. [email protected]
Carla de Bem dos Santos Souza2, Paulo Cezar Rezende Fontes3, Marialva Alvarenga Moreira4,Mário Puiatti4,
Herminia Emilia Prieto Martinez4, Roberto Fontes Araújo5
Production of basic potato seed minitubers in substrate
and different nitrogen rates
1The optimal dose of nitrogen (N) in potato crop depends on the production system. The objective of this study was to determine the optimal dose of N for the production of basic potato seed minitubers and evaluate the effect of N rates on physiological and nitrogen indices in the youngest fully developed leaf (fourth leaf) and in the oldest leaf of the plants at 60 days after planting. The experiment was conducted in a greenhouse at the Departamento de Fitotecnia da Universidade Federal de Viçosa. The treatments consisted of five N rates (0, 45, 90, 180 and 360 mg dm-3), with 10% of each dose applied at planting and the remainder through irrigation water, daily, for 30 days. The nitrogen rates positively influenced the physiological indices (length, width, leaf area, number of leaves, fresh mass and dry mass) and nitrogen (level and content of N and N-NO3 in the dry mass and SPAD) both in the fourth leaf and in the oldest leaf. Likewise, the N rates positively influenced the number and mass of harvested tubers. The largest number (5.44 tubers/plant) and the maximum mass of tubers (243.5 g/plant) were obtained with 360.0 and 332.9 mg N dm-3, respectively. Therefore, the mass and number of tubers were not optimized by the same N rate. The critical SPAD index was 38.8 in the fourth leaf, which was more sensitive to the effect of N rates than the oldest leaf.
INTRODUCTION
The basic potato seed used in Brazil is either imported from other countries, especially the Netherlands, or produced inside the country by tissue culture. The production by tissue culture demands a specialized laboratory, which is not accessible to all producers.
In the production cost of potato crops, the seeds are the most costly production factor consisting of 30% of the final cost. The high cost and low availability of quality seeds in the country lead producers to use inadequate material for propagation without the desired productivity. Potatoes are mainly propagated by vegetative methods from seed tubers, which ensure the obtaining of material identical to the original. However, when infected, seed tubers favor the spread of diseases, particularly viruses, leading to early crop degeneration and directly influencing tuber quality and production.
An alternative method for potato propagation is the use of detached sprouts from seed potato tubers. The sprout technique was pioneerly proposed and used in Brazil by Souza-Dias (2001, 2004, 2006a; 2006b). This technique allow reduction in the importation and the production of new basic minitubers, enhancing up to 200% the productivity rate for each unit of imported potato seed (Souza-Dias, 2006a). Therefore, sprout planting can be an important advance in the production process of basic seed potatoes.
The cultivation of basic seed potatoes in substrate is widespread among producers (Grigoriadou & Leventakis, 1999; Lommen, 1999) because it results in higher nutrient utilization and improved product quality. The production of seed potatoes in substrate involves the use of different propagation material, including the sprout. Greenhouse sprout planting in substrate is practical and of low cost. Each sprout cutting originates minitubers that can be directly planted in the field (Dias, 2002).
Some authors found that nitrogen (N) influences both the mass and the number of tubers per plant (Errebhi et al., 1998; Meyer & Marcum, 1998). Nitrogen also positively affects the size of the aerial part of the plant, which will
influence the intercepted radiation and dry matter accumulation. Nitrogen also has a negative effect by providing dry matter accumulation in other parts of the plant, other than the tuber (Alonso, 1996). The excess of N can delay tuber production extending the cycle and reducing productivity (Gil et al. 2002; Busato, 2007, Silva, 2007). The growth and development of stems, leaves and leaf area influence plant production of tubers (Oliveira, 2000).
The use of N criteria or indices is important in monitoring the plant nitrogen status and properly manage the potato crop fertilization program. The chemical analysis of dry leaf matter to obtain N and nitrate levels is common in this monitoring, which are expensive and time demanding procedures that need to be performed by qualified technicians. However, they can be replaced by rapid tests that allow sensing the nutritional status of the plant in real time (Fontes, 2011).
The SPAD index, measured by the chlorophyll meter can indirectly indicate the nitrogen status of the plant (Guimarães et al., 1999; Sources, 2001). It is a rapid test accomplished in the field and allows sensing the nutritional status of plants in real time. Therefore, it can become a viable alternative for the production system of seed potatoes in vases containing substrate. Another hypothesis is that the morphological (number of leaves, plant height and length of the fourth leaf) or physiological plant characteristics may be used as an index of plant N status (Fontes, 2011).
Although there are a number of studies establishing indices to assess the nitrogen status of potato plants (Gui-marães et al., 2008; Junior Sampaio et al., 2008, Silva et al., 2009, 2011; Braun et al., 2010; Busato et al., 2010; Coelho et al., 2010; Fontes et al., 2010; Moreira et al., 2011a) and the nitrogen management in minitubers production in vases and other systems containing substrate (Junior Sampaio, 2005 ; Moreira, 2008), there is still a lack of research to determine the critical value of these indices in the production system of basic seed potatoes multiplication by sprouts in substrate.
mente o número e a massa de tubérculos colhidos. O maior número (5,44 tubérculos/planta) e a máxima massa de tubérculos (243,5 g/planta) foram obtidos com 360,0 e 332,9 mg dm-3 de N, respectivamente. Portanto, número e massa de tubérculos não foram otimizados pela mesma dose de N. O índice crítico SPAD na quarta folha foi 38,8, sendo essa mais sensível ao efeito de doses de N do que a folha mais velha.
This study aimed to determine the optimal dose of nitrogen (N) in the production of basic seed potatoes minitubers and to evaluate the effect of nitrogen (N) rates on nitrogen and physiological indices both in the youngest fully developed leaf (fourth leaf) and in the oldest leaf at 60 days after planting.
MATERIAL AND METHODS
The experiment was conducted in a greenhouse at the Horticultural Department of the Federal University of Vi-çosa, in ViVi-çosa, Minas Gerais. The chapel type greenhouse had the following dimensions: width of 9 m, length of 40 m, side posts height of 3 m, ridge height 3.8 m, with the top, front and side closed with a crystal clear polyethylene film, 0.1 mm thick.The treatments consisted of 5 N rates (0, 45, 90, 180 and 360 mg dm3), with 10% of each dose applied at planting and the remainder through daily irrigation water, for 30 days.
Each dose was divided into 30 portions and diluted in 200 mL of water, applied to each vase daily, starting 20 days after planting (DAP). Ammonium nitrate was the nitrogen source. The experiment was a randomized block design with six replications. Each plot consisted of two vases, with one sprout planted, cultivar Asterix, detached from a basic potato seed. After the detachment, the sprout was disinfested following the methodology described by Bryan et al. (1981).
The substrate was uniformly fertilized with macro and micronutrients and quantity was expressed in mg dm-3: 3,400 of Simple Superphosphate, 3,600 Magnesium Sulphate, 1,320 Potassium Chloride, 2.5 Boric Acid, 2.5 Zinc Sulphate, 2.5 copper sulphate, 2.5 ferrous sulphate, 2.5 manganese sulphate and 0.25 of ammonium molybdate, irrigated when needed.
The evaluation began at 26 days after planting and then every seven days until final harvest. The following determinations were made: leaf green color intensity, length, width and number of leaflets of the fourth leaf (FL) and old-leaf (OL), stem length and number of leaves of the potato plant. Leaf green colour intensity was determined in the terminal leaflet of the FL and OL, between 8 and 11 a.m. with the SPAD-502 portable chlorophyll meter (Soil-Plant Analysis Development 502).
Ten days after the final application of N, at 60 days after planting (DAP), one plant was collected from each treatment. The SPAD index was determined in the termi-nal leaflet of the FL and OL. Following, the plant was harvested and separated into fourth leaf, old leaf, leaves, stems and tubers. The number of leaflets was counted and length, width and area of FL and OL were determined. Leaf area of FL and OL was obtained using the LICOR 3100 meter.
The masses of FL and OL were weighed (fresh matter), placed in paper bags and dried to a constant weight in a forced air oven set at 70 ºC, and dry matter was determined. After drying, the material was ground in a Wiley mill with a 20-mesh sieve to determine nitrogen concentration after sulphuric digestion, using the Nessler’s reagent (Jackson, 1958). In another subsample, N-NO3 was extracted with demineralized water in a water bath at 45 °C for 1 h, determining the concentration of N-NO3 by colorimetry, using a spectrophotometer at 410 nm (Cataldo et al., 1975). At 60 days after planting, the agronomic characteristics of the plant were also determined: leaf area, stem length, number of leaves and tubers, fresh matter mass and dry matter mass of leaves, stems and tubers.
The final harvest occurred at 89 days after planting. The plants were harvested, separated into fourth leaf, old leaf, leaves, stems, roots and tubers and weighed to de-termine fresh matter mass, then, after drying the dry matter mass was determined. The tubers were counted and classified according to the largest diameter: type V (16 to 23 mm); type VI (13 to 16mm); type VII (10 to 13 mm); and type VIII (<10 mm), according to IMA (2003).
Data were submitted to analysis of variance and regression, using the software SAEG (SAEG, 1993) to fit the model that best describes the relationship between dependent and independent variables.
RESULTS AND DISCUSSION
Throughout the cycle and during the nine assessment periods, the number of leaflets in OL was the only non-destructive index that was not affected by N and, therefore, cannot be considered a suitable index to evaluate the variability of N supply to plants. Indices that were most early (47 DAP) influenced by N rates were: SPAD index, fourth leaf width, stem length and number of leaves (Tables 1, 2 and 3).
The increase in the SPAD index suggests an increase in the green color intensity of the plant. According to Fontes (2001), this index indirectly measures SPAD chlorophyll content, indicating the N status of the plant. Chlorophyll is the pigment involved in photosynthesis, and positive correlations between the photosynthetic rate and N content of the plant have been reported by several authors (Stol & Keulen, 1991; Makino et al., 1994). Vos & Bom (1993) also found a positive correlation between chlorophyll concentration in the plant and N addition in the potato crop, indicating that the chlorophyll content in the plant is related to the nitrogen nutritional status (Minotti et al., 1994).
values decreased to 18.5 (FL) and 5.0 (OL) (Table 1). It was observed that after the application of N, which occurred at 50 DAP, the green color of the leaf was reduced due to either initial senescence or the absence of N to
stimulate leaf development. The plant also reached its peak nitrogen accumulation. Similar results were found by several authors (Minotti et al., 1994; Rodrigues, 2004; Junior Sampaio, 2005; Moreira et al., 2011a).
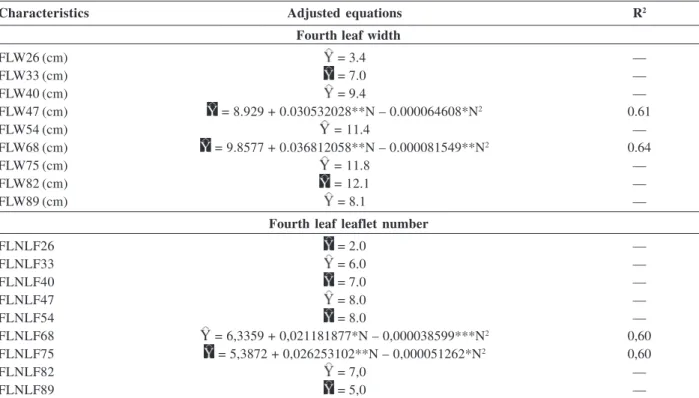
Table 2. Adjusted equations for width (W) measured in the fourth leaf (FL) and number of leaflets (NL) of the fourth leaf of potato plants at 26, 33, 40, 47, 54, 68, 75, 82 and 89 days after planting, as a function of nitrogen (N), and coefficients of determination
Characteristics Adjusted equations R2
Fourth leaf width
FLW26 (cm) = 3.4 —
FLW33 (cm) = 7.0 —
FLW40 (cm) = 9.4 —
FLW47 (cm) = 8.929 + 0.030532028**N – 0.000064608*N2 0.61
FLW54 (cm) = 11.4 —
FLW68 (cm) = 9.8577 + 0.036812058**N – 0.000081549**N2 0.64
FLW75 (cm) = 11.8 —
FLW82 (cm) = 12.1 —
FLW89 (cm) = 8.1 —
Fourth leaf leaflet number
FLNLF26 = 2.0 —
FLNLF33 = 6.0 —
FLNLF40 = 7.0 —
FLNLF47 = 8.0 —
FLNLF54 = 8.0 —
FLNLF68 = 6,3359 + 0,021181877*N – 0,000038599***N2 0,60
FLNLF75 = 5,3872 + 0,026253102**N – 0,000051262*N2 0,60
FLNLF82 = 7,0 —
FLNLF89 = 5,0 —
**, * and *** - significant at 1, 5 and 10% probability by “t” test, respectively.
Table 1. Adjusted equations for SPAD index (S) measured in the fourth leaf (FL) and old-leaf (OL) of potato plants at 26, 33, 40, 47,
54, 68, 75, 82 and 89 days after planting, as a function of nitrogen (N), and coefficients of determination
Characteristics Adjusted equations R2/r2
Fourth leaf
SFL26 = 34.4 —
SFL33 = 35.0 —
SFL40 = 35.4 —
SFL47 = 30.1318 + 0.05988705**N - 0.00009963**N2 0.95
SFL54 = 28.3825 + 0.02072222**N 0.85
SFL68 = 20.7975 + 0.03838889**N 0.92
SFL75 = 13.5233 + 0.05281**N 0.95
SFL82 = 18.2 —
SFL89 = 4.3829 + 0.042398148**N 0.74
Old leaf
SOL26 = 28.1 —
SOL33 = 39.3 —
SOL40 = 38.5 —
SOL47 = 34.4121 + 0.04800524**N - 0.00008703*N2 0.80
SOL54 = 30.4517 + 0.02077778**N 0.69
SOL68 = 16.0208 + 0.04416667**N 0.84
SOL75 = 11.0688 + 0.04119444**N 0.83
SOL82 = 8.4 —
SOL89 = 5.0 —
Fourth leaf length (FLL) and old leaf length (OLL) was influenced by N rates at 75 DAP for the FL and at 82 DAP for OL, represented by the following equations: FLL = 14.064 + 0.0850235**N – 0.0001823**N2; R2 = 0.78 and OLL = 9.080 + 0.089010**N – 0.000232**N2; R2 = 0.73. Nitrogen levels affected the width of the FL at 47 and 68 DAP (Table 2) and OL only at 82 DAP, represented by the equation: LFV = 3.931 + 0.067055**N – 0.000180**N2; R2 = 0.71.
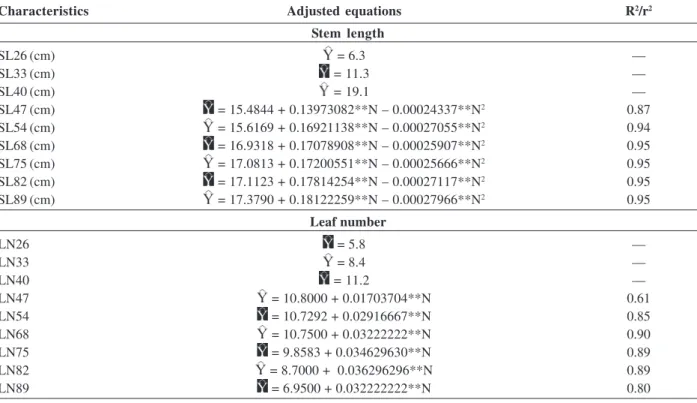
Stem length increased during the cycle, reaching 46.7 cm with a dose of 332.9 mg dm-3 of N (Table 3). Moreira (2008) found that plant height also showed a linear response to the application of increasing doses of N throughout the crop cycle, but the plants were smaller. This difference in the results can be explained by the use of cultivar Agate.
The average leaf number of 21.5 was lower than that found by Junior Sampaio et al. (2008) using cultivar
Table 3. Adjusted equations for stem length (SL) and leaf number (LN) of potato plants at 26, 33, 40, 47, 54, 68, 75, 82 and 89 days
after planting, as a function of nitrogen (N), and coefficients of determination
Characteristics Adjusted equations R2/r2
Stem length
SL26 (cm) = 6.3 —
SL33 (cm) = 11.3 —
SL40 (cm) = 19.1 —
SL47 (cm) = 15.4844 + 0.13973082**N – 0.00024337**N2 0.87
SL54 (cm) = 15.6169 + 0.16921138**N – 0.00027055**N2 0.94
SL68 (cm) = 16.9318 + 0.17078908**N – 0.00025907**N2 0.95
SL75 (cm) = 17.0813 + 0.17200551**N – 0.00025666**N2 0.95
SL82 (cm) = 17.1123 + 0.17814254**N – 0.00027117**N2 0.95
SL89 (cm) = 17.3790 + 0.18122259**N – 0.00027966**N2 0.95
Leaf number
LN26 = 5.8 —
LN33 = 8.4 —
LN40 = 11.2 —
LN47 = 10.8000 + 0.01703704**N 0.61
LN54 = 10.7292 + 0.02916667**N 0.85
LN68 = 10.7500 + 0.03222222**N 0.90
LN75 = 9.8583 + 0.034629630**N 0.89
LN82 = 8.7000 + 0.036296296**N 0.89
LN89 = 6.9500 + 0.032222222**N 0.80
** - Significant at 1% probability by “t” test.
Table 4. Adjusted equations for area (LA), length (L), width (W), number of leaflets (LN), fourth leaf and old leaf fresh matter mass (FM) and dry matter mass (DM) at 60 days after planting, as a function of nitrogen (N), and coefficients of determination
Characteristics Adjusted equations R2
Fourth leaf
LA (cm2) = 60.3164 + 0.77728404**N – 0.00189585*N2 0.86
L(cm) = 14.9650 + 0.06477967**N – 0.00015627**N2 0.91
W (cm) = 9.3635 + 0.051988075**N – 0.000159099**N2 0.88
LN = 6.0078 + 0.025116481**N – 0.000065545*N2 0.64
MF (g) = 2.8978 + 0.030868852**N – 0.000095979**N2 0.85
DM (g) = 0.1730 + 0.0026092316**N – 0.000007059**N2 0.87
Old leaf
LA (cm2) = 9.1 —
L(cm) = 8.7 —
W (cm) = 3.8 —
LN = 2.0 —
MF (g) = 0.6 —
DM (g) = 0.04 —
Monalisa, with 25.8 leaves/plant (Table 3). The number of leaves is influenced by the nitrogen availability in the plant. This means that within certain limits the greater the amount of nitrogen supplied to the plant, the greater the stimulus for leaf production (Vos & Putten, 1998).
At 60 days after planting (DAP), one plant was harvested to determine the effect of N levels on plant growth and development. At this time, the N had been fully applied, and the indexes in FL (SPAD, leaf area, length, width, number of leaves, fresh and dry matter, N-NO3 and N-NH4 content) were significantly influenced by the N dose. Inversely, the same indices in OL did not respond to the application of increasing doses of N.
The SPAD index in the fourth leaf, at 60 DAP, increased as the N rates increased (Figure 2). The estimated critical value for the SPAD index, at 60 DAP, at calculated dose of 332.9 mg dm-3 of N was of 37.3 for FL and 25.7 for OL.
The level and the content of N-NO3 in the fourth leaf at 60 DAP, increased with increasing dose of N (Table 5). The content of N-NO3 was not determined for the oldest leaf, for there was not enough material to perform the analysis. No significance was found for the N-NH4 content in FL and OL, but the N content in the FL positively
responded to N rates (Table 5). This can be partially explained by the response to N rates in the production of leaf dry matter, since to obtain the content, it is necessary to multiply the N concentration by the dry matter production of organ studied. The results for the level and content of N-NO3 and the N-NH4 content of the fourth leaf at 60 DAP are in accordance with the results found by Moreira et al. (2011b) who observed that the N-NO3 and N-NH4 concentration in FL and OL varied with increasing N doses. Similar results were found by Porter & Sisson (1993) and Gil (2001).
Therefore, the use of these indices and the N-NH4 content in OL at 60 DAP did not reflect the positive effect of N levels verified on tuber production at the final harvest. Busato (2007) and Moreira et al. (2011b) found higher SPAD index values at 60 DAP, which may be explained by the use of a different cultivar, the ‘Asterix’. The SPAD indices reported by these authors were 43.02 and 38.2, respectively. In the work by Busato (2007) this value was 168.2 kg ha-1 for potato field production.
Due to N mobility in the phloem, when the N concentration in the OL is equal or higher than the concentration in FL, it is assumed that there is satisfactory N in the plant environment. In the present study, the
Table 5. Adjusted equations for the nitrate level (N-NO3) and content (N-NO3c) in the dry matter of the fourth leaf, organic nitrogen level (N-NH4) and organic nitrogen content (N-NH4 c) in the fourth leaf (FL) and old leaf (OL) dry matter, at 60 days after planting, as a function of nitrogen (N), and coefficients of determination
Characteristics Adjusted equations R2/r2
N-NO3-FL (g kg-1) = -0.053 + 0.005181513**N 0.76
CN-NO3-FL (g/plant) = -0.0016 + 0.00015525**N 0.90
N-NH4 FL (g kg-1) = 38.4 —
N-NH4 OL (g kg-1) = 17.3 —
N-NH4 c FL (g/plant) = 0.3740 + 0.0133329418**N – 0.0000278598**N2 0.64
N-NH4 c OL (g/plant) = 0.06 —
** - Significant at 1% probability by “t” test.
Table 6. Adjusted equations for leaf area (LA), stem length (SL), leaf number (LN), number of tubers (NT), fresh matter mass (FM)
and dry matter mass (DM) of leaf (L), stem (S), root (R) and tuber (T), at 60 DAP, as a function of nitrogen (N), and coefficients of determination
Characteristics Adjusted equations R2/r2
LA (cm2) = 322.5537 + 6.775538**N 0.96
SL (cm) = 15.9438 + 0.10654853**N 0.91
LN (ud/pl) = 9.5790 + 0.035791826**N 0.87
TN (ud/pl) = 2.5613 + 0.032247493**N – 0.000080901**N2 0.76
FML (g) = 11.2995 + 0.42832774**N – 0.00062132***N2 0.93
DML (g) = 1.0654 + 0.021866635**N 0.98
FM S(g) = 3.0718 + 0.061494253**N 0.94
DMS (g) = 0.1479 + 0.0037375479**N 0.96
DMR (g) = 0.2392 + 0.001740000**N 0.92
FMT (g) = 25.5679 + 0.72756851**N – 0.00139023*N2 0.87
opposite was observed, indicating the occurrence of N mobilization.
From these results it can be inferred that the N doses used at 60 DAP were adequate for plant development and, therefore, this period can be used for nutritional analysis in the estimation of tuber production.
The following characteristics from the fourth leaf at 60 DAP can be used as optimum growth standards: 108.97 cm2 of area, 19.2 cm of length, 9.0 cm of width, 7.1 leaflets; 2.50 g of fresh matter mass, 0.26 g of dry matter mass, 1.8 g kg-1 of N-NO
3 in dry matter; 38.4 g kg-1 of
N-Figure 2. SPAD index in the fourth leaf (SFL), at 60 days after planting, as a function of nitrogen (N).
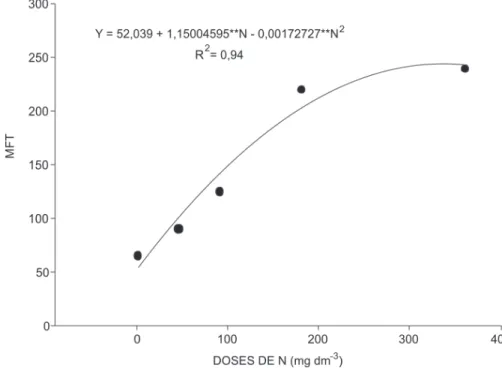
Figure 1. Fresh matter mass of tubers (FMM) at the final harvest (89 days after planting) as a function of nitrogen (N).
NH4 in dry matter, and 37.3 of SPAD index. In the same period, the plant must present the following characteristics: 2578.1 cm2 of leaf area, 51.4 cm of stem length, 21.5 leaves, 4.3 tubers/plant, 85.0 g of leaf fresh matter mass; 23.5 g of stem fresh matter mass; 113.70 g of tuber fresh matter mass, 5.2 g kg-1 of N-NO
3 in leaf dry matter, 26.1 g kg-1 of N-NO
3 in stem dry matter, 0.2 g kg-1 of N-NO3 in root dry matter, 43.4 g kg-1 of N-NH
4 in dry leaf, 14.1 g kg-1 of N-NH
4 in stem dry matter, 11.4 g kg-1 of N-NH4 in root dry matter and 6.2 g kg-1 of N-NH
At the final harvest, at 89 DAP, tuber number and fresh and dry matter masses of leaves, stem, roots and tubers increased with increasing dose of N. Only the fresh matter mass of minitubers showed quadratic response to N application (Figure 1). The number of tubers and the dry matter masses of leaf, stem and tuber reached the highest values at the dose of 360 mg dm -3. Regarding tuber classification, 84% of the produced tubers were below type VI; and the highest percentage was found for type IV (31%). The results for the number of tubers and tuber dry matter mass are consistent with those observed by Gil (2001) and Moreira et al. (2011b) who found that increasing doses of N increased the number of tubers. In field, the N fertilization also increases tuber productivity, as found by Bélanger et al. (2000) and Rodrigues (2004).
The optimal N dose is usually established as a function of the production of fresh matter mass of tubers. In this case, the optimal dose of N or the maximum production dose was 332.9 mg dm-3. In the present study, the linear model was adjusted and, therefore, we did not achieve the necessary N dose to obtain the maximum number of tubers. The highest N rate (360.0 mg dm-3) was considered optimal.
CONCLUSIONS
Nitrogen positively influences the number and mass of tubers produced and the physiological indices of both the fourth leaf and old-leaf.
The number of tubers and tuber mass was not optimized by the same dose of N. The highest number of tubers per plant (5.44 pc) was obtained at 360 mg dm-3 N and maximum fresh matter mass of tubers per plant (243.5 g) was obtained at 332.9 mg dm-3 N.
The green color intensity (determined by the SPAD index) and physiological indices (leaf area, length, width, number of leaflets, fresh and dry matter mass and nitrogen content in dry matter), determined in the fourth leaf and old-leaf were positively influenced by N rates, and the fourth leaf was more sensitive to the effects of N rate than the old-leaf.
The critical SPAD index in the fourth leaf varied according to plant age and the highest value of 38.8 was obtained at 47 days after planting.
AKNOWLEDGEMENTS
The authors would like to thank the Conselho Nacio-nal de Desenvolvimento Científico e Tecnológico (CNPq), for granting the master’s scholarship, and FAPEMIG for the financial support.
REFERENCES
Alonso F (1996) El cultivo da patata. Barcelona, Ediciones Mundi Prensa. 272p.
Bélanger GW, Walsh JR, Richards JE, Milburn PH & Ziadi N (2000) Critical nitrogen curve and nitrogen nutrition index for potato in Eastern Canada. American Journal of Potato Research, 78:355-364.
Braun H, Fontes PCR, Busato C, Cecon PR, Coelho FS & Silva MCC (2010) Effect of nitrogen rates and days of light exposure on greening evaluated by visual scale and chlorophyll meter of tubers of potato cultivars. International Journal of Food, Agriculture and Environment (Print), 8:933-938.
Bryan JE, Meléndez G & Jackson MT (1981) Esquejes de brote, una técnica de multiplicación rápida de papa. Serie I: Técnicas de multiplicación rápida. Lima, Centro Internacional de La Papa (CIP). 10p.
Busato C (2007) Características da planta, teores de nitrogênio nas folhas e produtividade de tubérculos de cultivares de batata em função de doses de nitrogênio. Dissertação de Mestrado. Universidade Federal de Viçosa, Viçosa. 142p.
Busato C, Fontes PCR, Cecon PR & Braun H (2010) Seasonal variation and threshold values for chlorophyll meter readings on leaves of potato cultivars. Journal of Plant Nutrition, 33:2148-2156.
Cataldo DA, Harron M, Schrader LEL & Youings VL (1975) Rapid colorimetric determination of nitrate in plant tissue by nitration of salicylic acid. Communications in Soil Science and Plant Analysis, 6:71-80.
Coelho FS, Fontes PCR, Puiatti M, Neves JCL & Silva MCC (2010) Dose de nitrogênio associada à produtividade de batata e índices do estado de nitrogênio na folha. Revista Brasileira Ci-ência do Solo, 34:1175-1183.
Dias JACS (2002) Uso de brotos descartados de batata-semente economiza divisas. Ciência e Cultura, 54:10.
Errebhi M, Rosen CJ, Gupta SC & Birong DE (1998) Potato yield response and nitrate leaching as influenced by nitrogen management. Agronomy Journal, 90:10-15.
Fontes PCR (2001) Diagnóstico do estado nutricional das plantas. Viçosa, UFV. 122p.
Fontes PCR, Braun H, Busato C & Cecon PR (2010) Economic optimum nitrogen fertilization rates and nitrogen fertilization rate effects on tuber characteristics of potato cultivars. Potato Research, 53:1-2.
Fontes PCR (2011)Nutrição mineral de plantas - avaliação e diagnose. Viçosa, Arka Editora. 296p.
Gil PT (2001) Índices e eficiência de utilização de nitrogênio pela batata influenciado por doses de nitrogênio em pré-plantio e em cobertura. Dissertação de Mestrado. Universidade Federal de Viçosa, Viçosa. 81p.
Gil PT, Fontes PCR, Cecon PR & Ferreira FA (2002) Índices SPAD para diagnóstico do estado de nitrogênio e para o prog-nóstico da produtividade da batata. Horticultura Brasileira, 20:611-615.
Grigoriadou K & Leventakis N (1999) Large scale commercial production of potato minitubers, using in vitro techniques. Potato Research, 42:607-610.
Guimarães MA, Silva DHJ, Fontes PCR & Mattedi AP (2008) Produtividade e sabor dos frutos de tomate do grupo salada em função de podas. Bioscience Journal, 24:32-38.
IMA (2003) Instituto Mineiro de Agropecuária. Portaria n.567, 30 de janeiro de 2003. Disponível em: <http:// imanet.ima.mg.gov.br/nova/legis/portarias_pdf/0567.pdf.> Acessado em: 20 de março de 2007.
Jackson ML (1958) Soil chemical analysis. Englewood Cliffs, Prentice Hall. 498p.
Keulen HV & Stol W (1991) Quantitative aspects of nitrogen nutrition in crops. Fertilizer Research,27:151-160.
Lommen WLM (1999) Causes for low tuber yields of transplants from in vitro potato plantlets of early cultivars after field planting. Journal of Agricultural Science, 133:275-584.
Makino A, Nakano H & Mae T (1994) Responses of ribulose-1.5-biphosphate carboxylase, cytochrome f, and sucrose synthesis enzymes in rice leaves to leaf nitrogen and their relationships to photosynthesis. Plant Physiology, 105:173-179.
Meyer RD & Marcum DV (1998) Potato yield, petiole nitrogen, and soil nitrogen response to water and nitrogen. Agronomy Journal, 90:420-429.
Minotti PL, Halseth DE & Sieczka JB (1994) Field chlorophyll measurements to asses the nitrogen status of potato varieties. HortScience, 29:1497-1500.
Moreira MA (2008) Característica da planta e produção de batata-semente básica em substrato com diferentes materiais de propa-gação. Tese de Doutorado. Universidade Federal de Viçosa, Vi-çosa. 174p.
Moreira MA, Fontes PCR, Cecon PR & Araújo RF (2011a) Índi-ces para avaliar o estado de nitrogênio da batata multiplicada por distintos materiais propagativos. Revista Ceres, 58:384-392.
Moreira MA, Fontes PCR, Cecon PR & Araújo RF (2011b) Sele-ção de índices para o diagnóstico do estado de nitrogênio de batata-semente básica. Acta Scientiarum Agronomy, 33:335-340.
Oliveira CAS (2000) Potato crop growth as affected by nitrogen and plant density. Pesquisa Agropecuária Brasileira, 35:939-950.
Porter GA & Sisson JA (1993) Yield, marked quality and petiole nitrate concentration of non-irrigated Russed Burbank and Shepody potatoes in response to sidedressed nitrogen. American Potato Journal, 70:101-116.
Rodrigues MA (2004) Establishment of continuous critical levels for indices of plant and presidedress soil nitrogen status in the potato crop. Communications in Soil Science and Plant Analysis, 35:2067-2085.
SAEG (1993) Sistema para análises estatísticas. v. 5.0. Viçosa, Fundação Artur Bernardes.
Sampaio Júnior JD (2005) Produção de mini-tubérculos de batata-semente em vaso a partir de plântula multiplicada por cultura de tecido, broto e mini-tubérculo em função de doses de nitrogê-nio. Dissertação de Mestrado. Universidade Federal de Viçosa, Viçosa. 90p.
Sampaio Júnior JD, Fontes PCR, Moreira MA & Guimarães MA (2008) Produção de mini-tubérculo semente de batata, em fun-ção de doses de nitrogênio aplicadas ao substrato. Bioscience Journal, 24:1-9.
Silva MCC (2007) Critérios para manejo da adubação nitrogenada da batata em duas épocas de plantio. Tese de Doutorado. Uni-versidade Federal de Viçosa, Viçosa. 144p.
Silva MCC, Fontes PCR & Miranda GV (2009) Índices SPAD e produção de batata, em duas épocas de plantio, em função de doses de nitrogênio. Horticultura Brasileira, 27:17-22. Silva MCC, Braun H, Coelho FS & Fontes PCR (2011) Índice
SPAD determinado em diferentes horários e posições no folíolo da batata sob fertilização nitrogenada. Revista Ciência Agronô-mica, 42:971-977.
Souza-Dias JAC (2001) Batata com laranja - Produção de minitubérculos de batata-semente via plantio de broto livre de vírus e aumenta a renda de citricultores. Cultivar HF, 2:8-11. Souza-Dias JAC (2004) Tecnologia de produção de minitubérculos
de batata-semente pré-básica, através do plantio de brotos li-vres de vírus. Batata Show, 4:7.
Souza-Dias JAC (2006a) Tecnologia do broto/batata-semente: Uma idéia que está brotando na bataticultura. O Agrário, 1:7.
Souza-Dias JAC (2006b) Caruaru (PE) e Esperança (PB): Redutos para a tecnologia APTA-IAC do broto/batata-semente na pro-dução de batata-semente “Classe Básica”. Batata Show, 1:12-13.
Vos J & Bom M (1993) Hand-held chlorophyll meter: a promising tool to asses the nitrogen status of potato foliage. Potato Research, 36:301-308.