Received September 23, 2008 and accepted July 2, 2009. Corresponding author: afbranco@uem.br
Replacement of dicalcium phosphate by rock phosphate in cattle diets:
nutrients digestibility, plasma parameters, ruminal fermentation and
microbial synthesis efficiency
Sabrina Marcantonio Coneglian1, Antonio Ferriani Branco2, Kátia Cylene Guimarães3, Daniel Suzigan Mano4, Julio Cezar Barreto1, Vanessa Ruiz Fávaro5
1Doutorando em Zootecnia pela Universidade Estadual de Maringá – Maringá, PR.
2Departamento de Zootecnia – UEM. Av. Colombo, 5790. CEP 87020-900 - Maringá-PR. Pesquisador do CNPq. 3Instituto Federal Goiano, Rio Verde, GO.
4Mestrando em Zootecnia pela Universidade Estadual de Maringá – Maringá, PR.
5Mestranda em Zootecnia pela Universidade Estadual Paulista “Júlio de Mesquita Filho“ – Jaboticabal, SP.
ABSTRACT - This study was conducted in order to evaluate the effects of replacing dicalcium phosphate by rock phosphate in diets of growing steers. It was determined the following aspects: apparent digestibility of diets; phosphorus (P), calcium and fluorine apparent absorption; ruminal pH; ruminal ammonia concentration; microbial efficiency and plasma P. Five rumen fistulated Holstein steers weighting 275 - 283 kg were used. Experimental design was a 5 × 5 Latin square and diets consisted of 0, 25, 50, 75 and 100% of dicalcium phosphate replacement by rock phosphate in the mineral supplement. Addition of rock phosphate in the diets produced a linear increase on intake, rumen outflow and fecal output and total disappearance of fluorine. Diets did not differ to apparent absorption of calcium as well as dry matter, organic matter, crude protein, neutral detergent fiber and non-fiber carbohydrates intake, excretion, digestion and partial and total apparent digestibility. Plasma phosphorus was not influenced by diets and the average was 5.93 mg/dL. There was no difference for ruminal pH and ruminal ammonia concentration. Dicalcium phosphate replacement did not affect apparent and true protein microbial synthesis. Total replacement of dicalcium phosphate by rock phosphate in growing steer mineral supplement did not affect ruminal environment and protein synthesis in rumen. Considering this, dicalcium phosphate replacement in growing steer diets decreases P absorption and depending on its requirements it should be carefully seen.
Key Words: phosphorus sources, plasma phosphorus, rumen microbial protein, ruminal fermentation
Substituição de fosfato bicálcico pelo fosfato de rocha em dieta para
bovinos: digestibilidade dos nutrientes, parâmetros plasmáticos,
fermentação ruminal e eficiência de síntese microbiana
RESUMO - Este estudo foi conduzido para avaliar os efeitos da substituição do fosfato bicálcico pelo fosfato de rocha na dieta de bovinos em crescimento. Foram determinados a digestibilidade aparente das dietas, a absorção aparente do fósforo, cálcio e flúor, o pH ruminal, a concentração de amônia ruminal, a eficiência microbiana e o fósforo no plasma utilizando-se cinco bovinos da raça Holandesa Preto-e-Branco, fistulados, pesando entre 275 e 283 kg. O delineamento estatístico foi um quadrado latino 5 × 5 e as dietas consistiram de 0, 25, 50, 75 e 100% de substituição do fosfato bicálcico pelo fosfato de rocha no suplemento mineral. A adição de fosfato de rocha nas dietas ocasionou aumento linear na ingestão, no fluxo omasal, no fluxo fecal e no desaparecimento total do flúor. As dietas não diferiram quanto à absorção aparente do cálcio, assim como em relação à ingestão, excreção, digestão e digestibilidades aparentes parcial e total da matéria seca, matéria orgânica, proteína bruta, fibra em detergente neutro e carboidratos não-fibrosos. O fósforo no plasma não foi influenciado pelos tratamentos e a média foi de 5,93 mg/dL. Não houve diferença para o pH ruminal e concentração de amônia ruminal. A substituição do fosfato bicálcico não afetou a síntese microbiana aparente e verdadeira de proteína. A total substituição do fosfato bicálcico pelo fosfato de rocha em suplementos minerais em bovinos em crescimento não afetou o ambiente ruminal e a síntese de proteína no rúmen. Assim, a substituição do fosfato bicálcico em dietas para bovinos em crescimento diminui a absorção de fósforo e deveria ser vista com cuidado dependendo dos requerimentos.
Introduction
Ruminants and their ruminal microorganisms should receive the correct amount of energy and nutrients. Among these nutrients are the minerals which need to be offered according to animals requirements in right amounts and proportions using available sources.
Daily phosphorus supplementation is necessary to match requirements of ruminants even in the maintenance state. Actually, phosphorus is also considered an important source of environment contamination. Concerning about environment problems, animal nutritionists are trying to feed animals with the right amount of phosphorus, avoiding as much as possible fecal losses. In that case, it is important to use high quality phosphorus sources that offer a good combination of high total phosphorus content and high phosphorus apparent absorption coefficient.
Currently, some countries, farmers and industries are trying to replace low fluorine phosphorus sources as dicalcium phosphate by other sources as rock phosphate which has a high amount of fluorine. About 90% of ingested fluorine is stored in teeth and bones as calcium fluoride and fluorine apatite forms. According to Suttie (1980) high fluorine ingestion by cattle causes generalized hyperostosis and in some cases it is possible to observe bone lesions.
Considering the importance of phosphorus in ruminant nutrition and its availability in different feeds, this study was conducted to evaluate the effect of dicalcium phosphate replacement by rock phosphate over partial and total nutrient apparent digestibility, partial and total phosphorus, calcium and fluorine absorption, ruminal pH, ruminal ammonia concentration, microbial efficiency synthesis and plasma phosphorus in cattle.
Material and Methods
Five Holstein steers with 275 to 283 kg of body weight on average, implanted with ruminal cannula were used. Animals were individually housed in pens provided with feeders and automatic waterers. During experimental period they received meals twice a day (8:30 am and 4:30 pm). They were also weighted at the beginning of each experimental period to adjust dry matter intake that was set at 2.5% of body weight. Chromic oxide was used as the external marker to calculate rumen outflow and fecal output. Marker was added to rumen, during the morning meal, using a daily amount of 10.0 g from the seventh day in each period.
Experimental period consisted of 21 days with 17 days of diet adaptation followed by four days of sampling (orts, rumen outflow, feces and blood).
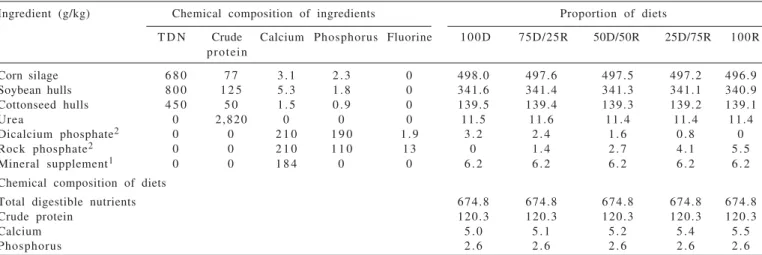
The diets were as it follows: 100D = 100% dicalcium phosphate and 0% rock phosphate; 75D/25R = 75% dicalcium phosphate and 25% rock phosphate; 50D/50R= 50% dicalcium phosphate and 50% rock phosphate and 25D/75R= 25% dicalcium phosphate and 75% rock phosphate; 100R= 0% dicalcium phosphate and 100% rock phosphate. Diets also had different phosphorus/fluorine ratio which were the following: 100D= 441.58; 75D/25R= 119.20; 50D/50R= 68.90; 25D/75R= 48.45 and 100R= 37.36. Diets consisted of 2.4 g/kg of phosphorus. Feeds supplied 1.8 g/kg of total phosphorus, and then additional phosphorus (0.6 g/d) was supplied as dicalcium phosphate (DP; Foscálcio®, Serrana Nutrição Animal – Bunge, São Paulo/BRA) and/or rock phosphate (RP) straight into the rumen trough ruminal cannula.
Rumen outflow (500 mL) and feces samples (50 g) were collected to determine partial and total apparent digestibility
1The composition of mineral supplement was: S = 12g/kg; Mg = 12 g/kg; Na = 100 g/kg; Ca = 120 g/kg; Co = 30 ppm; Cu = 800 ppm; I = 50 ppm; Mn = 1.200 ppm; Se = 12 ppm; Zn = 3.200 ppm.
2Supplied through ruminal cannulas during all experimental period. D = dicalcium phosphate; R = rock phosphate.
Ingredient (g/kg) Chemical composition of ingredients Proportion of diets
T D N Crude Calcium Phosphorus Fluorine 100D 75D/25R 50D/50R 25D/75R 100R protein
Corn silage 6 8 0 7 7 3 . 1 2 . 3 0 498.0 497.6 497.5 497.2 496.9 Soybean hulls 8 0 0 1 2 5 5 . 3 1 . 8 0 341.6 341.4 341.3 341.1 340.9 Cottonseed hulls 4 5 0 5 0 1 . 5 0 . 9 0 139.5 139.4 139.3 139.2 139.1
Urea 0 2,820 0 0 0 11.5 11.6 11.4 11.4 11.4
Dicalcium phosphate2 0 0 2 1 0 1 9 0 1 . 9 3 . 2 2 . 4 1 . 6 0 . 8 0
Rock phosphate2 0 0 2 1 0 1 1 0 1 3 0 1 . 4 2 . 7 4 . 1 5 . 5
Mineral supplement1 0 0 1 8 4 0 0 6 . 2 6 . 2 6 . 2 6 . 2 6 . 2
Chemical composition of diets
Total digestible nutrients 674.8 674.8 674.8 674.8 674.8
Crude protein 120.3 120.3 120.3 120.3 120.3
Calcium 5 . 0 5 . 1 5 . 2 5 . 4 5 . 5
Phosphorus 2 . 6 2 . 6 2 . 6 2 . 6 2 . 6
of dry matter (DM), crude protein (CP), neutral detergent fiber (NDF), ether extract (EE), non-fiber carbohydrate (NFC) and phosphorus, calcium and fluorine apparent absorption. Rumen outflow samples were taken as described by Huhtanen et al. (1997). Samples were stored in plastic bags, labeled and frozen (-20oC) until processing and analysis
were carried out. During four days of each sampling period, a total of four rumen outflow and feces samples by animal/ treatment were collected and composed. Samples were collected as the following: day 1 (8 a.m.), day 2 (12 p.m.), day 3 (4 p.m.) and day 4 (8 p.m.). Samples were dried in an oven at 55oC for 96 hours, and ground through a 1 mm screen,
using a hammer mill. Then, they were mixed, using the same amount and considering the dry weight, to make up animal/ treatment/period pooled samples.
Orts were daily collected, weighted, sampled, and frozen until analysis. Concentrate and silage samples were weekly collected and pooled to the entire experimental period. Orts and silage samples were submitted to the same procedures as rumen outflow and feces samples were.
On day 18 of each experimental period, blood samples were collected 3 hours after feeding in heparinized vials. Then, plasma extraction was done in refrigerated centrifuges (4oC) at 2500 x g for 15 minutes.
Ruminal fluid (100 mL) was collect on day 21 at 0, 2, 4, 6 and 8 hours after morning feeding in each experimental period. The 0 corresponded to the sample collected immediately before morning feeding while 8 was immediately before afternoon feeding. The pH was measured immediately after sampling, and then 1 mL of 1:1 sulfuric acid (v,v) was added to only 50 mL of ruminal fluid sample. After that, samples were stored (-20oC) until
performing of ammonia analysis.
Also, on day 21, a total of 1.5 kg of ruminal content was collected and mixed with 500 mL of saline solution (0.9%). The mixture was homogenized in a blender, strained through four layersof cheesecloth and then frozen (-20oC).
Feeds, orts, rumen outflow and feces samples were analyzed for dry matter, crude protein, ether extract, calcium (AOAC, 1990), neutral detergent fiber (Van Soest et al., 1991), phosphorus (Fiske & Subbarow, 1925) and fluorine (Singer & Armstrong, 1968). Plasma was analyzed for inorganic phosphorus (Little et al., 1971).
The chromic concentration in rumen outflow and feces samples was determined using an atomic absorption spectrophotometer (Shimadzu®) according to the technique
described by William & David (1962). These data were used together with nutrient concentration to calculate rumen outflow and fecal output of nutrients.
Ammonia concentration in ruminal fluid was measured by Ferner’s method (1965). Ruminal content samples were analyzed as described by Cecava et al. (1990). Purine concentration in ruminal bacteria and in rumen outflow was determined by using the procedure described by Ushida et al. (1985), with modifications proposed by Bohnert et al. (1998).
Non-fiber carbohydrates were calculated using the following equation (Sniffen et al., 1992): NFC = 100 – (%NDFn + %CP + %EE + %ASH), where: NDFn = neutral detergent acid corrected for nitrogen. To obtain total digestible nutrients calculated (TDNc) of diets, it was used the equation of Sniffen et al. (1992): TDN = DP + DNDF + (DEE x 2.25) + DNFC, where: DP = digestible protein; DNDF = digestible neutral detergent fiber; DEE = digestible ether extract; DNFC = digestible non-fiber carbohydrates. An estimative of total digestible nutrients (TDN) values were also done using the equations proposed by Weiss et al. (1999). The ruminal and intestinal apparent nutrient digestibility coefficient were calculated using marker intake and fecal marker concentrations.
Total N microbial flow to duodenum (g/day) was estimated by dividing ruminal microbial N: microbial purine ration by total rumen outflow N: rumen outflow purine ratio then multiplying this by N individual total flow. True microbial efficiency synthesis was expressed in g of microbial N/kg of organic matter (OM) truly fermented in the rumen. The corrected organic matter digested in rumen (COMDR) was calculated using the equation:
COMDR= OM ingested (g/d) – [rumen outflow OM – microbial OM (g/d)]
Data were analyzed as a 5 × 5 Latin square using the GLM procedure of SAS (1998), and differences were considered significant at P<0.05. The pH and ammonia data were analyzed using the proc mixed statement in the same program. The model used to the variance analysis was: Yijk = µ + Ai + Pj + Tk + eijk where: µ= overall means;
Ai = animal effect; Pj = period effect; Tk= diet effect; eijk = error effect.
Results and Discussion
Phosphorus requirements suggested for growing steers are 14 g/day (NRC, 1984), 11 g/day (AFRC, 1991) and also 12 g/day (NRC, 1996). It is interesting to notice that AFRC (1991) value was calculated by using concentrated based diets, so, it increases to about 17 g/day to diets that are made up with more than 50% of forage. Considering this, phosphorus intake in this experiment was appropriated (13.7 g), with basal diet supplying 89% of total phosphorus.
Phosphorus fecal output observed in this experiment was similar to that observed by Vitti et al. (2000) in which steers were fed with dicalcium phosphate and two rock phosphate (Patos de Minas and Tapira) and reported high phosphorus fecal output values to diets using rock phosphate. Peeler (1972) stated that phosphorus lost is unavoidable and dependent on animal physiologic status, age, gender, besides phosphorus source bioavailability.
Phosphorus fecal output was 450 and 710 g/kg of ingested phosphorus for 100D and 100R diets, respectively. Phosphorus flow through gastrointestinal tract was composed not only by diet phosphorus but also by endogenous phosphorus, so, negative values (Table 2) observed for phosphorus ruminal apparent absorption coefficient indicate a significant salivary phosphorus
secretion. Ruminants are able to recycle endogenous phosphorus efficiently through saliva, secreting concentrations from 496 to 1,240 mg/L, therefore increasing its ruminal concentration (Rosol & Carpem, 1997).
Phosphorus total apparent absorption value (0.543) observed for 100D diet agrees with Lofgreen (1960), Arrington et al. (1963) and Barreto (2009), that reported values from 0.50 to 0.70. On the other hand, considering the use of rock phosphate, Vitti et al. (1991), fed sheep and found phosphorus total absorption values of 0.310 and 0.367 for Patos de Minas and Tapira rock phosphate, respectively, which are higher than the one found in this experiment (0.289) for 100R treatment.
Diets had similar rumen apparent digestibility of phosphorus (-0.23), but phosphorus apparent absorption showed linear decrease when rock phosphate was included in the supplement (Table 2) as a result of intestinal phosphorus absorption decrease. This result could be attributed to the chemical structure of dicalcium phosphate and tricalcium phosphate (rock phosphate) that influence abomasal phosphorus solubility and absorption in the small intestine.
There were no diet effects (P<0.05) on evaluated calcium parameters (Table 2), and it was not affected
Diets1 Regression R2 SE
100D 75D/25R 50D/50R 25D/75R 100R
Phosphorus
Intake (g/day) 13.6 13.7 13.6 13.9 13.9 Y = 13.73 NS2 0.18
Omasal flow (g/day) 16.8 17.1 16.6 17.2 17.0 Y = 16.94 NS 0.19 Fecal flow (g/day) 6 . 2 7 . 1 7 . 2 8 . 5 9 . 9 Y = 5.15 + 0.86 X 0.57 0.23 Ruminal apparent absorption -0.23 -0.25 -0.22 -0.24 -0.23 Y = - 0.23 NS 3.45 Intestinal apparent absorption 0.63 0.58 0.57 0.51 0.42 Y = 0.68– 0.05 X 0.57 2.91 Total apparent absorption coefficient 0.54 0.48 0.47 0.39 0.29 Y = 0.61 – 0.06 X 0.43 3.62
Calcium
Intake (g/day) 36.5 36.3 36.4 37.3 37.5 Y = 36.80 NS 0.58 Omasal flow (g/day) 28.8 28.6 28.9 29.9 30.3 Y = 29.30 NS 0.45 Fecal flow (g/day) 16.3 16.5 16.9 17.3 17.7 Y = 16.94 NS 0.44 Ruminal apparent absorption 0.21 0.21 0.21 0.20 0.19 Y = 0.20 NS 1.45 Intestinal apparent absorption 0.43 0.42 0.42 0.42 0.42 Y = 0.42 NS 1.66 Total apparent absorption 0.54 0.55 0.54 0.54 0.53 Y = 0.54 NS 1.15
Fluorine
Intake (g/day) 30.1 140.1 220.3 370.6 480.2 Y = 32. 30+ 4.13 X 0.70 3.20 Omasal flow (g/day) 20.2 100.1 160.5 330.4 440.4 Y = 25.06 + 3.89 X 0.57 3.20 Fecal flow (g/day) 10.4 70.5 120.1 250.5 350.7 Y = 8.40 +2.87 X 0.44 2.70 Ruminal apparent absorption 0.33 0.29 0.27 0.11 0.08 Y = 0.32 – 0.002 X 0.54 3.62 Intestinal apparent absorption 0.49 0.30 0.25 0.24 0.20 Y = 0.39 – 0.002 X 0.45 3.83 Total apparent absorption 0.65 0.50 0.46 0.32 0.27 Y = 0.60 – 0.003 X 0.76 3.97
Phosphorus plasma concentration
P (mg/dL) 5.896 5.958 5.956 5.788 6.038 Y = 5.927 NS 0.067
1 100D = 100% dicalcium phosphate and 0% rock phosphate; 75D/25R = 75% dicalcium phosphate and 25% rock phosphate; 50D/50R = 50% dicalcium phosphate and 50% rock phosphate, 25D/75R= 25% dicalcium phosphate and 75% rock phosphate; 100R= 0% dicalcium phosphate and 100% rock phosphate.
2 NS: No significance (P>0.05).
(P>0.05) by phosphorus source in supplement. Calcium absorption is dependent on the availability of calcium from the feedstuffsand inorganic calcium sources in the diet, and the efficiency of intestinal calcium absorption in the animal being fed. The amount of calcium absorbed from the diet will generally equal the requirement of the body for calcium if the diet contains enough available calcium (NRC, 2001). According to Challa et al. (1989), this element is strongly influenced by level of phosphorus in the diet. Since diet phosphorus concentration was the same for all diets, absence of this treatment effect in calcium parameters is reasonable.
Inclusion of rock phosphate in supplement increased linearly (P<0.05) intake, rumen outflow and fecal excretion of fluorine. Ruminal fluorine disappearance was quadratic (P<0.05) and the highest calculated disappearance was observed for 67% of dicalcium phosphate replacement. Increasing rock phosphate in supplement lead to a linear decrease on ruminal and intestinal fluorine, and total apparent absorption (P<0.05).
Fluorine ingestion increase with the inclusion of rock phosphates in the supplement and occured as result of its higher fluorine concentration. Cattle are less tolerant to fluorine toxicity than other livestock animals (Phillips & Suttie, 1960). In long-term, experiments with beef cattle above 30 mg of dietary fluorine per g of dry matter diet caused excessive wear and staining of teeth (Hobbs & Merriman, 1959). In another study, beginning with young calves and lasting for 7 years, the tolerance for soluble florine was also 30 mg/g of the dry matter diet (Shupe et al., 1963).
Suttie et al. (1957) stated that fluorine ingestion limits were 40 mg/kg of DM/day and fluorosis signs started in 3 to 5 years when 50 mg of F/kg of dry matter were daily ingested. In this experiment fluorine daily ingestion (F/kg of DM) was: 5.24 mg; 24.54 mg; 38.49 mg; 64.65 mg and 83.92 mg to 100D, 75D/25R, 50D/50R, 25D/75R and 100R, respectively.
Fluorine ingestion for 25D/75R and 100R diets was 132.4 and 171.5 µg of F/g of LW, respectively. According
to NRC (1974), fluorine ingestions higher than 100 µg of
F/g of body weight was harmful to most animals. Linear increase of rumen outflow and fecal excretion of fluorine (P<0.05) could be partly as a consequence of a higher fluorine ingestion from rock phosphate.
Phosphorus plasma levels observed in this experiment were within the limits considered normal (4 to 8 mg/dL) by NRC (2001). In growing cattle, phosphorus plasma concentration range from 6 to 8 mg/dL (NRC, 2001).
Correlations between ingested and plasmatic phosphorus were also evaluated. While Braithwaite (1985) and Ternouth & Sevilla (1990) reported a correlation between ingested and plasmatic phosphorus; other authors state that for sheep and cattle this correlation does not exist or it is extremely low (Braithwaite, 1984; Challa & Braithwaite, 1988). In this experiment it was also observed a low correlation between ingested and plasmatic phosphorus (0.30, R2 = 0.65) and between absorbed and plasmatic phosphorus (0.20, R2 = 0.63).
Dry matter, crude protein, neutral detergent fiber, ether extract and non-fiber carbohydrate intake, rumen outflow and fecal output as well as ruminal, intestinal and total apparent digestibility coefficients were not affected (P>0.05) when rock phosphate replaced dicalcium phosphate (Table 3). Corrected total digestible nutrients (TDNc) values (Table 3) was not influenced (P>0.05) by dicalcium phosphate replacement.
Ruminal dry matter apparent digestibility ranged from 0.55 to 0.57, and total dry matter apparent digestibility ranged from 0.69 to 0.73. Digestion of crude protein was not affected by replacement of dicalcium phosphate by rock phosphate.
Bacterial composition (dry matter, organic matter and nitrogen organic matter)was not affected (P>0.05) by diets (Table 4). Bacterial OM average value (863.8 g/kg) was lower than Clark et al. (1992) who reported high variation of bacterial organic matter values. The authors state that, a saline solution contamination during isolation bacterial procedure could be responsible for this variation.
Bacterial organic matter and nitrogen average values were lower than values found at Cornell Net Carbohydrate and Protein System (CNCPS), which recommends values of 95.6 and 10% respectively (Russell et al., 1992).
Replacing dicalcium phosphate by rock phosphate in supplement did not influence (P>0.05) rumen outflow of bacterial and nonbacterial nitrogen (Table 5).
There was no effect (P>0.05) of phosphorus source on true and apparent microbial synthesis efficiency. Apparent microbial synthesis efficiency, expressed as grams of bacterial nitrogen per kilogram of organic matter digested in rumen (g of N bac./kg of OMDR), ranged from 37.21 to 40.22. True microbial synthesis efficiency, also expressed as g of N bac./kg of COMDR, ranged from 17.30 to 18.78 (Table 4).
Diet1 Regression R2 SE
Item (g/kg) 100D 75D/25R 50D/50R 25D/75R 100R
Dry matter 904.1 919.8 897.0 923.6 928.1 Y = 914.5 NS 0 . 5 Organic Matter 849.6 872.2 851.0 872.7 873.4 Y = 863.8 NS 2 . 3
Nitrogen 64.5 64.9 60.5 65.2 64.1 Y = 63.9 NS 0 . 3
Table 4 - Dry matter, organic matter and N of mixed ruminal bacteria in cattle receiving diets with inclusion of rock phosphate in replacement of dicalcium phosphate
1 100D= 100% dicalcium phosphate and 0% rock phosphate; 75D/25R= 75% dicalcium phosphate and 25% rock phosphate; 50D/50R= 50% dicalcium phosphate and 50% rock phosphate, 25D/75R= 25% dicalcium phosphate and 75% rock phosphate; 100R= 0% dicalcium phosphate and 100% rock phosphate.
SE = Standard error.
NS = No significance (P>0.05).
Diet1 Regression R2 SE
100D 75D/25R 50D/50R 25D/75R 100R
Dry matter
Intake (g/day) 5746.6 5709.2 5724.2 5732.3 5722.0 Y = 5726.86 NS 13.50 Omasal flow (g/day) 2597.1 2462.6 2461.9 2429.3 2444.2 Y = 2479.02 NS 4.23 Feces output (g/day) 1770.8 1625.3 1546.1 1559.3 1557.4 Y = 1611.78 NS 4.91 Ruminal apparent digestibility coefficient 0.55 0.57 0.57 0.58 0.57 Y = 0.57 NS 1.28 Intestinal apparent digestibility coefficient 0.32 0.34 0.37 0.36 0.36 Y = 0.35 NS 0.56 Total apparent digestibility coefficient 0.69 0.72 0.73 0.73 0.73 Y = 0.72 NS 0.86
Crude protein
Intake (g/day) 716.0 711.9 714.0 714.7 713.5 Y = 714.02 NS 5.49 Omasal flow (g/day) 619.2 619.3 625.8 632.0 621.3 Y = 623.52 NS 8.80 Feces output (g/day) 240.3 230.5 234.0 230.0 240.1 Y = 234.98 NS 2.51 Ruminal apparent digestibility coefficient 0.14 0.13 0.12 0.12 0.13 Y =0. 13 NS 2.11 Intestinal apparent digestibility coefficient 0.61 0.63 0.63 0.64 0.61 Y =0. 62 NS 1.36 Total apparent digestibility coefficient 0.66 0.68 0.67 0.68 0.66 Y = 0.67 NS 0.71
Neutral detergent fiber
Intake (g/day) 3423.1 3613.3 3614.0 3622.6 3615.4 Y = 3577.68 NS 3.85 Omasal flow (g/day) 1331.2 1385.8 1325.7 1322.3 1378.0 Y = 1348.60 NS 4.68 Feces output (g/day) 1016.1 1075.3 977.8 980.6 1006.4 Y = 1011.24 NS 16.14 Ruminal apparent digestibility coefficient 0.61 0.62 0.63 0.64 0.62 Y =0. 62 NS 2.41 Intestinal apparent digestibility coefficient 0.24 0.22 0.26 0.26 0.27 Y = 0.25 NS 2.58 Total apparent digestibility coefficient 0.70 0.70 0.73 0.73 0.72 Y = 0.72 NS 1.01
Ether extract
Intake (g/day) 84.0 83.5 83.8 83.1 83.6 Y = 83.60 NS 0.69 Omasal flow (g/day) 31.0 30.0 33.4 31.5 33.5 Y = 31.88 NS 0.82 Feces output (g/day) 8 . 3 8 . 2 10.0 10.8 10.1 Y = 9.48 NS 0.77 Ruminal apparent digestibility coefficient 0.63 0.64 0.60 0.62 0.60 Y =0. 62 NS 1.94 Intestinal apparent digestibility coefficient 0.73 0.73 0.70 0.66 0.70 Y = 0.70 NS 4.91 Total apparent digestibility coefficient 0.90 0.90 0.88 0.87 0.88 Y = 0.89 NS 1.77
Non fiber carbohydrates
Intake (g/day) 1225.8 1002.3 1015.4 1011.0 1009.2 Y = 1052.74 NS 10.40 Omasal flow (g/day) 390.9 206.0 237.2 217.2 194.9 Y = 249.24 NS 18.68 Feces output (g/day) 316.4 122.0 133.9 145.8 106.2 Y = 164.86 NS 80.07 Ruminal apparent digestibility coefficient 0.68 0.79 0.77 0.79 0.81 Y =0. 77 NS 3.23 Intestinal apparent digestibility coefficient 0.19 0.41 0.44 0.33 0.46 Y = 0.36 NS 8.79 Total apparent digestibility coefficient 0.74 0.88 0.87 0.86 0.90 Y = 0.85 NS 1.46
Total digestible nutrients (g/kg) 7 2 6 7 5 3 7 6 0 7 5 9 7 5 9 Y = 751.4 NS 1.40
Table 3 - Intake, omasal flow, feces output, ruminal apparent digestibility coefficient, intestinal apparent digestibility coefficient, total apparent digestibility coefficient and TDN in cattle receiving diets with inclusion of rock phosphate in replacement of dicalcium phosphate
1 100D= 100% dicalcium phosphate and 0% rock phosphate; 75D/25R= 75% dicalcium phosphate and 25% rock phosphate; 50D/50R= 50% dicalcium phosphate and 50% rock phosphate, 25D/75R= 25% dicalcium phosphate and 75% rock phosphate; 100R= 0% dicalcium phosphate and 100% rock phosphate.
Ruminal pH variation as function of time and diets ranged from 6.44 to 6.91 and it was not affected (P>0.05) by dicalcium phosphate replacement. Ruminal pH response was quadratic (P<0.05) when considering the time after feeding (Figure 1). Minimum values, observed two hours post-feed time, were 6.44; 6.50; 6.44; 6.45 and 6.53, to the 100D, 75D/25R, 50D/50R, 25D/75R and 100R diets, respectively.
Ruminal pH showed a quadratic response (P<0.05) regarded to the time after feeding and all pH values for all diets were higher than 6.2, which is considered by Orskov & Fraser (1975) as a minimal limit to an appropriate cell wall degradation without harming celullotic microorganism. The unique significant source of starch in experimental diets was corn silage, which participated in less than 50% of dry matter. This fact contributed to maintain a favorable pH for microbial activity because quickly ruminal degradable carbohidrates concentration in the diets was low.
Replacement of dicalcium phosphate by rock phosphate did not affect (P>0.05) ruminal ammonia concentration that was also quadratic; however, regression equation had a low determination coefficient (r2) showing that the curve had a
variation in their data.
Ruminal ammonia concentration also showed a quadratic response in relation to time. Ruminal ammonia values ranged from 3.51 to 36.10 mg/100 mL of ruminal fluid and diets with higher rock phosphate addition showed higher ruminal ammonia amounts, but there was no diet effect. The highest ammonia values were found two hours after feeding while the lowest ones were immediately before feeding times (8:30 am and 4:30 pm).
In all diets, most of the time, ruminal ammonia concentration were higher than 5 mg/dL, considered as a
Figure 1 - pH and N-NH3 variation as function of post-feeding time Equation pH=6.75048 -0.05353X + 0.00708X2; r2=69.15 Equation N-NH3= 11.17222 + 0.77373X - 0.12142X2; r2=58.23
Diets1 Regression R2 SE
100D 75D/25R 50D/50R 25D/75R 100R
Intake (g/d)
Total nitrogen 114.6 113.9 114.2 114.3 114.2 Y = 114.3 NS 5 . 5
Omasal flow (g/d)
Total nitrogen 99.1 99.1 100.1 101.1 99.4 Y = 99.8 NS 8 . 8 Bacterial nitrogen 96.1 96.1 97.1 98.1 96.4 Y = 96.8 NS 2 . 7 Non bacterial nitrogen 3 . 0 3 . 0 3 . 0 3 . 0 3 . 0 Y = 3.0 NS 0.03
Microbial efficiency
Apparent (g N/kg OMDR) 39.7 40.2 37.2 38.5 40.0 Y = 39.1 NS 2 . 2 True (g N/kg COMDR) 18.6 18.4 18.5 17.3 18.8 Y = 18.3 NS 0 . 9
1 100D= 100% dicalcium phosphate and 0% rock phosphate; 75D/25R= 75% dicalcium phosphate and 25% rock phosphate; 50D/50R= 50% dicalcium phosphate and 50% rock phosphate, 25D/75R= 25% dicalcium phosphate and 75% rock phosphate; 100R= 0% dicalcium phosphate and 100% rock phosphate.
SE = Standard error.
NS = No significance (P>0.05).
Table 5 - Intake and flow of nitrogen and microbial synthesis
Conclusions
Replacement of dicalcium phosphate with rock phosphate does not influence dry matter, crude protein, neutral fiber detergent, and non-fiber carbohydrates intake, fecal output and digestibility as well as total digestible nutrients values. There is an increase in phosphorous excretion when dicalcium phosphate is replaced by rock phosphate in cattle diets. Intake and flow of fluorine increase while its apparent absorption decreases with inclusion of rock phosphate. Plasma phosphorus is not influenced by phosphorus: fluorine ratio in diets. Ruminal pH and ruminal ammonia concentration is not influenced by dicalcium phosphate replacement. The same response is observed for microbial efficiency synthesis considering this experimental condition.
References
.
AGRICULTURAL AND FOOD RESEARCH COUNCIL – AFRC. Technical Commitee on Responses to Nutrients. A reappraisal of the calcium and phosphorus requeriments of sheep and cattle.
Nutrition Abstracts and Reviews - Series B Livestock Feeds
and Feeding, v.61, p.573-612, 1991.
ARRINGTON, L.R.; OUTLER, J.C.; AMMERMAN, C.B. et al. Absorption, retention and tissue deposition of labeled inorganic phosphate by cattle. Journal of Animal Science, v.22, p.940- 942, 1963.
ASSOCIATION OF OFFICIAL ANALYTICAL CHEMISTRY -AOAC. Official Methods of Analysis. 16.ed. Arlington: AOAC International, 1995. 1025p.
BARRETO, J.C.; BRANCO, A.F.; SANTOS, G.T. et al. Avaliação dos efeitos de fontes de fósforo na dieta sobre parâmetros do meio ruminal e eficiência de síntese microbiana, digestibilidade dos nutrientes e fósforo plasmático em bovinos. R e v i s t a Brasileira de Zootecnia, v.38, p.760-769, 2009.
BOHNERT, D.W.; LARSON, B.I.; BAUER, M.L. et al. Nutritional Evaluation of poultry by-product meal as a protein source for ruminants: Effects on performance and nutrient flow and disappearance in steers. Journal of Animal Science, v.76, p.2474-2484, 1998.
BRAITHWAITE, G.D. Some observations on phosphorus homeostasis and requirements of sheep. J o u r n a l o f Agriculture Science, v.102, p.295-306, 1984.
BRAITHWAITE, G.D. Endogenous fecal loss of phosphorus in growing lambs and the calculation of phosphorus requirements.
Journal of Agriculture Science, v.105, p.67-72, 1985. BREVES, G.; SCHRODER, B. Comparative aspects of
gastrointestinal phosphorus metabolism. Nutrition Research and Reviews, v.4, p.125-140, 1991.
CECAVA, M.J.; MERCHEN, N.R.; GAY, L.C. et al. Composition of ruminal bacteria harvested from steers as influenced by dietary energy level, feeding frequency, and isolation techniques. Journal of Dairy Science, v.73, p.2480-2888, 1990.
CHALLA, J.; BRAITHWAITE, G.D. Phosphorus and calcium metabolism in growing calves with special emphasis on homeostasis. Journal of Agriculture Science, v.110, p.573-581, 1988.
CHALLA, J.; BRAITHWAITE, G.D.; DHA NOA, M.S. Phosphorus homeostasis in growing calves. J o u r n a l o f A g r i c u l t u re Science, v.112, p.217-226, 1989.
CLARK, J.H.; KLUSMEYER, T.H.; CAMERON, M.R. Microbial protein synthesis and flows of nitrogen fractions to the duodenum of dairy cows. Journal of Dairy Science, v.75, p.2304-2323, 1992.
FISKE, C.H.; SUBBAROW, Y. The colorimetric determination of phosphorus. J o u r n a l o f B i o l o g i c a l C h e m i s t r y, v.66,
p.375-400, 1925.
HOBBS, C.S.; MERRIMAN, G.M. The effect of eight years continuous feeding of different levels of fluorine and alleviators on feed consumption, teeth, bones and production of cows.
Journal of Animal Science, v.18, p.1526-1529, 1959. HUHTANEN, P.; BROTZ, P.G.; SATTER, L.D. Omasal sampling
technique for assessing fermentative digestion in the fore stomach of dairy cows. Journal of Animal Science, v.75, p.1380-1392, 1997.
LENG, R.A. Factors affecting the utilization of poor quality forages by ruminants particularly under tropical conditions. Nutrition Research and Reviews, v.3, p.277-303, 1990.
LITTLE, D.A.; ROBINSON, P.J.; PLAYNE, M.J. et al. Factors affecting blood inorganic phosphorus in cattle. Australian Veterinary Journal, v.47, p.153-156, 1971.
L O F G R E E N , G. P. T h e a v a i l a b i l i t y o f t h e p h o s p h o r u s i n d i c a l c i u m p h o s p h a t e , b o n e , m e a l , s o f t p h o s p h a t e a n d c a l c i u m p h y t a t e s f o r m a t u r e w e t h e r s . J o u r n a l o f N u t r i t i o n, v.70, p.58-62, 1960.
NATIONAL RESEARCH COUNCIL - NRC. Subcommittee on Fluorosis. E f f e c t s o f f l u o r i d e i n a n i m a l s. Washington:
National Academy Press, 1974. 62p.
NATIONAL RESEARCH COUNCIL - NRC. Nutrient requirements of beef cattle. 6.ed. Washington, D.C.: National Academy Press, 1984. 89p.
NATIONAL RESEARCH COUNCIL - NRC. Nutrient requirements of beef cattle. 7. rev. ed. Washington, D.C.: National Academy
Press, 1996. 234p.
ORSKOV, E.R.; FRASER, C. The effects of processing of barley-based supplements on rumen pH, rate of digestion and voluntary intake of dried grass in sheep. British Journal of Nutrition, v.34, p.493-500, 1975.
PEELER, H.T. Biological availability of nutrients in feeds: availability of major mineral ions. J o u r n a l o f A n i m a l Science, v.35, p.695-712, 1972.
PHILLIPS, P.H.; SUTTIE, J.W. The significance of time in intoxication of domestic animals by fluoride. A.M.A. Archives of Industrial Health, v.21, p.343-345, 1960.
ROSOL, C.; CARPEM, C. Biological availability of nutrients in feeds: availability of major mineral ions. Journal of Animal Science, v.35, p.695-712, 1997.
RUSSEL, J.B.; O’ CONNOR, J.D.; FOX, D.G. et al. A net carbohydrate and protein system for evaluating cattle diets. I. Ruminal fermentation. Journal of Animal Science, v.70, p.3551-3561, 1992.
SATTER, L.D.; SLYTER, L.L. Effect of ammonia concentration on rumen microbial production in vitro. British Journal of Nutrition, v.32, p.199-208, 1974.
SHUPE, J.L.; MINER, M.L.; GREENWOOD, D.A. et al. The effect of fluorine on dairy cattle. 2. Clinical and pathologic effects. American Journal of Veterinary Research, v.24, p.964-979, 1963. SINGER, L.; ARMSTRONG, W.D. Determination of fluoride in
bone with the fluoride electrode. Analytical Chemistry, v.40, p.613-614, 1968.
SNIFFEN, C.J.; O’CONNOR, J.D.; VAN SOEST, P.J. et al. A net carbohydrate and protein system for evaluating cattle diets: II. Carbohydrate and protein availability. Journal of Animal Science, v.70, p.3562-3577, 1992.
STATISTICAL ANALYSIS SYSTEM - SAS. SAS/STAT®®®®® User’s
guide. Cary: SAS Institute Inc., 1998. (CD-ROM).
SUTTIE, J.W. Nutritional aspects of fluoride toxicosis. Journal of Animal Science, v.51, p.759-766, 1980.
TERNOUTH, J.C.; SEVILLA, C.C. The effects of low levels of dietary phosphorus upon the dry matter intake and metabolism of lambs. A u s t r a l i a n J o u r n a l o f A g r i c u l t u re R e s e a rc h, v.41, p.175-184, 1990.
USHIDA, K.; LASSALAS, B.; JOUANY, J.P. Determination of assay parameters for RNA analysis in bacterial and duodenal samples by spectrophotometry: influence of sample treatment and preservation. Reproduction Nutrition and Development, v.25, p.1037-1046, 1985.
VALADARES FILHO, S.C. Eficiência de síntese de proteína microbiana, degradação ruminal e digestibilidade intestinal da proteína bruta, em bovinos. In: SIMPÓSIO INTERNACIONAL SOBRE EXIGÊNCIAS NUTRICIONAIS DE RUMINANTES. 1995, Viçosa, MG. Anais...
Viçosa, MG: DZO/UFV, 1995. p.355-388.
VAN SOEST, P.J.; ROBERTSON, J.B.; LEWIS, B.A. Methods for dietary fiber, neutral detergent fiber, and non-starch
polysaccharides in relation to animal nutrition. Journal of Dairy Science, v.74, p.3583-3597, 1991.
VITTI, D.M.S.S. Avaliação da disponibilidade biológica do fósforo dos fosfatos bicálcico, Patos de Minas, Tapira e f i n o s d e Ta p i r a p a r a o v i n o s p e l a t é c n i c a d a d i l u i ç ã o isotópica. 87f. 1991. Tese (Doutorado) - Instituto de Pesquisas Energéticas Nucleares/USP, Piracicaba.
VITTI, D.M.S.S.; ABDALA, A.L.; SILVA FILHO, J.C. et al. Métodos para o diagnóstico da deficiência de fósforo em ruminantes. P e s q u i s a A g ro p e c u á r i a B r a s i l e i r a, v.23, p.645-651, 2000.
WEISS, W.P.; FISHER, G.R.; ERICKSON, G.M. Effect of source of neutral detergent fiber and starch on nutrient utilization by dairy cows. Journal of Dairy Science, v.72, p.2308-2315, 1 9 9 9 .
WILLIAM, C.H.; DAVID, D.J. The determination chromic oxide in feces samples by atomic absorption spectrophotometry.